-
Paper Information
- Next Paper
- Previous Paper
- Paper Submission
-
Journal Information
- About This Journal
- Editorial Board
- Current Issue
- Archive
- Author Guidelines
- Contact Us
American Journal of Intelligent Systems
p-ISSN: 2165-8978 e-ISSN: 2165-8994
2013; 3(1): 13-19
doi:10.5923/j.ajis.20130301.02
A Novel Seasonal Fuzzy Time Series Method to the Forecasting of Air Pollution Data in Ankara
 Abstract
 Reference
 Full-Text PDF
 Full-text HTML
Ozge Cagcag1, Ufuk Yolcu2, Erol Egrioglu1, CagdasHakan Aladag3
1Department of Statistics, University of Ondokuz Mayis, Samsun, 55139, Turkey
2Department of Statistics, Giresun University, Giresun, 28000, Turkey
3Department of Statistics, Hacettepe University, Ankara, 06800, Turkey
Correspondence to: Erol Egrioglu, Department of Statistics, University of Ondokuz Mayis, Samsun, 55139, Turkey.
| Email: |  |
Copyright © 2012 Scientific & Academic Publishing. All Rights Reserved.
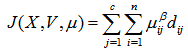
Fuzzy time series forecasting methods have been widely studied in recent years. This is because fuzzy time series forecasting methods are compatible with flexible calculation techniques and they do not require constraints that exist in conventional time series approaches. Most of the real life time series exhibit periodical changes arising from seasonality. These variations are called seasonal changes. Although, conventional time series approaches for the analysis of time series which have seasonal effect are abundant in literature, the number of fuzzy time series approaches is limited. In almost all of these studies, membership values are ignored in the analysis process. This affects forecasting performance of the approach negatively due to the loss of information as well as posing a situation that is incompatible with the basic features of fuzzy set theory. In this study, for the first time in literature, a new seasonal fuzzy time series approach which considers membership values in both identification of fuzzy relations and defuzzification steps was proposed. In the proposed method, we used fuzzy C-means clustering method in fuzzification step and artificial neural networks (ANN) in identification of fuzzy relation and defuzzification steps which consider membership values. The proposed method was applied to various seasonal fuzzy time series and obtained results were compared with some conventional and fuzzy time series approaches. In consequence of this evaluation, it was determined that forecasting performance of the proposed method is satisfactory.
Keywords: Seasonal Fuzzy Time Series, Fuzzy C-means, Artificial Neural Network, Membership Degree, Air Pollution
Cite this paper: Ozge Cagcag, Ufuk Yolcu, Erol Egrioglu, CagdasHakan Aladag, A Novel Seasonal Fuzzy Time Series Method to the Forecasting of Air Pollution Data in Ankara, American Journal of Intelligent Systems, Vol. 3 No. 1, 2013, pp. 13-19. doi: 10.5923/j.ajis.20130301.02.
Article Outline
1. Introduction
- Nowadays, it is of vital importance to make predictions about the future in terms of planning and strategy formulation. This can be realized by accurate and realistic analysis of information and data that have emerged from past to present. This analysis can also be termed as time series analysis. Many different approaches have been proposed in literature for the analysis of time series. Each of these approaches has pros and cons. This leads to emergence of alternative methods which may enhance forecasting performance of the method namely fuzzy time series approaches which have a superior forecasting performance and which do not require hypothesis that are found in conventional approaches. On the other hand, due to the uncertainty that they contain, most of the time series encountered in real life should be considered as fuzzy time series.Fuzzy set theory proposed by Zadeh provides a basis for many studies as well as the fuzzy time series approaches[1]. The concept of fuzzy time series was first introduced by Song and Chissom[2]. From that day to this, fuzzy time series have been studied intensively and applied to many field such as information technologies, economy, finance, environment and hydrology. Since fuzzy time series approaches do not require constraints such as model assumption, the number of observations and normal distribution which exist in conventional approaches and they are accordant with the use of flexible calculation methods, these approaches are becoming increasingly popular. Fuzzy time series approaches consist of three main steps as fuzzification, identification of fuzzy relations and defuzzification. In literature, various approaches have been proposed for the improvement of these steps. While some of these studies involve first order fuzzy time series forecasting models (such as[2-6]), others involve high order fuzzy time series forecasting models ([7-11]). Although, there are numerous approaches in literature for the analysis of fuzzy time series involving first and high degree fuzzy relations, few approaches have been proposed for the analysis of fuzzy time series involving seasonal fuzzy relations. However, most of the time series encountered in real life involve seasonal components. The use of seasonal fuzzy time series in the analysis of this type of fuzzy time series would be more realistic and would provide superior forecasting performance.In literature, the first approach for the analysis of seasonal fuzzy time series was introduced by Song but this was not applied to any data[12]. In order to analyze seasonal fuzzy time series, Egrioglu et al. proposed a hybrid fuzzy time series approach based on SARIMA and artificial neural networks[13]. Although, the method proposed by Egrioglu et al. has some advantages, it uses universal set fragmentation in fuzzification step. These subjective judgments have negative impact on forecasting performance of the method. In order to eliminate this problem, Uslu et al. proposed an approach which does not require universal set fragmentation and which uses Fuzzy C-Means (FCM) in fuzzification step[14]. In all of these studies, only the fuzzy set having the highest membership value was considered in the analysis process and other fuzzy sets having lower membership values were ignored. This affects forecasting performance of the approach negatively due to the loss of information as well as posing a situation that is incompatible with the basic features of fuzzy set theory.In this study, we aimed to overcome the above mentioned factors which affect the forecasting performance of the method negatively in the analysis of a seasonal fuzzy time series. For this purpose, we proposed a new seasonal fuzzy time series forecasting model which considers membership values of each observations belonging to all fuzzy sets in both identification of fuzzy relation and defuzzification steps. In the proposed model, we used FCM in fuzzification step and avoided subjective judgments and determined membership values with a systematic approach. We utilized ANN which considers all membership values in identification of fuzzy relation and prevented loss of information and made use of flexible calculation ability of ANN. In defuzzification step, artificial neural network which uses all membership values as input and real (crisp) values of time series as target was used for the first time in literature. The proposed method was applied to the amount of sulfur dioxide in Ankara and was compared with some conventional time series approaches as well as fuzzy time series forecasting methods.In the second chapter, SARIMA models which were used in determining the model order, FCM which was used in fuzzification step and ANN which was used in determination of fuzzy relation and defuzzfication step will be introduced. Third chapter will deal with basic fuzzy time series concept and definitions. In the fourth chapter, proposed method and its algorithm will be given. In the fifth chapter, the proposed method will be applied to a real seasonal time series and obtained results will be presented with the other results obtained from other methods. In the last chapter, obtained results will be evaluated and discussed.
2. Review
2.1. SARIMA
- When a time series with
 mean, than the model is expressed in equation (1)
 | (1) |
 | (2) |
 | (3) |
 | (4) |
 | (5) |
 can be obtained from Box and Jenkins[15].
2.2. The Fuzzy C-Means (FCM) Clustering Technical
- FCM clustering technical method is first introduced by Bezdek[16]. This is a most widely used fuzzy clustering algorithm. FCM partitions sets of
 observation and each fuzzy cluster has a set center
  . The memberships of the observations are described by a fuzzy matrix
  with
with  rows and
  columns in which
  is the number of data objects and
  is the number of clusters.
  , the element in the
  row and jth column in
  , indicates the degree of association or membership function value of the ith object with the jth cluster. The characters of
  are as follows:
 | (6) |
 | (7) |
 | (8) |
 | (9) |
 | (10) |
 is a scalar termed the weighting exponent and controls the fuzziness of the resulting clusters and
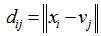
  is the Euclidian distance from object
  to the cluster center
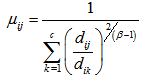
  . In this method, minimizing is done by an iterative algorithm. In each repetition the values of
  and
and  are updated by the formulas given in equation (11) and equation (12).
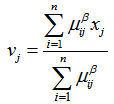 | (11) |
 | (12) |
2.3. Feed Forward Neural Network
- Artificial neural networks (ANN) can be defined as the mathematical algorithm that is inspired by the biological neural networks[17]. Artificial neural networks are much more different than biological ones in terms of their structure and ability[18]. Artificial neural networks compose of a mathematical model[19]. The learning capability of an artificial neuron is achieved by adjusting the weights in accordance to the chosen learning algorithm. The basic architecture consists of three types of neuron layers: input, hidden, and output layers. In feed-forward networks, the signal flow is from input to output units, strictly in a feed-forward direction. Artificial neural network architectures are characterized by the following attributes:Number of Layers: The artificial neurons are arranged in an input layer, one or more hidden layers, and an output layer.Number of Neurons: The artificial neural network has to learn the features of the series for the analysis and forecasting of a fuzzy time series. As the number of neurons in the input and output layers are determined by the training patterns, the number of neurons in the hidden layers can then be chosen arbitrarily (see Fig. 1). More artificial neurons implies more weighting matrices. Thus, from classical fields of application of artificial neural networks (e.g., pattern recognition), the well-known problem of over fitting must be considered.
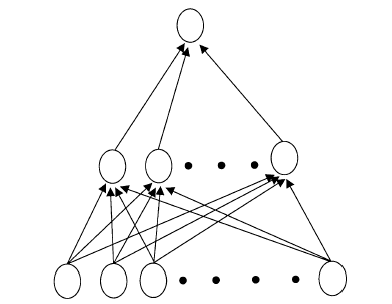 | Figure 1. Architecture of multilayer feed forward neural network |
3. Fuzzy Time Series
- The definition of fuzzy time series was firstly introduced by Song and Chissom[2]. Basic definitions of fuzzy time series not including constraints such as linear model and observation number can be given as follows;Definition 1 Fuzzy time series.Let
 , a subset of real numbers, be the universe of discourse by which fuzzy sets
  are defined. If
  is a collection of
  then
then  is called a fuzzy time series defined on
  .Definition 2 First order seasonal fuzzy time series forecasting model.Let
  be a fuzzy time series. Assume there exists seasonality in
  , first order seasonal fuzzy time series forecasting model:
 | (13) |
 be a fuzzy time series. If
  is caused by
 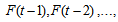 and
and  , then this fuzzy logical relationship is represented by
 | (14) |
 ,
,  and
and  . A bivariate fuzzy logical relationship is defined as
  ,
,  , where
  are referred to as the left hand side and
  as the right hand side of the bivariate fuzzy logical relationship. Therefore, first order bivariate fuzzy time series forecasting model is as follows:
 | (15) |
 is caused by
 , where
 and
and  are integers
 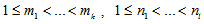 then this FLR is represented by;
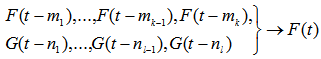 | (16) |
4. Proposed Method
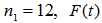
- Although, there are numerous fuzzy time series approaches in literature, the number of approaches aiming at analyzing seasonal fuzzy time series which are frequently encountered in real life and which include seasonal components are limited. The first model proposed by Song involves one variable which belongs to only one period[12]. The approach proposed by Egrioglu et al. determines membership values of each observation belonging to fuzzy sets objectively[13]. Although, Uslu et al. proposed a subjective judgment-free approach, she used set number representing the fuzzy set having the highest membership value of observations in identification of fuzzy relations and defuzzification[14]. This poses a situation which is incompatible with fuzzy set theory as well as affecting the forecasting performance of the method negatively due to the loss of information.In this study, we proposed a new seasonal fuzzy time series forecasting model which does not require subjective judgments in all analysis processes and which uses SARIMA in determination of the model, FCM in fuzzification and ANN in defuzzification steps. The advantages of the proposed model are as follows;• The problem of determining the model order was eliminated by using SARIMA and delayed variables in the model was determined systematically.• Subjective judgments were avoided by using FCM in fuzzification step and membership values which are compatible with the model were determined by a systematic infrastructure.• Again, in the determination of fuzzy relations, the problem related to the number of input of ANN was eliminated by co-clustering of delayed variables data set and was limited by the set number.• Input and target values of ANN which are used in the determination of fuzzy relation are not the set number but the membership values obtained from FCM. Thus, the approach becomes more realistic in exposing fuzzy relations in fuzzy time series.• In order to prevent loss of information, for the first time in literature membership values were used in fuzzification step.The algorithm of the proposed method in this study is given below;AlgorithmStep 1 The model order is defined by SARIMAThe time series concerned is analyzed by Box-Jenkins method after the model order is defined. Then we obtain residuals series
 . As an illustration let us suppose we have defined the model as SARIMA (1,1,0)(0,1,1)12 via Box-Jenkins method. This implies that
  will be a linear combination of the corresponding lagged variables. That is,
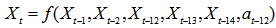 | (17) |
 representing the order of the model and the parameters
  are determined based on the inputs of the SARIMA model. Accordingly
  and
and  are defined as 5 and 1 respectively. Then the model will be
  -order partial bivariate fuzzy time series forecasting model and the fuzzy relationship can be given as follow;
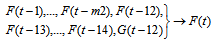 | (18) |

 denotes the fuzzified time series
  and
and  denotes the fuzzified residual series
  .Step 2 Data set of lagged variables is created.Depending on the model order defined in previous step, for each time series which should be included in the model
  , and residual series
  for each lagged variables are lagged less than order of lagged variables and data set is created. In other words, when a model given in equation (18) is considered, lagged variables data set will include
 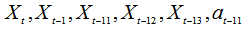 .Step 3 Data set of lagged variables is clustered via FCM.The number of fuzzy set is determined with
  where
where  and
and  is the number of observation. Data set which covers the delays in times series is clustered via FCM clustering method. Thus, fuzzy set centers for each lagged variables constituting data set and membership values showing order of observations belonging to fuzzy sets for each observation are obtained. In this step, fuzzy sets are sorted according to set centers represented with
 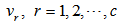 and
and  fuzzy sets are obtained.Step 4 Fuzzy relations are determined via Feed Forward Artificial Neural Networks (ANN).The number of neurons in input and output layer of feed forward artificial neural network used in determining fuzzy relations equals to number of fuzzy set
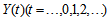
  . The number of neurons in hidden layer is determined by trial and error. Here, the point to take into consideration is that hidden layer unit number should be selected in a way that not losing generalization ability of feed forward artificial neural network. The architecture of feed forward artificial neural network having two hidden layers for a model including seven sets is presented in Figure 2. In Figure 2,
  representsthe membership value of lagged data set belonging to
  fuzzy set at
  time. Moreover, while membership value of observation of lagged data set belonging to
  number fuzzy set at
  time constitutes the inputs of ANN; membership value of observation of lagged data set belonging to
  number fuzzy set at
  time constitutes the outputs of ANN.In all layers of feed forward artificial neural networks which is used in determining fuzzy relation and whose architectural structure is exemplified above, logistic activation function given in (19) equation is used.
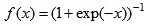 | (19) |
 | Figure 2. Architecture of feed forward artificial neural network for three sets |
 time, membership values of observations belonging to fuzzy sets at
  time depending on
  fuzzy set center which was obtained from FCM method were determined and then these membership values were entered to feed forward artificial neural networks as inputs and thus outputs of feed forward artificial neural networks are created. These outputs represent forecast of observation at
  time. A architecture of feed forward artificial neural network for three sets is given Figure 3.
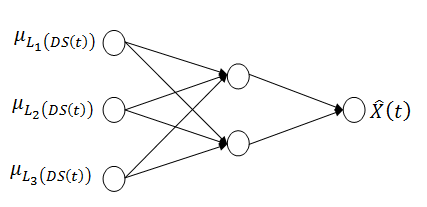 | Figure 3. A architecture of feed forward artificial neural network in defuzzification |
5. Application
- The proposed method was applied to time series of “the amount of sulfur dioxide in Ankara province between March 1994 and April 2006 (ANSO)”. The graph of ANSO time series is presented in Figure 4.In order to evaluate the performance of the proposed method, the last 10 observations were taken as test set and obtained results were compared with some conventional and alternative time series methods. In the application, in order to determine the order of fuzzy time series forecasting model, crisp time series is analyzed using Box-Jenkins method and optimal SARIMA model is determined and residual time series as well as
 time series are obtained. In this step, optimal model for ANSO time series wasSARIMA (1,1,0)(0,1,1)12. As a linear function of
  , this model can be expressed as;
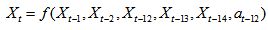 | (20) |
 order partial high order fuzzy time series forecasting model where
  and
and  . This model can be expressed as;
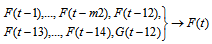 | (21) |
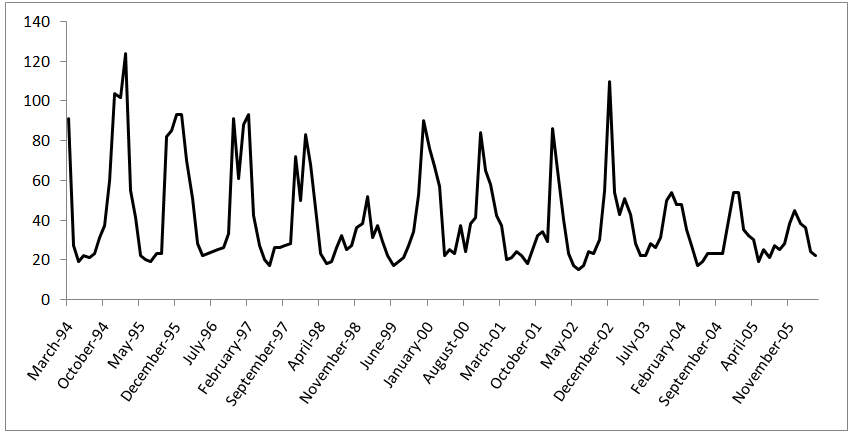 | Figure 4. The time series data of the amount of SO2 in Ankara |
 order partial model is created using
 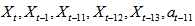 lagged variables. Here, it must be noted that lagged variables data set consists of one step leaded variable in partial high order fuzzy time series forecasting model given in (20). Created data set is clustered via FCM. Clustering is applied to all lagged variable data sets together. In this step, data set is clustered by shifting the number of sets 5 to 15. Membership values of observations belonging to each fuzzy set are also determined via FCM method. The relationship between these membership values, in other words, the number of neurons in hidden layer of feed forward artificial neuron network which is used in determining fuzzy relation were shifted between 1 and 15. In the light of this information,
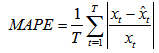
  different analyses were done and Root Mean Squared Error (RMSE) and Mean Absolute Percentage Error (MAPE) were used as performance evaluation criteria.
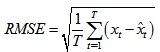 | (22) |
 | (23) |
 , and
, and  ,
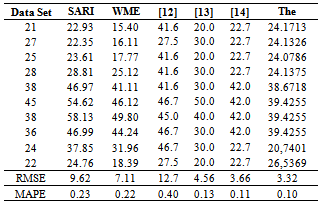
,  represent crisp time series, defuzzified forecasts, and the number of forecasts, respectively. The algorithm of the proposed method is coded in Matlab version 7.9.In consequence of all analyses, the best forecasting performance was obtained in the case in which the number of set is 14, the hidden layer unit number is 6 in the determination of fuzzy relation stage and the hidden layer unit number is 2 in the defuzzification stage. Results obtained from the proposed method and results of some other methods are summarized in Table 1.Table 1 clearly shows the superior performance of the proposed method in comparison with conventional time series approaches as well as seasonal fuzzy time series approaches with respect to three criteria. Additionally, graph of the forecasts obtained from the proposed model with real values are given in Figure 5. When Table 1 and Figure 5 are analyzed together, all the advantages as well as the superior forecasting performance of the proposed method can be seen easily.
|
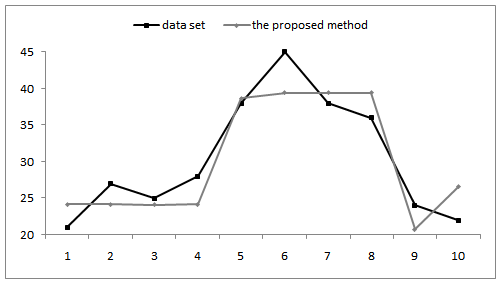 | Figure 5. The graph of the results obtained from the proposed method and real time series |
6. Discussion and Conclusions
- Different approaches have been proposed for the forecasting problemswhich constitute an important role in future planning and strategy formulation. Fuzzy time series forecasting methods have attracted much attention in recent years. Although, numerous first and high order fuzzy time series forecasting models have been proposed in literature, these models are insufficient in the analysis of seasonal time series which are frequently encountered in real life. The approaches proposed in literature have specific outstanding features as well as some insufficiencies. The most significant disadvantage of these models is that they require subjective judgments and ignore membership values representing the degree of observations belonging to fuzzy sets in analysis process. This affects forecasting performance of these approaches negatively as well as posing a situation that is incompatible with the basic features of fuzzy set theory. Seasonal fuzzy time series forecasting method proposed in this study eliminates this problem by considering the membership value in the determination of fuzzy relation and defuzzification stages and presents fuzzy relations more realistically. It is evident that partial high order seasonal fuzzy time series forecasting method which is proposed in this study and in which model order was determined via SARIMA and ANN was used in determining fuzzy relations and defuzzification stages has some advantages and exhibits superior forecasting performance.It should be noted that these results are obtained for the parameter sets given above and ANSO time series examined in the study. For instance, if the length of test set is shifted, the results can change or similarly if these parameter sets are used for other time series, the obtained results can change. Therefore, the obtained results are valid for only these parameter sets and this time series. In order to reach general results, a comprehensive simulation study has to be made. However, it is very hard to perform such a simulation study since there are many types of time series and many parameter combinations.