Kristína Machová , Tomáš Rakuščinec
Department of Cybernetics and Artificial Intelligence, Technical University, Košice, 04200, Slovakia
Correspondence to: Kristína Machová , Department of Cybernetics and Artificial Intelligence, Technical University, Košice, 04200, Slovakia.
| Email: |  |
Copyright © 2012 Scientific & Academic Publishing. All Rights Reserved.
Abstract
This document deals with social networks, their types, analysis of their behaviour and properties. The main focus is on dynamic analysis of social networks taking several points of views. First, it is the analysis of frequency of network usage in various day hours. Second, it is the analysis of changes (growing, reduction or restructuring) with the aid of network visualization. At the end, it is analysis of selected structural characteristics: the distribution of the average nodes degrees for the purpose of authoritative user searching and clustering coefficient for the purpose of user’s relations monitoring. The paper describes the results of the dynamic analysis of the data, which were collected from social network Internet Relay Chat (IRC) and private discussion channel Kyberia (www.kyberia.sk).
Keywords:
Social Networks, Web Mapping, Dynamic Analysis, Social Network Visualization
Cite this paper:
Kristína Machová , Tomáš Rakuščinec , "Dynamic Analysis of Social Networks", American Journal of Intelligent Systems, Vol. 2 No. 6, 2012, pp. 148-156. doi: 10.5923/j.ajis.20120206.02.
1. Introduction
The social web can be considered as an upgrade of the classic web. The classic web can be illustrated with an idea of a word-wide billboard – anybody can publish some information piece or make it accessible for public inspection on the billboard (anybody who has necessary skills in web page creation – but considerably greater amount of web users have abilities only for reading published information). On the other hand, the social web or web 2.0 reinforces social interactions among users and provides an opportunity for great majority of web users to contribute to web content. It can be said, that it increases the number of web content providers. Social interactions among users are enabled by communication within social networks, by the possibility to contribute to web discussions, and so on. Our work focuses on social networking.The concept “social network” is frequently used and it represents one important form of social on-line life of many people. Modern social networks help users to maintain connections and contacts to other users without dependency on a geographical locality. The social network cannot be mapped in its entirety. Mapping of some of well known social network (for example Facebook) is a difficult task, when we want to visualize it in a way, which guarantees a readability of the visualization. So, our work concentrates particularly on small networks and so as on network dynamics visualization.
2. Social Networks
A Social network is a set of entities (nodes, actors), which are connected. This connection can be represented by one or more types of relationships. According[6] social network is heterogenic and multi-relational data set represented by graph. Nodes and edges of this graph have attributes. Objects (nodes) can be classified into defined categories. The relations can be oriented and need not to be only binary. Social networks can be considered not only in social, but also in technological, economic or biologic context. Examples of such networks can be electrical distribution networks, telecommunication networks, (computers) viruses spreading, collaborative networks (co-authors), citing networks, web networks and so on. According[13] the main concepts in social networks analysis are: actor, relation, dyad, triad, subgroup, group and network. An actor is social entity in a network. The aim of social network analysis is to make sense of relations between these entities and to analyses consequences of these relations. Actor can be discrete individual, organization or simply group of social entities. The actors represent basic units of social network in the process of its analysis. Individual actors are connected each other by social ties. Such social tie can be: friendship, respect, preference, association, affiliation, interaction and so on. Collection of social ties between actors (entities) is titled relation. The relation Rv⊆{(A x A) x R} between actors of the same type is binary relation, where A is the set of actors, R is the set of relations and vx is intensity of relation. The tie between two actors is called dyad. A triad arises by extension of the dyad by one more actor. A subgroup is extension of the triad. The subgroups play important role in the social networks dynamic analysis. The network dynamics represents moving of actors within the social network that is formation and expiration of subgroups. A group is such set of actors, which belong to common and finite set and which are connected with measurable ties. So network N can be defined as pair of the set of actors S and the set of all relations R over the set of actors: N=(A, R); A={A1,…,AX}; R={R1,…,RY}.
2.1. Social Networks Types
The social networks can be divided into types according various points of view. For example according number and type of edges (directed, undirected networks, networks with cycles and networks with multi-edges), according way of edges evaluation (weighted, un-weighted, marked and temporal networks), according number of actor types (monoecious networks – contain only one type of actors, dioecious networks – contain more types of actors) and according number of relation types (one-relation networks, multi-relation networks). During real networks modelling various network types can be distinguished: small-word phenomenon networks, scale-free networks, social cycle networks, random and lattice networks. Real networks are networks, which rise in process of self-organization. This self-organization process can optimize: conservation of a network local structure, conservation of a good communication between network nodes and good resistance against random errors. An example of the real network is Internet or network of professional contacts or telecommunication networks. The great majority of nodes of the small-word phenomenon networks[7] are not connected to other nodes directly, but they are achieved from other nodes via small number of edges. The small-word networks have concise shortest paths, high clustering coefficient and small node separation (mentioned structural characteristics will be described in the next section). Interesting property of these networks is tendency to contain cliques and n-cliques (because of high clustering coefficient) and many nodes with high degree (see next section). Great number of nodes with high degree can lead to high distribution. The scale free networks distribution of a degree is minimally depended on Power Law. More details can be found in[1]. The random and lattice networks have clustering coefficient close to zero. It creates node separation, which is grown slowly with node number growing[11]. The social cycle network model represents networks with feedback[4]. Active nodes (actors) of the feedback network communicate through this network to coordinate the process of joining of new actors and to create new relations. For realization of this process, three parameters are needed: level of actor activity, distance shorting (how soon the actor fails in the effort to find suitable partner for new relation) and range of searching within the network.
2.2. Structural Characteristic of Networks
Some properties of some social networks can be researched with the aid of its structural characteristics. The most important and useful characteristics are: node degree, shortest paths and clustering coefficient[3]. Node degree k represents total number of its connections. In the literature, this characteristic is usually called “connectivity”. Connectivity has different meaning in graph theory. The node degree consist of “in-degree” and “out-degree” k=ki+ko. The in-degree is the number of incoming edges of a node and out-degree is the number of outgoing edges. It holds: | (1) |
where: P(k) is the degree distribution and P(ki,k0) is the joint in-degree and out-degree distribution. The in-degree distribution Pi(ki) and the out-degree distribution P0(k0) (more obvious are notations P(ki) and P(k0)) can be stated according formula (2): | (2) |
If given network has no connections to exterior space, then the average in-degree is equal to the average out-degree (see formula (3)). | (3) |
The node degree is a local characteristic, but we shall see that a degree distribution can determine some important global characteristics of random networks. The average node degree within the whole network represents network connectivity.Shortest path is defined as geodetic distance of two nodes u and v. This distance represents the shortest path from all possible paths between these two nodes luv. The shortest path luv need not be the same as lvu. The average shortest path between all node pairs within the entire network is often called the diameter of a network. It is related to an average separation of pairs of nodes. This node separation represents one another globalproperty of a network – closeness of nodes. Node separation l is averaging shortest distance dmin(a,b) of the nodes a and b. | (4) |
Let us consider a network with undirected edges. Then the number of all possible connection between the nearest neighbours ki of a node u is:Let only Ei are present. Then clustering coefficient of the node u can be counted according formula (6). | (6) |
Averaging clustering coefficient over all nodes of a network is network clustering coefficient C. | (7) |
This clustering coefficient represents probability that two nearest neighbours of a node are also nearest neighbours of one another node.Other parameters using on social networks analysis are node numbers, edges number, nodes (edges) number in the larger weakly (strongly) connected component in the network, number of triangles and effective average of 90 percentile, which is 90 percentile of the distribution of all shortest paths lengths.
2.3. Network Data and their Representation
Social networks are sources of structural, composition and temporal data. The structural data are obtained from connections between actors (for example friendships between people, business transactions between firms and so on). The structural data can be represented by quadratic binary matrix (1 represent connection and 0 represent absence of connection). The composition data introduce attributes of network actors, which can be direct (for example interests, age, nation, country and so on) and can be indirectly obtained in the process of network analysis by counting (for example node degree, node centrality and so on). These data are static and they can be represented by orthogonal matrix. Sometimes we are interested in dynamics of these data, which can be research in the process of dynamic analysis of social networks. This dynamic analysis uses temporal data, which describe dynamic properties of social network. The temporal data represent some time change and the time evidence.
3. Dynamic Analysis of Social Networks
The dynamic analysis is focused on time changes in a researched social network. So, the time dimension must be added into static data. Within dynamic analysis, we monitor the network development to some direction. The dynamic analysis uses visualization methods, structural characteristics determination, machine learning methods, multi-agents modelling and their combination. The main problems of the dynamic analysis according[13] are:• searching suitable metric for dynamic analysis• prediction of changes in social networks• developing of algorithms for social networks monitoring• dynamic visualization of social networks• research of social networks and their characteristics in time.Our work is focused on the last two problems. The static and dynamic analysis searches for suitable metrics on network description. These metrics can be used for solving very actual problem of searching and identification of authoritative actors in social network or in some group of the given networks.In general, dynamic changes represent creation and destruction of nodes. In real networks, the destruction of node is often inappreciable. Such network is called growing network[2]. The network growing can be realized by random adding of actors and by preferential adding of actors. The random adding of actor is process starting from one actor. One another actor is adding to an existing actor by creating one connection to it in each time unit. So, the actors can be marked by the time of their coming into a network. In the time t, the network has exactly t actors. So the average node degree of the node, which came to network at the time s and we monitor it at the time t+1 is: | (8) |
This equitation can be solved and the result of its solving is formula (9). | (9) |
The preferential adding of actors similarly starts from one actor. In each time unit, some new actor is connected to existing actors by creating one or more connections to old existing actors of the network. New actor selects such old actor for connection, which has the highest node degree (the highest number of existing connections). Each existing connection contributes to node degree increasing of two actors. Average node degree of the node, which came to network at the time s and we monitor it at the time t is: | (10) |
The distribution function of node degrees is: | (11) |
The network with this distribution function has actors with low number of connection so as actors with high number of connections to other actors. Such network is called scale-free network[1] and is described by Barabasi-Albert model.
3.1. Dynamics of Discussion Channel
During dynamic analysis of network, our attention was focused on social network IRC (Internet Relay Chat), which was created on the basis of interactions between users of discussion channel located on web. The advantage of this selection is, that users of this discussion channel continuously communicate between each other long time, because of themes of their communication is always actual for them. These themes are related also to technical problem solving, to technical news discussion or to common communication. The IRC social network is created continuously in the process of communication between users per running time. So it is naturally dynamic system suitable for dynamics analysis. The dynamics of this system is created by emergency. The dynamics of discussion channel is not created purposelessly by user but it is related to actual load of this channel according to real need to solve some problems, which have arisen. 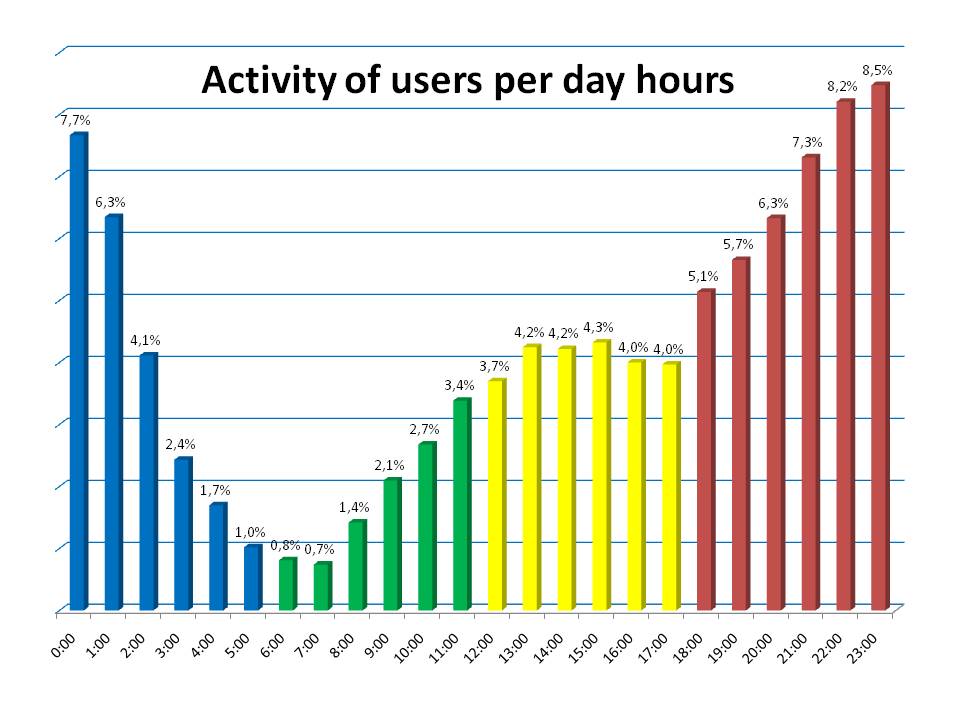 | Figure 1. Average percentage of discussion channel IRC loading. Each column represents one hour of the day. Data were collected during 211 days |
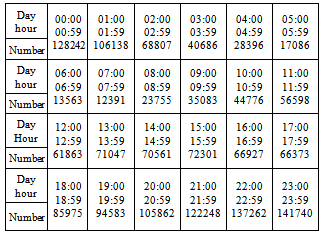
Our tests were from the beginning concentrated on percentage of load of researched discussion channel during particular phases. Each phase is represented by one hour of a day. “Figure 1” illustrates percentage of average loading of discussion channel in particular hours of the day from 00:00 to 24:00.The Figure 1 shows, that the highest activity on discussion channel IRC was noticed at night hours and at early evening hours. Table 1 introduces exact number of spotted iterations. The iterations represent communication activities between users per certain day hour. These data were collected during 211 days. Table 1. Number of users communications in certain time period – one hour of the day
 |
| |
|
The whole number of users’ communications within all 211 days was 1672263 iterations. Activities on this discussion channel were observed with the aid of autonomous robot Eggdrop[5]. The robot fulfils a role of manager of users. It provides some added functionalities for operators, moderators and functionalities for safety measures.
3.2. Visualisation of Social Network
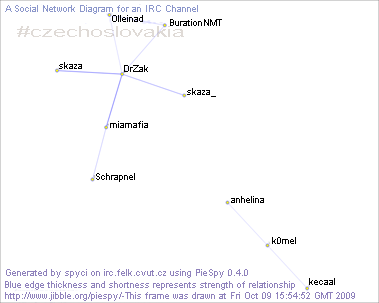
We have tried to visualize the IRC social network in graphical way. The graphical visualization of social network represents view on actually running discussion. Each finished discussion is removing from the graph and each new discussion is added to graph by new nodes and edges adding. Running discussions are depicted by darkening flow - line.Dynamic view on the social network has high computing complexity and growing time increases its demands on space complexity. One possible solving of this problem is such animation creation, which reflects only changes in time. The graph visualization is modified only in discrete times, when some change was noticed. In this way, we transformed the mentioned animation“czechoslovakia.wmv” into series of 8497 graph visualizations. The figures from Figure 2 to Figure 5 were selected from this series.The dynamics of social network or its evolution can be divided into two phases: initializing phase and phase of monitoring. The initializing phase starts the social network diagram building. The first interaction between two first actors is denoted into diagram, as can be seen in the Figure 2. At the beginning of the social network diagram building, the greatest changes in social network structure are denoted.The phase of social network monitoring is characteristic with oscillation around stabilized graph. The oscillations depend on setting value of parameter, which controls the time, non-active nodes are removed from graph after its expiration.Too low value of this parameter enables to social network monitoring nearly on-line, because the process of network developing is accelerated. In this case, a node is removed strictly, after very short period of inactivity. On the other hand, too high value of this parameter causes, that a node is removed after very long period of inactivity.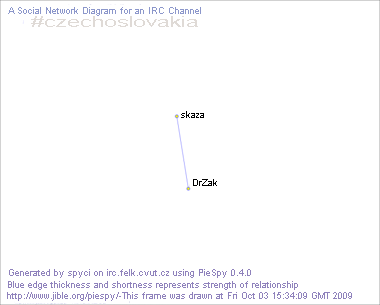 | Figure 2. The first iteration of the visualization process (initializing set of social network diagram with two entities from October 09, 2009) |
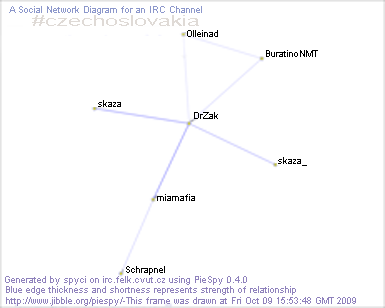 | Figure 3. The 42nd iteration of the visualization process (the social network diagram is growing up - October 09, 2009) |
 | Figure 4. The 44rd iteration of the visualization process (the social network diagram is disintegrated into two isolated parts - October 09, 2009) |
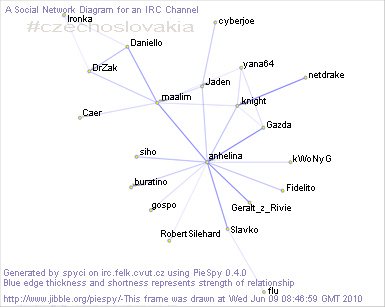 | Figure 5. The 1778rd iteration of the visualization process (the social network diagram is more complicated - Jun 09, 2010) |
Extremely high value of the parameter can cause that no node is removed from graph and such graphical visualization provide to us the global view on all interactions between users from the first interaction to the actual – last one. But such complex visualization gradually loses its information value and readability, what is illustrated in the Figure 6.The graphical visualization of a social network and also its dynamic analysis based on graphical visualization can be too complex and complicated. It was reason for our focusing on analysis of social network properties. 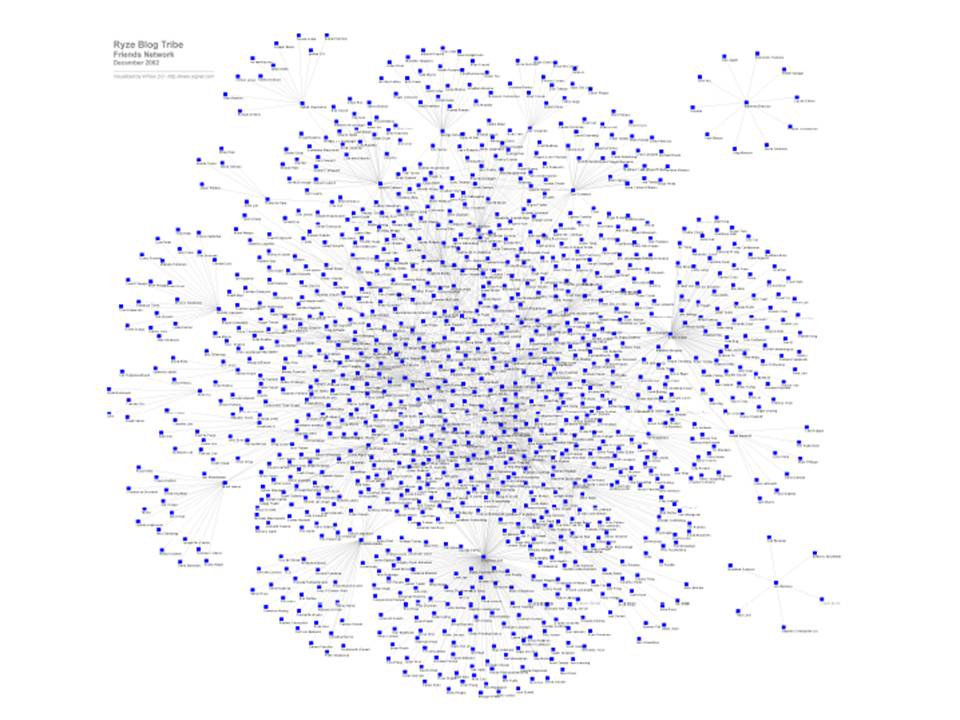 | Figure 6. Too massive visualization of social network (passed from Ryze Business Networking) |
3.3. Dynamic Properties of Social Network
Some structural characteristics of network were introduced within the section 2.2. These static properties can be studied in their dynamics.
3.3.1. Distribution of the Average Node Degree
We concentrated our attention on one of them - the node degree k, which is based parameter of the investigated point (node, entity, user or actor). The node degree k represents a number of all the nearest neighbours of the given node (see section 2.2). 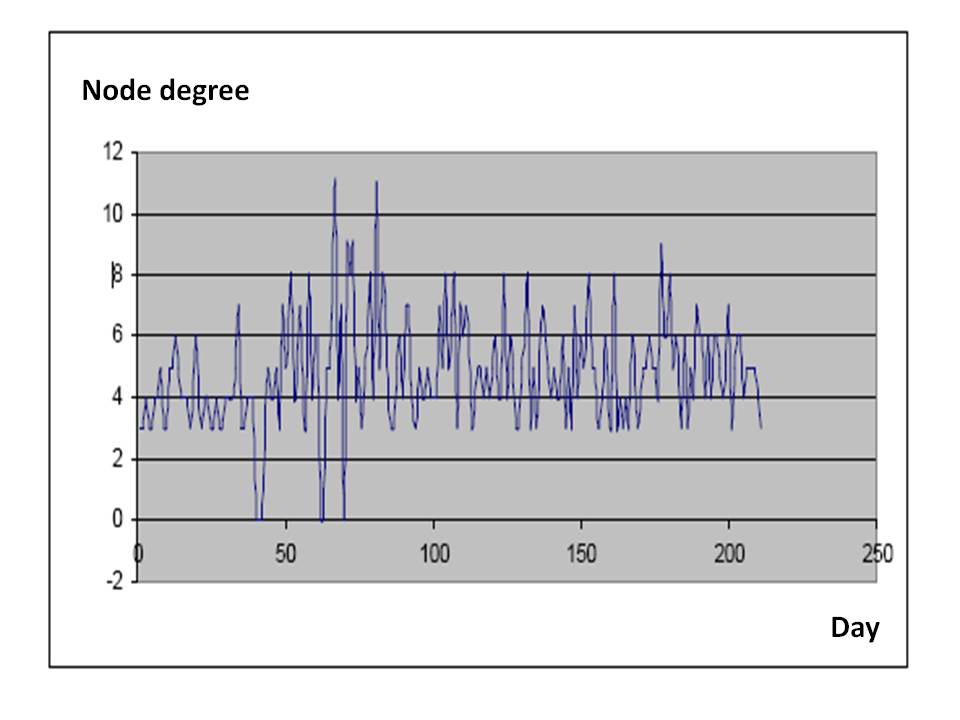 | Figure 7. The distribution of the average node degree of the social network in dependency on time |
Our experiments are related to closed social network – discussion channel IRC. All nodes communicate only to other nodes of the same network. The average in-degree of some node is equal to the average out-degree of the same node (see formula (3)), because investigated network is discussion channel, which works on a bases “question – answer”. A set of users, which did not get an answer is small and can be neglected. We tried to research average user – discussant and came to average distribution of the node degree depending on time. This node degree distribution is illustrated in the Figure 7. It can be seen in the Figure 7 that average node degree oscillates between values 2 and 8. It is relatively common value, which represents communicative abilities of one user (actor, discussant). This value depends also on discussion channel load and an average number of active users - discussants during the day.
3.3.2. Clustering Coefficient
Some experiments were performed using the private discussion channel Kyberia (www.kyberia.sk). Three types of data were considered: who is an initiator of a given friendship, who was added as a friend and time of every action. The whole data base of this social network can be characterized by the following properties:Number of nodes: 5852Number of edges: 150392Time interval: 25.2.2004 – 16.3.2009Average network degree: 51, 3984 It is clear, that visualization of the network with 5852 nodes is difficult and it cannot to serve to valuable dynamic visualization what is illustrated in Figure 8. Thus, the part of this network in the time interval of 30 days was selected. This selection has the following properties:Number of nodes: 233Number of edges: 291Time interval: 25.2.2004 – 27.3.2004Average network degree: 5, 78623 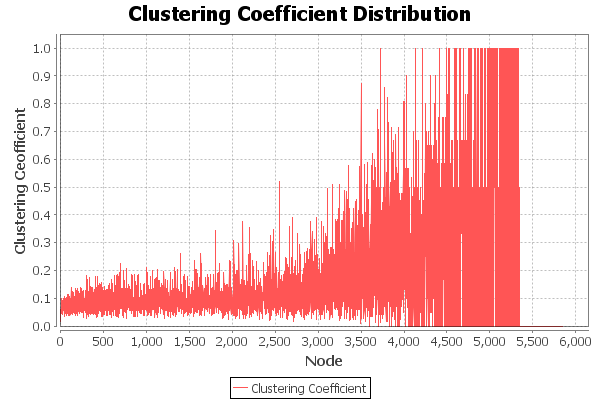 | Figure 8. The clustering coefficient for the whole Kyberia social network, collected within the time interval: 25.2.2004 – 16.3.2009 |
Figure 8 and Figure 9 illustrate the difference in the development of the clustering coefficient in the whole social network and in one-month selection.So, decomposition of the whole network on a given number of smaller parts – time partitions – can give us statistically more transparent data.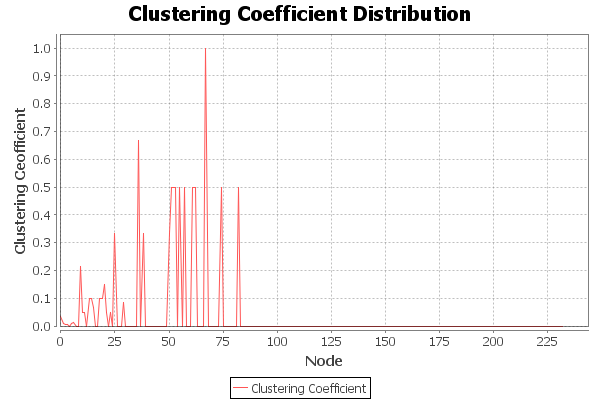 | Figure 9. The clustering coefficient for one-month selection of the Kyberia social network, collected within the time interval: 25.2.2004 – 27.3.2004 |
4. Conclusions
A social network usually represents connections between various entities in two or three dimensions. Adding another dimension – time – enables us to investigate the network dynamics. Insertion of dynamics into the social network visualization process gives us a new point of view applicable on this problem.The purpose of this work was a research of dynamics of the IRC social network and Kyberia social network. We have analysed data from IRC, which were collected by PieSpy[12]. The whole number of collected screens was 181310. It takes 5 GB of disc space. The social network was monitored during enough long time (since October 9, 2009 to December 05, 2010) to trace permutations in the social network organization. Clusters creation, central nodes creation and small isolated islands of small number of nodes were denoted. Dynamic processes in this social network originate from emergency. It means that network users do not communicate with other users only for purpose of social network building or for purpose of connections gaining, but also because of technical problem solving. This social network is a result of independent communication on public level. Like in any common society also in this social network the central nodes are more interesting. The central nodes – hubs – are typical with high number of connections to other nodes - entities. These central nodes represent very active actors, which spend more time on the discussion channel or authoritative users, which are the most orientated in problem domains. The identification of just authoritative actors is attractive problem for us for future research.We have analysed also data from the Kyberia social network, which were collected within the time interval: 25.2.2004 – 16.3.2009. This analysis was focused on the evolution of clustering coefficient. The dynamics in social networks illustrates processes created by people. Within the given network, friendships are created and also deleted. Increasing number of users leads to network growing and to speeding up of the network dynamics. Studying of the network dynamics can discover developing of local trends, network popularity developing and user reactions on many impulses. It can be also very interesting to compare a speed of creation of some clusters, which develop in the surrounding of the central nodes (authoritative users). Mapping of a social network dynamics has multifunction usage and so there are many forms of application of data mining of such type.Another promising research field is discussion analysis[9]. This problem is related to discussion channels too, but it concentrates on opinion analysis not dynamics analysis. This opinion analysis can be semantically enhanced, what can create hybrid access to semantic and social web re-approach[10]. This access represents the social web mining from content. Interesting can be also social web mining from a structure, which is introduced in[8] with focusing on social network of authors and tracking influential concepts spreading down this network.
ACKNOWLEDGEMENTS
This work was supported by the Slovak Grant Agency of Ministry of Education and Academy of Science of the Slovak Republic within the project 1/1147/12 “Methods for analysis of collaborative processes mediated by information systems”.
References
| [1] | Barabasi, A.L. Scale-free Network. Scientific American, 288, 2003, p. 60-69. |
| [2] | Barabasi, A.L., Albert, R. Emergence of scaling in random networks. Science 286, 1999, p. 509-512. |
| [3] | Dorogovtsev, S.N., Mendes, J.F.F. Evolution of Networks. Departamento de Fisica and Centro de Fisica do Porto, Faculdade de Ciencias, Universidade do Porto, Portugal, 2001. |
| [4] | Douglas, R. et al. Generative Model for Feedback Networks. In Physical Review E, 2006. |
| [5] | EGGDROP The word’s most popular open source Internet Relay chat bot.[cit. 2012-07-23]. Available at: http://www.omgirc.com/index.php?itemid=26. |
| [6] | Hann, W. P. Hyperlink Network Analysis: A New Method for the Study of Social Structure on the Web Royal Netherlands Academy of Arts & Sciences, Amsterdam, The Netherland, CONNECTIONS, 2003, Vol. 25, No 1, p. 49-61. |
| [7] | Kleinberg, J. The Small-Word Phenomenon: An Algorithmic Perspective. Proc. of the 32nd ACM Symposium on Theory of Computing, Portland, Oregon, US, 2000, p. 163-170. |
| [8] | Lukáč, G. A Proposal for an Approach to Extracting Conceptual Description of Hyper-linked Text Documents, Int. J. on Social Media MMM: Monitoring, Measurement and Mining, 2010, Vol. 1, No 1, p. 98-101. (ISSN 1804-5251) |
| [9] | Lukáč, G., Butka, P., Mach, M. Semantically-enhanced extension of the discussion analysis algorithm in SAKE. Proc. of the SAMI 2008, Budapest Tech., Budapest, 2008, p. 241-246. (ISBN 9781424421060) |
| [10] | Mach, M., Macej, P., Hreno, J.: Ontology-based Communication Forum. Proc. of the First Int. Semantic Web Conference ISWC2002, University of Cagliary, Cagliary, Italy, 2002, 39-39. |
| [11] | Markošová M. Networks Dynamics. In: Kvasnička et al. (ed.) Artificial Intelligence and Cognitive Sciences II. Bratislava (SK): STU, 2010, p. 321-377. |
| [12] | PieSpy PieSpy Social Network Bot.[cit. 2012-07-23]. Available at: http://www.jibble.org/piespy/. |
| [13] | Repka M. Analysis of selected types of social networks: Technical University in Košice, 2011. 75 pp. |
 Abstract
 Reference
 Full-Text PDF
 Full-Text HTML