-
Paper Information
- Next Paper
- Paper Submission
-
Journal Information
- About This Journal
- Editorial Board
- Current Issue
- Archive
- Author Guidelines
- Contact Us
American Journal of Intelligent Systems
p-ISSN: 2165-8978 e-ISSN: 2165-8994
2012; 2(6): 141-147
doi: 10.5923/j.ajis.20120206.01
Contrast Enhancement of Sports Images Using Two Comparative Approaches
 Abstract
 Reference
 Full-Text PDF
 Full-Text HTML
P. Kannan 1, S. Deepa 1, R. Ramakrishnan 2
1Department of Electronics and Communication Engineering, Panimalar Engineering College, Chennai, India
2Department of Sports Technology, Tamilnadu Physical Education and Sports University, Chennai, India
Correspondence to: S. Deepa , Department of Electronics and Communication Engineering, Panimalar Engineering College, Chennai, India.
| Email: |  |
Copyright © 2012 Scientific & Academic Publishing. All Rights Reserved.
In this paper we have proposed two comparative approaches for the contrast enhancement of dark sports images. The contrast of any image is a very important characteristic which decides the quality of image. Low contrast images occur often due to poor or non uniform lighting conditions and sometimes due to the non linearity or small dynamic range of the imaging system. Enhancing the contrast of sports images is of importance since it is difficult to analyze the performance of the team or player with a poor quality image. Though several methods are proposed for gray scale images, enhancing the contrast of color images is a complicated process. In this paper we have proposed two comparative approaches for the contrast enhancement of color images and have compared their performance against the standard histogram equalization method. First method is contrast enhancement of color images using fuzzy rule based method and the second method is using modified sigmoid function. Color images cannot be processed directly hence a suitable color model is chosen for processing and the proposed methods are implemented. For both the approaches the color images are split into RGB planes and the proposed operation is performed on each plane and finally the planes are concatenated to obtain the enhanced image. Performance of the proposed methods is measured using a factor known as Measure of Contrast and the comparison is represented graphically. Experimental results prove that of the two methods proposed, contrast enhancement using modified sigmoid function provides the highest measure of contrast and can be effectively used for further analysis of sports color images.
Keywords: Digital Image, Sigmoid Function, Fuzzy Logic, Contrast Enhancement, Rescaling, Measure of Contrast
Cite this paper: P. Kannan , S. Deepa , R. Ramakrishnan , "Contrast Enhancement of Sports Images Using Two Comparative Approaches", American Journal of Intelligent Systems, Vol. 2 No. 6, 2012, pp. 141-147. doi: 10.5923/j.ajis.20120206.01.
Article Outline
1. Introduction
- Sports video and image processing is an interesting topic for research since many specialized applications are emerging in this field. The various applications include event and highlight detection, structure analysis, object detection and segmentation, ball and player tracking, tactics and performance analysis etcetera[1]. Sports image processing is hence an attracting area of research and can contribute to the coaches, players and even the consumers with additional statistical information. Quality of such digital sports images greatly depends on their contrast. Contrast is defined as the difference in intensity between the highest and lowest intensity levels in an image. Images with high contrast are of good quality and images with low contrast are of poor quality. Images captured in poor or non uniform lighting and captured with a sensor of small dynamic range results in low contrast images. The quality of such images can be improved using a proper image enhancement technique. Thus the main goal of an image enhancement technique is to improve the image quality so that the processed image is better than the original image for a specific application or set of objectives. The various image enhancement techniques include gray level manipulation, contrast stretching, noise reduction, edge crispening and sharpening, filtering, interpolation and magnification. For most of the applications involving digital images the first step would be to enhance the raw image available and for our application we have chosen to enhance the contrast of the image. Enhancing contrast of images enjoys much attention and spans a wide gamut of applications, ranging from improving visual quality of photographs acquired with poor illumination[2] to medical imaging[3]. Contrast enhancement algorithms can be classified into two types point operations, which are global, and spatial neighbourhood techniques, which are local. Common techniques for global contrast enhancements like global stretching and histogram equalization[10],[11],[12] do not always produce good results, especially for images with large spatial variation in contrast. Histogram equalization is a technique that generates a gray map which changes the histogram of an image and redistributes its pixels values to obtain a broad uniform histogram. Histogram Equalisation tends to introduce annoying artefacts and over enhancement. To overcome this, several brightness preserving histogram modification approaches, such as bi-histogram equalization, multi-histogramequalization, Contrast Limited Adaptive Histogram Equalization (CLAHE) and histogram specification are proposed in literature[15-19]. Histogram specification is a technique that generates a gray map which changes the histogram of an image and redistributes its pixels to be as close as possible to a user-specified desired histogram[4],[5],[6]. Contrast stretching (often called normalization) is a simple image enhancement technique that attempts to improve the contrast in an image by `stretching' the range of intensity values it contains to span a desired range of values, e.g. the full range of pixel values that the image type concerned allows[21]. It differs from the more sophisticated histogram equalization in that it can only apply a linear scaling function to the image pixel values. As a result the enhancement is less harsh. Adaptive contrast and edge enhancement techniques are other common contrast enhancement methods discussed in literature[7],[8],[9]. Contrast enhancement technique for dark images using sigmoid function is proposed in[14] and application of a modified sigmoid function for contrast enhancement of sports images is discussed in[20]. Histogram Equalization is the golden standard for enhancing the contrast of the images hence in section 2 we have discussed about histogram equalization, the algorithm to perform histogram equalization and the results obtained using histogram equalization. Histogram equalisation, though it provides very good enhancement it fails in preserving the brightness of the image. All other conventional techniques discussed above do not provide enhancement to the level of histogram equalisation. Thus in this paper we have proposed two comparative approaches that are capable of enhancing the low contrast sports image and at the same time preserve the brightness. It is possible to make the dark colors in an image look darker by making the light colors lighter. This is accomplished using two different approaches: Fuzzy Rule and Modified Sigmoid Function. Section 3 discusses contrast enhancement of color sports images using Fuzzy Rule and the results, Section 4 discusses modified sigmoid function and the results, In section 5 we have presented the discussion and the comparison table and in section 6 we have presented the conclusions.
2. Histogram Equalization
- Histogram equalization (HE) is a commonly used global contrast enhancement technique for both color and grayscale images. The histogram of an image is a plot of the number of occurrences of gray levels in the image against the gray level values. Thus the histogram of a digital image with gray levels in the range[0 ,L-1] is a discrete function h(rk)=nk where rk is the kth gray level and nk is the number of pixels in the image having gray level rk. For a dark image, the components of the histogram are concentrated on the low side of the gray scale. Similarly, the components of the histogram of a bright image are biased toward the high side of the gray scale. An image with low contrast has a histogram that is narrow and centered toward the middle of the gray scale. A low contrast image has a dull, washed out look. Whereas for a high contrast image the components of the histogram cover a broad range of the gray scale and the distribution is approximately uniform. Thus an image whose components of the histogram cover a wide range of the gray scale that is a high contrast image will exhibit a large variety of gray tones. Transforming a low contrast image to high contrast image will result in the enhancement of the image and shows a great deal of gray level details. This process of transforming a low contrast image to high contrast image by distributing the components of the histogram to cover a wide range of gray scale with approximately uniform distribution is called histogram equalization. Histogram Equalization spreads out and flattens the histogram of the number of image pixels at each gray level value, thus stretching the intensity values in the image over more of the available dynamic range of gray-levels and increasing the apparent contrast in the image.Histogram Equalisation is given by,
 | (1) |
2.1. Algorithm
- Histogram equalization of color image is performed as described below.Step 1. Convert the RGB image into YIQ color format.Step 2. Find the running sum of the histogram values of the Y component.Step 3. Normalize the values obtained from step 2 by dividing with the total number of pixels.Step 4. Multiply the values in step 3 by the maximum gray level value and round.Step 5. Map the gray level values to the results from step 4 using a one to one correspondence to get the equalized Y component.Step 6. Equalized Y component and the unaltered I and Q components are converted back to the RGB format to obtain the enhanced image.
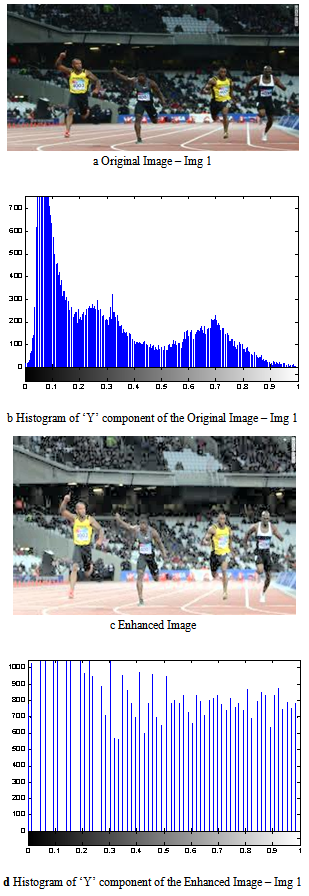 | Figure 1. Contrast Enhancement using Histogram Equalization |
3. Contrast Enhancement Using Fuzzy Rule
- Fuzzy logic has rapidly become one of the most successful technologies for developing sophisticated control systems. The foundation of fuzzy set theory was first established in 1965 by Lotfi Zadeh. The theory of fuzzy sets is a theory of graded concepts, a theory in which everything is a matter of degree[22]. Unlike two-valued Boolean logic, fuzzy logic is based on degrees of membership and degrees of truth. Fuzzy logic not only recognizes true and false values but is also useful for propositions that can be represented with varying degrees of truth and falseness. Thus Fuzzy logic has filled an important gap in engineering design methods left vacant by purely mathematical approaches (e.g. linear control design) and purely logic-based approaches (e.g. expert systems) in system design. A simple fuzzy system can be explained as follows, 1. First the various inputs of the process is analyzed and the anticipated range of each of the inputs is divided into several coarse, overlapping functions known as ‘Membership Functions’ or ‘Classes’ or ‘Fuzzy Sets’. 2. Similarly a set of ‘Output Membership Functions’ is defined covering the range of each output. 3. Every possible combination of input membership classes is related to an output class via a set of logic sentences. Fuzzy Rules take the general form of IF and THEN statement. The process of generating this rule base is called ‘Implication’. 4. An appropriate method for establishing the degree of truth of an output membership function based on the relative degree of truth of each of the input functions mapped to it by the fuzzy rules is decided. This is called the ‘Conjunction Method’. 5. An appropriate method is further decided for mapping output membership functions, each with a certain degree of truth, back to the input variables. This process is called ‘Defuzzification’. To enhance the contrast of sports image using fuzzy logic, Takagi-Sugeno fuzzy rule based system is used. Takagi-Sugeno rules have consequents (THEN outcomes) that are numeric functions (generally linear combinations) of the input values.
3.1. Algorithm
- The algorithm used to enhance the contrast of color image isStep 1. Extract the Red, Green and Blue planes of the color imageStep 2. For each plane execute the following steps●IF a pixel is dark, THEN make it darker ●IF a pixel is gray, THEN make it mid-gray ●IF a pixel is bright, THEN make it brighterStep 3. Concatenate the enhanced Red, Green and Blue planes to obtain the contrast enhanced image.The input membership functions for an image contrast enhancement system are shown below in Figure 2. Here, the set of all possible input image pixel values is mapped to three linguistic terms: Dark, Gray and Bright. The values μi(z) quantify the “degree of membership” of a particular input pixel intensity value to the each of the three member functions (Dark, Gray or Bright; denoted by the subscript i). Thus, μdark(z) assigns a value between 0 and 1 to how truly “dark” a given input pixel intensity value (z) is Similarly, μgray(z) and μbright(z) characterize how truly Gray or Bright a pixel value z is. The Dark and Bright input membership functions have been implemented by using sigmoid functions, whereas the Gray input membership function has been implemented by a Gaussian function.
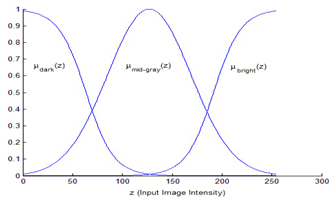 | Figure 2. Input Membership Function for Fuzzy Rule Based Contrast Enhancement |
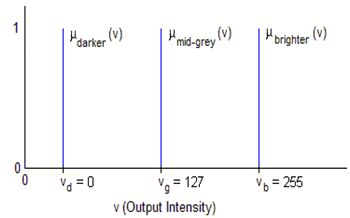 | Figure 3. Output Membership Function for Fuzzy Rule Based Contrast Enhancement |
 to any input
  is given by,
 | (2) |
 refers to the input membership function
  refers to the output membership function This relationship accomplishes the processes of implication, aggregation and defuzzification together with a straightforward numeric computation. Using a Takagi-Sugeno design with singleton output membership functions reduces computational time significantly by simplifying the computational time requirements in implication, aggregation and defuzzification. Figure 4a) shows the original image Img-2 and 4b) shows the enhanced image obtained using fuzzy rule based contrast enhancement.
 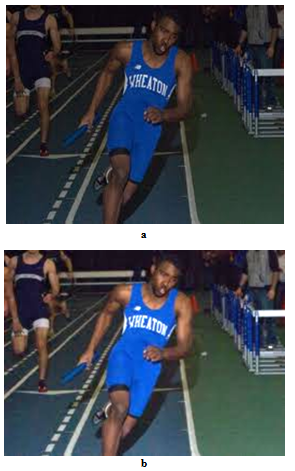 | Figure 4. Contrast Enhancement using Fuzzy Rule |
4. Contrast Enhancement using Modified Sigmoid Function
- Sigmoid function[13] is a continuous nonlinear activation function. The name, sigmoid, is obtained from the fact that the function is "S" shaped. Statisticians call this function the logistic function, Using x for input, f(x) as output and with t as a contrast factor term, the sigmoid function can be given as,
 | (3) |
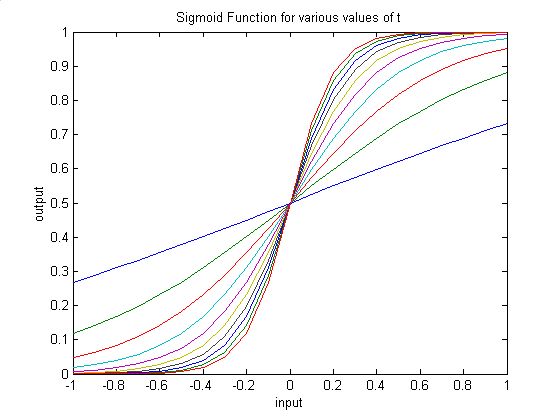 | Figure 5. Sigmoid function plotted for various values of ‘t’ |
 | (4) |
4.1. Algorithm
- Step 1. Input the image f(x,y)Step 2. Check the image informationStep 3. Extract R,G,B planes of the image Step 4. Rescale the color planes to the range of[0-1].Step 5.For each plane apply the modified sigmoid function explained using equation (4) to get the enhanced pixel values.Step 6.Finally concatenate the enhanced R,G,B planes to get the enhanced output image.Figure 6 shows the results obtained using modified sigmoid function. Figure 6a) shows the original image Img-3. For this image the threshold value is chosen as 0.3 and the contrast factor value is varied and the results are obtained. Figures 6b), 6c) and 6d) show the enhanced image obtained for a contrast factor of 5,8 and 10 respectively. From the results it is clear that as the contrast factor increases the image enhancement also increases but for contrast factor value greater than 10 the image tends to show a glared effect. For a contrast value of 5 the resulting image has got a dull washed out look, thus the optimal value for the contrast factor would be between 6 and 10.
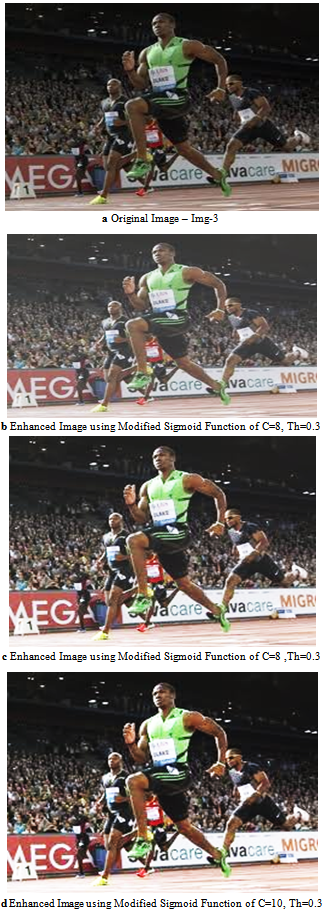 | Figure 6. Contrast Enhancement using Modified Sigmoid Function |
5. Discussions
- Contrast by definition, is a psychophysical non-measurable characteristic. On the other hand, de-facto, it is a quantitative parameter essential for digital image processing and algorithm developers have to use some formula for Contrast measure. There is no conventional measure for contrast, however to evaluate the contrast enhancement performance of our method, we have considered the following evaluation parameter discussed in[10]
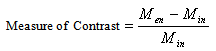 | (5) |
 - is the average intensity value of the enhanced image
 - is the average intensity value of the original input imageSeveral sports images are taken for the purpose of experimentation and the contrast enhanced results are obtained using the methods described above. Histogram Equalization method though it has shown better measure of contrast than fuzzy rule based method for some of the images, it is seldom used because of the disadvantages discussed earlier. The measure of contrast obtained for a sample of 8 test images is shown in table 1 and is also plotted in the graph shown in figure 6. From the table and the graph it is clear that the measure of contrast is high for the modified sigmoid function compared against the fuzzy rule base method and Histogram Equalisation. A very high Measure of Contrast is obtained for the modified sigmoid function with contrast factor C=10. When the contrast factor value is increased beyond that the image gets a glare effect. Thus the optimal value for the contrast factor would be between 6 and 10 as discussed earlier in section 4.1. Thus of the two methods proposed contrast enhancement using modified sigmoid function shows good results and can be used as an effective method for contrast enhancement of color images.
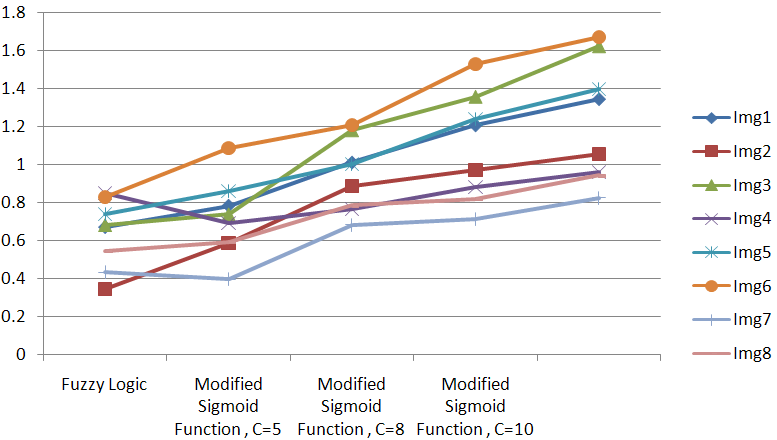 | Figure 7. A plot of Measure of Contrast for various images |
4. Conclusions
- Contrast enhancement of color sport images has gained importance recently with the advent in sports image processing. In this paper we have proposed two different approaches for contrast enhancement of dark sports images. Performance of both the methods is comparatively good against the conventional methods like histogram equalization and contrast stretching. Contrast Enhancement using fuzzy rule based method and modified sigmoid function has shown significant improvement in contrast and proves to be useful for further processing of sports images. Contrast enhancement using modified sigmoid function has the added advantage that it also flexible, that is contrast factor can be adjusted until satisfactory results are obtained. Discussions and investigations are going on to device a method which can by itself determine the contrast factor and threshold value. Contrast Enhancement of the color sports image is the first step in our process of analyzing the sports images to determine the performance of the players. Edge detection techniques are being explored for the next stage of analyzing the images.
References
| [1] | Xinguo Yu, Dirk Farin, “Current and Emerging Topics in Sports Video Processing”, IEEE, 2005 |
| [2] | Oakley, J. P., and Satherley, B. L. 1“Improving image quality in poor visibility conditions using a physical model for contrast degradation” IEEE Transactions onImage Processing 7 , 167–179,1998 |
| [3] | Giuseppe Bocignone, Antonio Picariello, “Multiscale Contrast Enhancement of Medical Images”, IEEE,pp 2789-2792.,1997 |
| [4] | Korpi-Anttila, “Automatic color enhancement and scene change detection of digital video”, Licentiate thesis, Helsinki University of Technology, Laboratory of Media Technology, 2003. |
| [5] | Pfizer S.M. et al, “Adaptive Histogram Equalization and its Variations”, Computer Vision, Graphics and Image Processing, vol. 39, pp. 355-368, 1987. |
| [6] | F.P.P. De Vries “Automatic, adaptive, brightness independent contrast enhancement", Signal Processing vol. 21, pp. 169-182, 1990. |
| [7] | J.A. Stark and W.J. Fitzgerald, "An Alternative Algorithm for Adaptive Histogram Equalization". Graphical Models and Image Processing,, vol.56, pp.180-185, 1996. |
| [8] | Lucchese and S.K. Mitra., "Filtering color images in the xyY color space," International Journal of Computer Science and Network Security, VOL.6 No.2A, February 2006 |
| [9] | Ding Xiao, Jun Ohya, “Contrast enhancement of color images based on wavelet transform and human visual system”,Proc of the IASTED International Conference Graphics & Visualisation in Engineering, January 3-5, 2007 |
| [10] | Srinivasan, S,“Adaptive Histogram-Based Video Contrast Enhancement,” Patent Filing, 2005 |
| [11] | N.R.Mokhtar et al, “Image Enhancement Techniques Using Local,Global, Bright, Dark and Partial Contrast Stretching For Acute Leukemia Images”, Proceedings of the World Congress on Engineering, Vol I WCE 2009 |
| [12] | S. Srinivasan and N. Balram, “Adaptive Contrast Enhancement Using Local Region Stretching, Proc.of ASID’06, 8-12 Oct, New Delhi, pp 152-155,2006 |
| [13] | Gustav J.Braun & Mark D.Fairchild,“Image lightness rescaling using Sigmoidal Contrast Enhancement Functions”, 1999. |
| [14] | Naglaa Yehya Hassan1, and Norio Aakamatsu, “Contrast Enhancement Technique of Dark Blurred Image”, IJCSNS International Journal of Computer Science and Network Security, VOL.6 No.2A, February 2006, pp 223-226. |
| [15] | Atul Bansal et al, “Simulation of Image Enhancement Techniques using Matlab”, Proceedings of the First Asia International Conference on Modelling & Simulation, (AMS’07), IEEE,2007 |
| [16] | Y. T. Kim “Contrast Enhancement Using Brightness Preserving Bi-Histogram Equalization”,IEEE Trans., Consumer Electronics.vol. 43, no. 1, pp. 1-8, Feb. 1997. |
| [17] | S. D. Chen and A. R. Ramli “Minimum Mean Brightness Error Bi-Histogram Equalization in Contrast Enhancement” ,IEEE Trans., Consumer Electronics, vol. 49, no. 4, pp. 1310-1319,Nov. 2003. |
| [18] | M. Abdullah-Al-Wadud, et al ,“A Dynamic Histogram Equalization for Image Contrast Enhancement”, IEEE Trans., Consumer Electronics ,vol.53, no. 2, pp. 593–600, May 2007. |
| [19] | H. Ibrahim, and N. S. P. Kong. “Brightness Preserving Dynamic Histogram Equalization for Image Contrast Enhancement”, IEEE Trans.,Consumer Electronics ,vol. 53, no.4, pp. 1752–1758,Nov. 2007. |
| [20] | P.Kannan. S.Deepa and R.Ramakrishnan, “Contrast Enhancement of Sports Images using modified sigmoid function”, Proceedings of IEEE International Conference on Communication Control and Communication Technologies, 2010. |
| [21] | Rafael C.Gonzalez et al, “Digital Image Processing, 2nd Ed, PHI. |
| [22] | Zadeh, L. A. “Fuzzy Sets”, Information and Control 8, 1965, pp. 338-353 |