-
Paper Information
- Previous Paper
- Paper Submission
-
Journal Information
- About This Journal
- Editorial Board
- Current Issue
- Archive
- Author Guidelines
- Contact Us
American Journal of Intelligent Systems
p-ISSN: 2165-8978 e-ISSN: 2165-8994
2012; 2(5): 129-140
doi: 10.5923/j.ajis.20120205.07
RODHA: Robust Outlier Detection using Hybrid Approach
 Abstract
 Reference
 Full-Text PDF
 Full-Text HTML
A. Mira , D.K. Bhattacharyya , S. Saharia
Dept. of Computer Science & Engg., Tezpur University, Sonitpur, Assam, 784028, India
Correspondence to: A. Mira , Dept. of Computer Science & Engg., Tezpur University, Sonitpur, Assam, 784028, India.
| Email: |  |
Copyright © 2012 Scientific & Academic Publishing. All Rights Reserved.
The task of outlier detection is to find the small groups of data objects that are exceptional to the inherent behavior of the rest of the data. Detection of such outliers is fundamental to a variety of database and analytic tasks such as fraud detection and customer migration. There are several approaches[10] of outlier detection employed in many study areas amongst which distance based and density based outlier detection techniques have gathered most attention of researchers. In information theory, entropy is a core concept that measures uncertainty about a stochastic event, and it means that entropy describes the distribution of an event. Because of its ability to describe the distribution of data, entropy has been applied in clustering applications in data mining. In this paper, we have developed a robust supervised outlier detection algorithm using hybrid approach (RODHA) which incorporates both the concept of distance and density along with entropy measure while determining an outlier. We have provided an empirical study of different existing outlier detection algorithms and established the effectiveness of the proposed RODHA in comparison to other outlier detection algorithms.
Keywords: Distance Based , Density Based, Entropy, Locality Sensitive Outlier
Article Outline
1. Introduction
- The majority of the earlier research works of data mining focussed on the general pattern applicable to the larger section of the data. On the other hand, outlier detection focuses on that smaller section of data that exhibit exceptional behaviour compared to the rest large amount of the data. A well-quoted definition of outliers is first given by Hawkins[12]. It states, "An outlier is an observation that deviates so much from other observations so as to arouse suspicion that it was generated by a different mechanism". Outlier detection, since its inception has been regarded as an important aspect for study in data mining research as it uncovers the valuable knowledge hidden behind whole data and aiding the decision makers to make profit or improve the service quality. Outlier detection has several applications. For example, outlier detection can be employed as a pre-processing step to clean the data set from erroneous measurements and noisy data points. On the other hand, it can also be used to isolate suspicious or interesting patterns in the data. Examples include fraud detection, customer relationship management, network intrusion, clinical diagnosis and biological data analysis.In this paper we have provided an empirical study of some existing outlier detection techniques. We have done a detail theoretical study and implementation of Locality Sensitive Hashing (LSH)-based outlier detection technique proposed by Wang (et. al )[20]. Apart from this we have proposed a robust outlier detection algorithm using a hybrid approach (RODHA) based on both distance and density based approach along with incorporating the entropy measure to determine the outliers. The proposed RODHA can be found to be significant in view of the following points.• Free from the restriction of the using specific proximity measure.• Takes the benefit of distance based, density based as well as information theoretic approach while identifying an outlier.• Sensitive and scalable.• Performance is independent of dimensionality and number of clusters.Rest of the paper is organized as follows: section 2 reports related research. In section 3, we provide the background of our work. In section 4, the LSH-based outlier detection technique is described in brief. Section 5 presents the proposed RODHA approach and the empirical evaluation of the method is reported in detail in section 6. Finally, concluding remarks and future direction of research is given in section 7.
2. Related Research
- There are two kinds of outlier detection methods: formal tests and informal tests [22]. Formal and informal tests are usually called tests of discordance and outlier labelling methods, respectively. Most formal tests need test statistics for hypothesis testing. They are usually based on assuming some well-behaving distribution, and test if the target extreme value is an outlier of the distribution, i.e., whether or not it deviates from the assumed distribution. Some tests are for a single outlier and others for multiple outliers. Selection of these tests mainly depends on numbers and type of target outliers and type of data distribution. Even though formal tests are quite powerful under well-behaving statistical assumptions such as a distribution assumption, most distributions of real-world data may be unknown or may not follow specific distributions such as the normal, gamma, or exponential. Another limitation is that they are susceptible to masking or swamping problems.On the other hand, most outlier labelling methods, informal tests, generate an interval or criterion for outlier detection instead of hypothesis testing, and any observations beyond the interval or criterion is considered as an outlier. There are two reasons for using an outlier labelling method. One is to find possible outliers as a screening device before conducting a formal test. The other is to find the extreme values away from the majority of the data regardless of the distribution. Some very popular outlier labelling parameters are Z-score[22], Standard deviation (SD) method[22], Turkey’s method, MADe method[22] and Median Rule[22].In data mining, the problem of outlier detection has been tried to solve based on several approaches [10] in different problem domains. The class of solution to outlier detection ranges from statistical methods to geometric methods and from density based approaches to distance based approaches. Statistical methods are appropriate if one has a good sense for the background distribution but typically does not scale well to large datasets or datasets of even moderate dimensionality. Geometric methods essentially rely on variants of the convex hull algorithm which has a complexity that is exponential in the dimensionality of the data, and they are often impractical. The distance-based approach[15] originally proposed by Ng and Knorr. They define a point to be a distance-based outlier if at least a user-defined fraction of the points in the dataset are further away than some user-defined minimum distance from that point. In their experiments, they primarily focus on datasets containing only continuous attributes. This can be expensive to compute particularly in higher dimensions. A standard distance based approach called ORCA[3] proposed by Stephen D. Bay employs some pruning rule for optimization of processing time in large multi-dimensional datasets. Because of this pruning rule the algorithm scales well to a linear time in case of high dimensional dataset. Another distance based approach in conjunction with a ranking scheme is the Locality Sensitive Hashing (LSH)-based outlier detection proposed by Wang (et. al)[20]. Here the outlier ranking scheme is based on a hashing concept called Locality Sensitive Hashing (LSH). The basic idea for LSH is to convert the data into manageable fingerprints and hash them so that similar data points are mapped to the same buckets with high probability. Density-based approaches [4] to outlier detection rely on the computation of the local neighbourhood density of a point. In one such technique, a local outlier factor (LOF) is computed for each point. The LOF of a point is based on the ratio of the local density of the area around the point and the local densities of its neighbours. The size of a neighbourhood of a point is determined by the area containing a user-supplied minimum number of points (MinPts). Pang-Ning Tan proposed OutRank-b[16], a graph-based outlier detection algorithm. In this technique the graph representation of data is based upon two approaches- the object similarity and number of shared neighbours between objects. Besides this a Markov chain model is built upon this graph, which assigns an outlier score to each object. Agrwal[21] has suggested a local subspace based outlier detection which uses different subspace for different objects. This approach basically adopts local density based outlier detection by defining a Local Subspace based Outlier Factor (LSOF) in high-dimensional datasets. A. Ghoting (et. al)[23] proposed an outlier detection algorithm, LOADED, for outlier detection in evolving datasets containing both continuous and categorical attributes. LOADED is a tuneable algorithm, wherein one can trade off computation for accuracy so that domain-specific response times are achieved. S. Wu (et. al)[24] incorporated the concept of entropy to propose an information theoretic outlier detection technique for large-scale categorical data. This strategy, first, adopts a deviation-based strategy, avoids the use of statistical tests and proximity-based measures to identify exceptional objects. Secondly, combine entropy and total correlation with attribute weighting to define the concept of weighted holo-entropy, where the entropy measures the global disorder of a data set and the total correlation measures the attribute relationship.
2.1. Discussion and Motivation
- From the inception of research on outlier detection in data mining, researchers have focussed on most trivial distance based approach to most recent ranking driven approach[20] of outlier detection. In course of time, several contextual modifications are made on density-based, graph-based and statistical outlier detection approaches, but none is able to provide a very acceptable solution, with a high accuracy, to the outlier detection problem. To summarize, based on our survey we observe the following.• Although distance based approach is a trivial criteria for outlier detection, but it alone is not suitable for the datasets having clusters of different distribution. • In the distance based outlier detection[15], the main overhead is the selection of the user-defined fraction of data those are further away than another user-defined threshold distance.• The Statistical approaches require either construction of a probabilistic data model based on empirical data, which is rather a complicated computational task, or require a priori knowledge of the distribution laws. Even if the model is parameterized, complex computational procedures for finding these parameters are needed. Moreover, it is not guaranteed that the data being examined match the assumed distribution law if there is no estimate of the density distribution based on the empirical data.• Density based approach of outlier detection considers neighbourhood density of points to declare outlier or non-outlier. This approach is able to provide better detection results if selection of the required input parameter is done accurately.• The performance of the existing outlier detection algorithms are dataset dependent. Therefore, development of a robust, sensitive outlier detection technique which is free from the limitations offered by the aforesaid algorithms is of utmost importance.
3. Background of the Work
- In this section, we will discuss the background concepts which provide the basis of our work. The proposed outlier detection technique is a combination of both distance and density based outlier detection approach along with the concept of entropy as a measure for outlier detection.
3.1. Outlier
- Outliers are those observations in the data that do not conform to the inherent patterns of the data. There are several definitions given for outlier from different view point. An example of outliers in two dimensional dataset is illustrated in Figure 1. Outliers may be induced due to a variety of reasons such as malicious activity (e.g., credit card fraud, cyber attacks, novelty detection, and breakdown of a system), but all these reasons have a common characteristic that they are interesting to the analyst. The interestingness or real life relevance of outliers is a key feature of outlier detection[19]. Outlier detection is related to, but distinct from noise removal or noise accommodation that deals with unwanted noise in the data. Noise does not have any real life significance and acts as hindrance to data analysis.
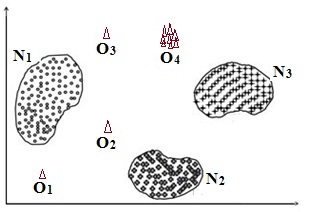 | Figure 1. Outliers in two dimensional dataset: N1, N2, and N3 are the three normal regions. Points that are sufficiently far away from the normal region (e.g., points O1, O2, O3 and points in O4 regions) are outliers |
3.2. Distance-based Outlier
- Distance-based method was originally proposed by Knorr and Ng[15]. It states that -"An object O in a dataset T is a DB(p, D)-outlier if at least fraction p of the objects in T lies greater than distance D from O". This notion is further extended based on the distance of a point from its k-th nearest neighbour. Alternatively, the outlier factor of each data point is computed as the sum of its k-th nearest neighbours. Here the distance can be proximity given by any of the dissimilarity measure Euclidian distance, Lp norm, Cosine distance etc.
3.3. Density-based Outlier
- Density-based approach was proposed by Breuning et al.[4]. It relies on the local outlier factor (LOF) of each point, which depends on the local density of its neighbourhood. In our work we considered local neighbourhood density in terms of number of points lying in the -neighbourhood of the object. In this view point, an outlier is the point lying so sparsely that there are not more than a threshold MinPts number of other points lying in the -neighbourhood of that point.
3.4. Entropy
- In information theory, entropy is core concept that measures uncertainty about a stochastic event and it means that entropy describes the distribution of an event[13]. Entropy is a measure of disorder or more precisely unpredictability in a system. In entropy-based clustering, an object is added to that cluster such that upon addition the increase in intra-cluster entropy is minimum among all other clusters. Since outlier is the observation that deviates from the inherent pattern of the data, so upon addition of such point to any cluster in the dataset, the increase in entropy is much higher than a non-outlier point. This notion is an important criterion for entropy based outlier detection. Shannon denoted the entropy H of a discrete random variable X with possible values {x1,x2....., xn} and probability mass function p(X)[8] as,
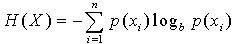 | (1) |
4. Locality Sensitive Hashing (LSH)-based Outlier Detection
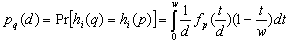
- This is a distance based approach in conjunction with a ranking scheme based on the concept of Locality Sensitive Hashing (LSH)[5]. The basic idea for LSH is to convert the data into manageable fingerprints and hash them so that similar data points are mapped to the same buckets with high probability. Definition: A family H is called (R, c, P1, P2)-sensitive if for any two points p, q
 [5]
[5] | (2) |
 | (3) |
4.1. Outlier Likelihood Ranking
- The points in the database are first ranked based on their likelihood to be an outlier. The resulting rank-ordered list is then processed in the detection phase where the actual outliers are found. The intuition behind this outlier ranking order is-lower the rank, higher is the likelihood to be an outlier. The outlier likelihood rank of any object is given by a ranking function called LSH function h(v) that leverages p-stable distribution[20][5].
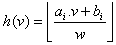 | (4) |
 | (5) |
 | (6) |
 between them increases. The performance of the locality sensitive hashing (i.e. the hash family H) depends on the parameter R, which is an estimate of distance between a normal point and one of its neighbours. There exists several research efforts focusing on addressing issues related to LSH parameter tuning[2][7]. The LSH-based outlier detection[20] relies on ranking for efficiency, not correctness. Therefore, a slightly less accurate ranking will not significantly impact performance of outlier detection. However, an efficient approach for estimation of R is employed in[20] based on the already generated clusters. First some pairs of points are sampled, where each pair of points are in the same cluster, and then calculate the distances between these pairs. Finally, set the median of these distances as the estimated value of R.
4.2. Ranking Methodology
- For a given point q, let Nq denotes the number of points that hash to the same bucket as q. We define rank(q) as follows[20]
 | (7) |
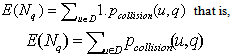 | (8) |
4.3. Outlier Detection
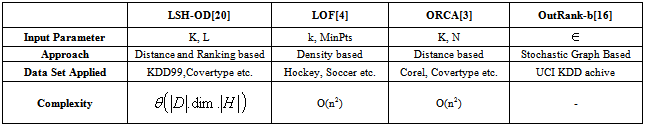
- After the ranking is over, the objects are processed in an increasing order or rank. This ordered ranking scheme has the advantage of processing most probable outlier candidates first. Again, based on the weakest outlier score and user defined parameter k, first L number of outliers is returned as output.Apart from the LSH-based outlier detection technique[20], we have compared our proposed outlier detection technique, RODHA, with three other outlier detection techniques viz. LOF[4], ORCA[3] and OutRank-b[16]. The Table 1 shows a general comparison of these four existing outlier detection techniques.
5. RODHA: The Proposed Outlier Detection Technique
- RODHA (Robust Outlier Detection using Hybrid Approach) is designed using a combination of both distance and density based outlier detection approach in conjunction with entropy measure from information theory. The basic framework of the RODHA is shown in the figure 2. It requires clustering of the data as a pre-processing step. Then the distance based approach defines an object to be an outlier when its minimum distance from all the cluster profiles is greater than the maximum intra-cluster distance of all the clusters in the data. The density-based approach to outlier detection relies on the computation of the local neighborhood density of a point. Implicit to this approach is the notion of distance but an additional criterion is that of neighborhood and the determination of number of points lying within a neighborhood of interest. Finally, the notion of entropy based outlier is that a candidate outlier sample when added to its nearest cluster would increase the intra-cluster entropy by an amount much higher than a non-outlier sample when added to the same cluster.
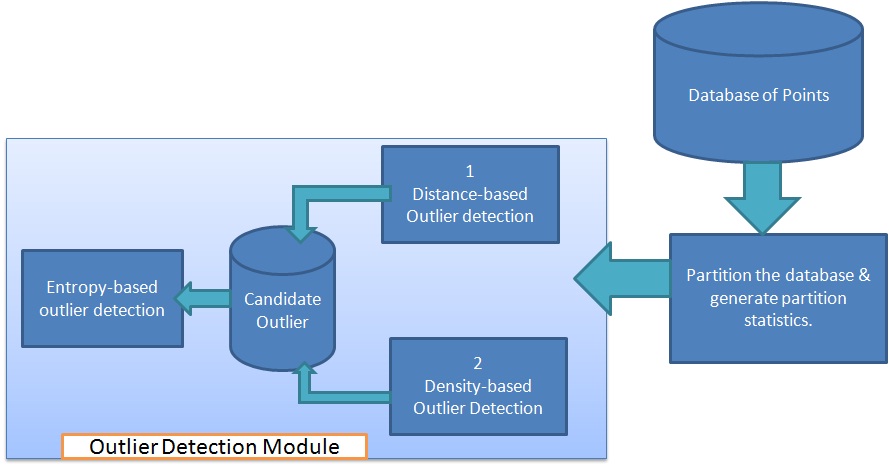 | Figure 2. Basic Framework of RODHA |
 where d is dimension of the points in the database. As a pre-processing step, the dataset D is divided into two parts, a large training set Dtrainset and a smaller test set Dtestset. The overall framework of the proposed technique consists of four phases as follows.
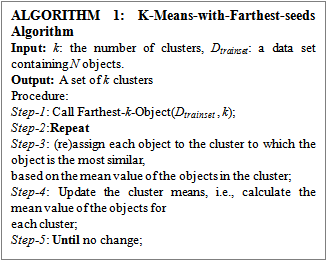
5.1. Clustering the Training Set
- The given training set Dtrainset is clustered to produce k number of clusters C1, C2,......Ck and accordingly the objects are labeled. Although clustering is a pre-requisite to the outlier detection framework, the final outlier detection is independent of the exact choice of the clustering method. We have used k-means clustering algorithm 1[11]. One can employ other popular clustering methods like k-medoid, DBSCAN, fuzzy c-means etc clustering methods. The performance of k-means clustering depends heavily on the selection of initial cluster centroid. So, we have employed a routine for selecting the farthest k objects as the initial cluster centroid.
5.1.1. Initial Centroid Selection
- The farthest k objects from the training set, Dtrainset are selected as the initial centroid in the k-means clustering algorithm. The first centroid is selected randomly from the training set Dtrainset. The point farthest from the first selectedpoint is selected as the second initial cluster centroid. Then, the next centroid is the point in the training set, Dtrainset, for which the sum of its distance from all the already selected centroid is maximum. This process continues until all the user defined number of centroids are selected.For datasets having very high dimensions, the farthest-k-objects selection using the above distance based approach suffers from curse of dimensionality. For those datasets, it is preferable to employ spatial index structures like R-tree or its family members, because it can reduce-(a) the cost of neighbourhood computation as average case complexity of searching in R-tree is O(logmn), where n is the total number of nodes in the R-tree and m is the number of entries in a node, and(b) the cost of finding the farthest point significantly.

5.2. Distance based Outlier Detection
- Let us consider the dataset D has the spatial distribution as shown in the figure 3, i.e. the clusters C1, C2,......Ck in the data set are of convex nature being well-separated from one another. Let CC1, CC2,......CCk be the respective centroids of the k clusters in the dataset D. Find the maximum distances dmax1, dmax2,......dmaxk of the centroids to the cluster objects. Then identify the threshold distance dthres as the maximum of the values dmax1, dmax2,......dmaxk. For a test object O, find dmin, the minimum of the distances dOC1, dOC2,......dOCk of the object O to the centroid CC1, CC2,......CCk. If dmin is greater than dthres, then the test object O is identified as an outlier, otherwise it is a normal object.
|
 | Figure 3. Illustrating distance-based outlier detection approach. C1, C2, C3 are three normal clusters in the data, Outlier point O's minimum distance from all three clusters dmin=dOC1 is greater than maximum intra-cluster distance dthres=dmax2 |
 | Figure 4. Illustrating distance-based outlier detection approach fails in case of clusters being concave in nature. C1, C2 are two normal clusters in the data, Outlier point O1's minimum distance from the two clusters dmin=dOC1 is not greater than maximum intra-cluster distance dthres=dmax1 |
5.3. Density based Outlier Detection
- The density based approach requires selection of a parameter value ε which is the distance to check the availability of any training samples within the ε-neighbourhood of the test sample O.Definition (ε-neighbourhood): For an object O, ε-neighbourhood finds all the samples within a distance of ε from the object O.For a test object O, first find all the points in the ε-neighbourhood of O. Followed by this, check whether these neighbouring points are already labelled. If there are no points in the ε-neighbourhood of O that are also labelled, i.e. the object O lying much away from the boundary of any cluster in the data set, then the object O is a candidate to be an outlier. One such situation is shown in the figure 5.
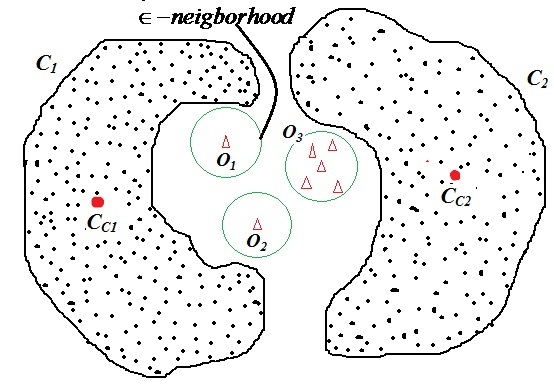 | Figure 5. illustrating density-based outlier detection approach. C1, C2 are two normal clusters in the data, the green circle around O1 and O2 shows their ε-neighbourhood within which no cluster-labelled points lying. O3 depicts a too small group of objects to form a cluster and within ε-neighbourhood lies no cluster labeled points. So, O1, O2 and groups of O3 are all outliers |
5.4. Entropy as a Parameter for Outlier Detection
- In information theory, entropy is core concept that measures uncertainty about a stochastic event and it means that entropy describes the distribution of an event[13]. Entropy is a measure of disorder or more precisely unpredictability in a system. In the field of data mining, entropy has been used in clustering applications[13] where an object is included to that cluster where its inclusion increases the intra-cluster entropy or disorder by minimum. The notion of entropy in this perspective provides important criteria for outlier detection. By the definition, an outlier is an instance that is much different from the inherent pattern of the data. Such an object instance when added even to its nearest alike cluster would increase the amount of intra-cluster entropy much higher than a non-outlier object when added to the same cluster.There are several mathematical formulations exist to measure entropy of a system. One of the very popular methods of entropy is Shannon entropy. We have employed an effective entropy measure known as "Renyi's Entropy"[13][17]. It is a generalized form of Shannon entropy developed by Alfred Renyi.Definition (Renyi's Entropy): Renyi's entropy for a stochastic variable X with probability density function (pdf) fx is given by
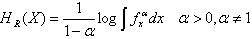 | (9) |
 we obtain,
 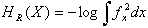 | (10) |
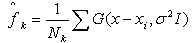 | (11) |
 I. By substituting equation 11 into equation 10 and utilizing the properties of the Gaussian kernel, we obtain an estimate of the entropy of Ck as
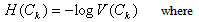 | (12) |
 | (13) |
5.5. Complexity Analysis
- The framework of the proposed outlier detection approach uses clustering as a pre-processing step. We have used k-Means-with-Farthest-seed for clustering which takes O(N*k*I) time, where N is the total number of objects, k, the number of clusters and I, the number of iterations. The Farthest-k-Object routine for initial cluster centroid selection takes an O(N) time. The within-cluster entropy can be calculated in O(Nc) operation for a cluster with Nc number of points. Followed by this, in Step-4 of the algorithm 3, for a Nc number of intra-cluster points the distance of centroid from all intra-cluster points take O(Nc*dim), where dim is the dimension of the dataset, and searching for maximum of maximum intra-cluster distances take linear time complexityIn Step-6, for the test dataset Dtest[m*dim], the distance from all test objects to centroids take O(m* k*dim) time and the searching for minimum among all the distance take a linear O(k) time. While searching for -neighbourhood of Oi, the algorithm considers objects from both training and test datasets and calculates the distances. So, the complexity in this step is O((m+N)*dim). Finally, in Step-10 to Step-12, adding each candidate point to nearest cluster and then caculating the updated entropy takes O(Nc+1). Thus the overall complexity of the proposed outlier detection technique is O(N*k*I + m*k*dim + (m+N)*dim) + O(Nc). For a large dataset with small number of clusters, we can ignore k, then the overall complexity becomes O(N*I+N*dim).
6. Empirical Evaluation
6.1. Environment Used
- The proposed RODHA algorithm is implemented in a computer system with processor Intel(R) Core(TM) 2 Quad CPU Q6600 @ 2.4 GHz and RAM of 2 GB in a 32-bit Windows 7 operating system. The algorithms are programmed in programming language C (Borland C++ version 4.5) and Matlab (version 7.6.0 R2008a).
6.2. Datasets Used
- Several synthetic and real life datasets are used for testing the performance of the proposed RODHA and the LSH-based outlier detection algorithm. The real-life datasets are downloaded from UCI Machine Learning Repository website. In the Table 2, we have provided the basic information about the data sets considered for our experiments. For the data sets having missing values, prior to implementing the outlier detection algorithms, we estimated the missing values using two very popular estimation techniques- KNN Imputation[18] and LLS Imputation[14].
|

|
6.2.1. KNN-Impute
- The k-Nearest Neighbour based method selects samples similar to the sample of interest to impute missing values. If we consider sample O that has one missing value in first attribute, this method would find k other objects, which have a value present in attribute 1, with attribute values most similar to O in attributes N-2 (where N is the total number of attributes). A weighted average of values in attribute 1 from the k closest samples is then used as an estimate for the missing value in sample O. In the weighted average, the contribution of each sample is weighted by similarity of its attributes to that of sample O. For similarity metric we can employ the proximity measures like Euclidian Distance, Pearson Correlation Coefficient etc.
6.2.2. LLS-Impute
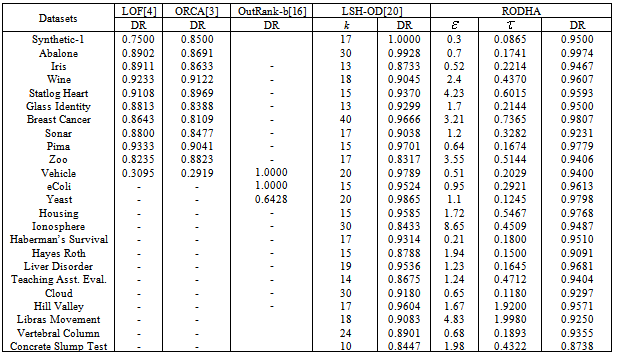
 | Figure 6. Performance of Imputation methods in terms of NRMSE |
 | (14) |
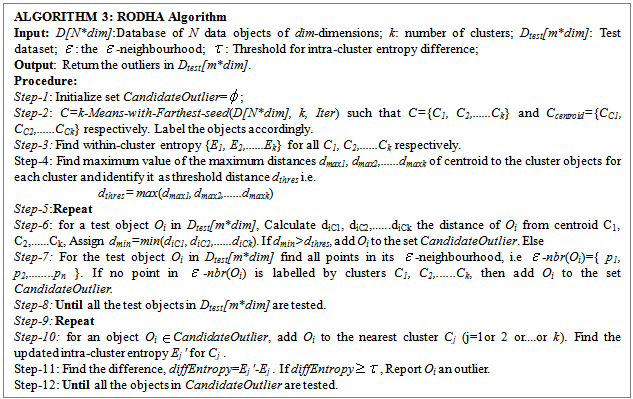
6.3. Experimental Results
- As mentioned earlier, we have implemented the proposed outlier detection algorithm (RODHA) and the LSH-based outlier detection[20] on the datasets tabulated in Table 2 from UCI Machine Learning data set archives. The RODHA algorithm is compared with four other outlier detection algorithms-LSH-OD[20], ORCA[3], LOF[4], and OutRank-b[16]. These techniques are compared based on the detection rates of outliers. The detection rate (DR) is calculated based on the ROC analysis proposed in[9].We have downloaded the executable versions of LOF[1] and ORCA[3]. Results of LOF and ORCA are also reported for these datasets in the columns 2 and 3 respectively. The detection rate values for OutRank-b are taken from the paper[16]. The comparison of these five different techniques over 14 different synthetic and benchmark datasets is shown in the Table 3.
6.4. Discussion
- The effectiveness of the proposed technique depends upon the value of the user defined parameter and that of LSH-based technique depends upon user defined parameter k. So, in the last four columns of the Table 3, we have reported the detection rates of LSH-OD and the proposed technique RODHA along with the value of respective user defined thresholds (k and ε). Out of the 24 datasets (1 synthetic and 23 benchmark UCI datasets) except for (Vehicle and Hill Valley) where detection rate is slightly less, the proposed outlier detection algorithm shows excellent performance over all other datasets.
6.5. Entropy Measure as an Outlier Detector
- In our proposed technique of outlier detection we have used entropy from Information theory as a support to detect outlier. When one candidate outlier sample is added to its nearest cluster, it increases the within cluster entropy significantly than a non-outlier sample. So, we have used this significant increase of entropy as a weightage to declare the object an outlier. Figure 8 shows the effectiveness of entropy for outlier detection for a synthetic data set of figure 7. The bar diagram (figure 8) shows the change (i.e. increase) in intra-cluster entropy for the objects in the test set. The longer bars are the increase in entropy for outlier points that are much higher than the rest non-outlier points in the test dataset.
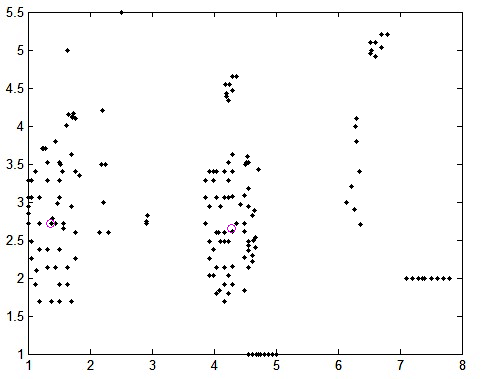 | Figure 7. A 2-Dimensional synthetic data set containing two clusters and outliers |
6.6. Sensitivity of the proposed Algorithm
- In order to test how sensitive the proposed algorithm towards detecting outliers, we have made a synthetic dataset as shown in the figure 9.The points in the synthetic dataset is distributed in six different ways. Here N1, N2 are two normal clusters, O1 is distinct outlier, O2 is distinct inliers, O3 is equidistant outlier, O4 is border inlier, O5 chain outlier, O6 is compact group of objects too small in numbers to form a cluster and O7 is outlier of "stay together" nature. To test the effectiveness of the algorithm, we label these as candidate outliers and run the outlier detection algorithm. The outliers returned by the technique is compared with the candidate outliers and we find the accuracy of the detection equal to 0.98 i.e. the algorithm is sensitive to such outliers with an accuracy level of 98%.
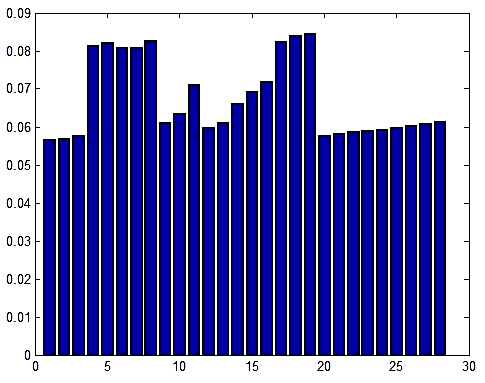 | Figure 8. Illustrating the increase in entropy for addition of test dataset objects in the nearest cluster. The bars with longer height are the entropy increase for outlier points |
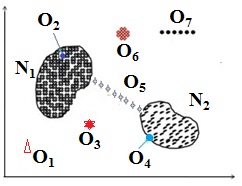 | Figure 9. Illustration of six different cases: N1 and N2 are two normal clusters, O1 is the distinct outlier, O2, the distinct inlier, O3, the equidistance outlier, O4, the border inlier, O5, a chain of outliers, O6 is another set of outlier objects with higher compactness among the objects and O7 is an outlier case of "stay together" |
6.7. Selection of threshold in the proposed RODHA Algorithm
- The effectiveness of the proposed outlier detection algorithm depends on the choice of the value for the threshold ε, which is a neighbourhood distance. The threshold value varies from data set to data set and this variation is very high since the datasets varies in number, type and range of attribute values. So, in order to provide a relatively common range of selecting the threshold value for different data sets, we normalize the data set attribute value within a range of 1.0 to 5.0 as a pre-processing step. While normalizing data within this range we discarded the attributes that take binary values or some fixed number of constant values. In the following figure 10 we have provided a heuristic method of selecting the ε-value where the detection rate is plotted against the ε-value for different datasets and the accuracy of detection is maximum for the threshold (ε) value within the range 0.4 to 1.5.
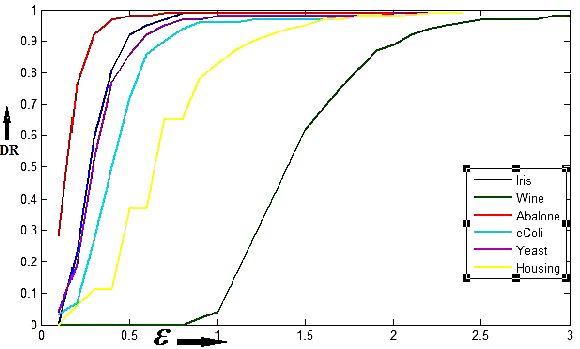 | Figure 10. Illustrating the accuracy of outlier detection for different values of ε in RODHA. It is useful for identification of threshold ε range values, where it performs well |
6.8. Selection of threshold τ in the proposed RODHA Algorithm
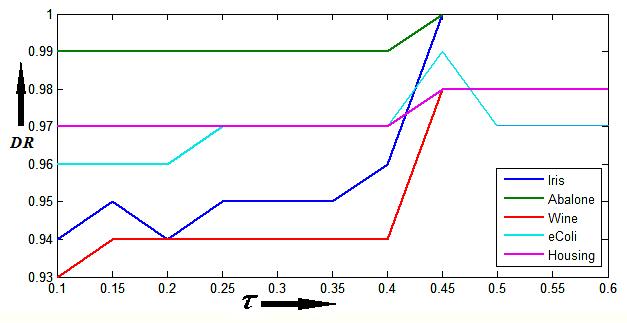 | Figure 11. Illustrating the variation of outlier detection rate against the user-defined threshold τ in RODHA |
6.9. Selection of threshold k in LSH-based outlier Detection Technique
- The performance of the LSH-based outlier detection scheme largely depends on the selection of k. Again, since the datasets are different in terms of number of objects, attribute value and range of attribute values, so the value of k also varies accordingly. However, here we have employed a heuristic method to find a most probable range of k leading to better result. In figure 12, we have shown the variation of accuracy (detection rate) of the algorithm with different value of k. We see that for the standard datasets namely Iris, Breast Cancer Wisconsin, Statlog Heart, e-Coli, Yeast, Housing and Wine the accuracy remains almost steady between 96% to 99% for value of k from 10 to 25. Beyond k value 25, the performance decreases significantly. Again although, for value of k between1 to 10 the graph shows the accuracy level of around 98%, but in that range the number of outlier detection is quite low. So, we consider that range of the value of k for which the accuracy level is relatively better and also the algorithm detects the probable outliers. In our experiments, better result of the outlier detection algorithm is found with k value in the range of 10 to 25.
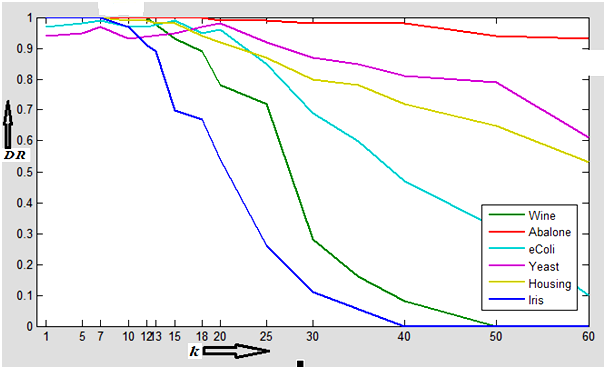 | Figure 12. Illustrating the accuracy of outlier detection for different values of k in LSH-OD. It is useful for identification of threshold k range values, where it performs well |
7. Conclusions and Future Work
- We have developed a hybrid supervised outlier detection algorithm based on both distance and density based approach. The effectiveness of the algorithm results from the combined distance and density based outlier detection approaches. The distance based approach alone is able to detect outliers for datasets where objects are uniformly distributed among the data clusters. The weakness of distance based approach in detecting outliers for non-uniformly distributed datasets is compensated by density based approach by considering the local density around a candidate outlier object. Furthermore, the incorporation of entropy for outlier detection makes it more robust and sensitive than other existing outlier detection techniques. The computation of within-cluster entropy using Renyi’s entropy measure has an advantage as it lends itself nicely to nonparametric estimation directly from data[25] and it considers how data are distributed within the cluster. Again, the proposed RODHA has a linear time complexity. The algorithm is tested on synthetic and real-life datasets from UCI ML Repository. The detection performance of the algorithm is competing excellent than other existing algorithms. In the present work, the datasets on which the proposed technique is tested are of integer or real type. So, our work is undergoing to extend the algorithm to work on mixed type datasets. Apart from this, the performance of the algorithm will be tested over network intrusion datasets.