Moses Abu-Sankey Kargbo1, Usman Adebimpe Raheem2, Enoch Terlumun Iortyom1, Kazeem Omotayo Laro2
1Department of Geography, Faculty of Geography, Environment Tourism and Sustainability Studies, Ernest Bai Koroma University of Science and Technology, Magburaka, Sierra Leone
2Department of Geography and Environmental Management, Faculty of Social Sciences, University of Ilorin, Ilorin, Nigeria
Correspondence to: Moses Abu-Sankey Kargbo, Department of Geography, Faculty of Geography, Environment Tourism and Sustainability Studies, Ernest Bai Koroma University of Science and Technology, Magburaka, Sierra Leone.
| Email: |  |
Copyright © 2026 The Author(s). Published by Scientific & Academic Publishing.
This work is licensed under the Creative Commons Attribution International License (CC BY).
http://creativecommons.org/licenses/by/4.0/

Abstract
Freetown has experienced significant urban growth over the past three decades, driven by the civil war and disease outbreaks. This study addresses knowledge gaps about the city's expansion rate, spatial pattern, and the relationship between urban growth and expansion. Using population census data from 1985, 2004, and 2015, along with Landsat images, the study assessed urban growth through maximum likelihood classification and accuracy assessment. Satellite imagery was used to classify land use and land cover, and area extents were calculated for each year. Spatial expansion patterns were evaluated by measuring percentage change, trends, and rates of change, while the relationship between urban growth and expansion was assessed using ordinary least squares. Results indicate that Freetown expanded by 1,949.3 hectares (26%) between 1988 and 2022, with an annual growth rate of 8.8 hectares. Future projections (2022–2056) using Markov chain and cellular automata analysis predict an additional 685.82 hectares of expansion by 2056, at a slower annual rate of 3.2 hectares, indicating more compact growth. With a strong positive correlation (R² = 96.01%, p = 0.003418) between urban growth and spatial expansion, the study recommends a comprehensive urban planning strategy focused on redevelopment and revitalization to manage future growth effectively.
Keywords:
Urban Growth, Urban Expansion, Land Use, Land Cover Change, Population, Freetown
Cite this paper: Moses Abu-Sankey Kargbo, Usman Adebimpe Raheem, Enoch Terlumun Iortyom, Kazeem Omotayo Laro, Assessment of Urban Growth and Expansion of Freetown, Sierra Leone 1988 – 2022, American Journal of Geographic Information System, Vol. 15 No. 1, 2026, pp. 1-10. doi: 10.5923/j.ajgis.20261501.01.
1. Introduction
Urban growth and expansion, also known as urban sprawl, have been transforming cities worldwide in recent decades. It is the process by which cities grow due to population growth and outward expansion beyond their original boundaries. The global urban population increased by 0.73 billion in 2009, and it is to reach 6.29 billion by 2050 [1]. In the same vein, while developing nations of the world are expected to house two-thirds of their population in urban centers by 2050 [2], the regions saw a population growth of 40% between 1900 and 1975, and this has equally been projected to house 60% of their inhabitants in urban centers by the year 2030 [3]. The global urban population has experienced non-parallel growth, with developing nations experiencing a faster growth rate than industrialized or developed nations. However, even among developing countries, growth rates differ; by 2030, the African urban population is expected to more than quadruple from 373.4 million in 2007, reaching more than 1.2 billion by 2050 [4]. Its growth rate is expected to be 70% faster than Asia’s, at 2.4% versus 1.4%, and faster than the global average of 1.3% and 0.3% for industrialized countries [5].Population growth and urban development have been simultaneous in recent decades, with population density and land-use change as essential characteristics of urban growth. In the nineteenth century, the increase in urban population was accompanied by a high population density. In recent decades, however, decreased urban population density has accompanied urban population expansion. If average densities continue to decline at the annual rate of 2.2% as they have over the past decade, the built-up area of industrialized-country cities will increase to some 500,000 square kilometers by 2030 [6]. In other words, by 2030, these cities can be expected to increase their populations by 20% and their land areas by 2.5 times, with each new resident converting, on average, about 500 square meters of non-urban land to urban land.Freetown, Sierra Leone’s commercial and administrative center, has seen remarkable urban growth fuelled by historical events such as the slave trade era, civil war, and disease outbreaks, as well as the city’s location as a seaside city on a mountainous peninsula. Sierra Leone’s civil war resulted in an estimated 500,000 internally displaced individuals (IDPs), most seeking safety in Freetown and remaining in the city, as did ex-combatants who had difficulties returning to their hometowns, frequently outside of Freetown [7]; this led not only to rapid population growth but also to urban expansion. Moreover, [8] reported a 71,000 visitor influx to Sierra Leone, with most tourists visiting destinations in and around the capital city. In the nineteenth century, Freetown had only a few thousand people on a small tract of land [9]. As a result of the influx of previously enslaved people, Freetown’s population had expanded to 11,000 by 1825; by 1840, it had grown to 40,000 [10]. Due to the colonial overlords’ reluctance to expand into the interior, the land area expanded only marginally while the population swelled. However, [11] noted that rapid urbanization is Sierra Leone’s most significant growth narrative for the 21st century, and that it results in changes in an area’s land use/land cover. How this growth in population over the years, from a small tract of land during the colonial period to modern-day Freetown, leads to urban expansion, and the rate and pattern of the expansion, remains to be seen. [12] attributed the impact of land use/land cover on agriculture and deforestation observed in Freetown to rapid population growth. According to [13], growth in built-up areas automatically leads to population growth, which frequently results in the destruction of forest resources for agricultural purposes and other economic gains. While studies have examined the impact of urban expansion on agriculture and other land use/cover, no study has examined the relationship between urban growth and urban expansion in Freetown.Therefore, this study seeks to understand the relationship between urban growth and urban expansion in Freetown between 1988 and 2022, examine Freetown’s land use/land cover change between 1988 and 2022, analyze the pattern of expansion of Freetown between 1988 and 2022, and predict the nature of urban growth and expansion of Freetown between 2022 and 2056.
2. Materials and Methods
This study analyzed the urban growth and expansion of Freetown over three decades, using population census data and satellite imagery to assess spatial patterns and their relationships.
2.1. Data Collection and Processing
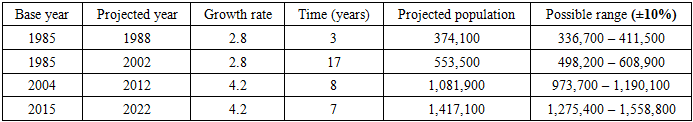
Population census data from 1985, 2004, and 2015 were obtained from Statistics Sierra Leone. Landsat 5, 7, and 9 satellite images were sourced from the United States Geological Survey (USGS). All data were georeferenced using the Sierra Leone 1968 UTM Zone 28N coordinate system. While the satellite imagery used for the study was obtained in various years, including 1988, 2002, 2012, and 2022, the population census data are collected at specific intervals, that is, every ten years, with the exception of the period between the 1985 census and the 2004 census, which marked the civil war. To ensure consistency in the analysis of the relationship between population dynamics and spatial patterns such as urban expansion, population figures were projected to match the years of available imagery, aligning the datasets temporally. The projections were based on the exponential growth formula as shown in Table 1 below: P = POert, where P = Projected population, PO = Base population, e = Exponential constant, r = Growth rate/100, t = Time interval. Table 1. Projected population
 |
| |
|
The satellite images were corrected for scanlines and underwent radiometric correction to reduce haze using linear contrast stretching, given as NewPixelValue =  where NewPixelValue = new pixel value after contrast stretching, PixelValue = original pixel value in the image, MinPixelValue and MaxPixelValue = minimum and maximum pixel values in the original image, respectively, and NewDynamicRange = desired dynamic range for the contrast-stretched image.
2.2. Image Classification and Accuracy Assessment
Maximum likelihood (supervised) classification was performed using ERDAS Imagine 2015. Five land-use and land-cover classes were identified based on FAO and USGS standards and field observations. GPS points were used to validate each class. An accuracy assessment was conducted using a confusion error matrix with five rows and five columns. At least 60 sample points were collected per class (300 points total), while 1,000 points were used for overall accuracy. The stratified random sampling method ensured proportional representation across classes. Accuracy metrics were calculated as follows: OverallAccuracy = TotalNumberOfCorrectlyClassified Pixels  NumberOfReferencedPixel ×100. The mapping accuracy of each land use land cover class was derived from the calculated producer and user accuracies [14] given as: UserAccuracy = NumberOfClassifiedPixelInEach
  NumberOfClassifiedPixel(RowTotal) × 100. ProducerAccuracy = NumberOfClassififedPixelInEach
  NumberOfClassifiedPixel(ColumnTotal) × 100. The Kappa coefficient (K^\hat (k)) was derived to evaluate classification reliability.
2.3. Spatial Analysis and Change Detection
Land-use areas (in hectares) were calculated for each study year, and an overlay analysis was conducted to detect changes. The spatial expansion pattern was evaluated using percentage change and the rate of change, calculated as follows: PercentageChange = Observed  OfChange ×100 [15]. The rate of change given as: AnnualRateOfChange = Percentage
 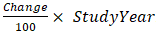 .
.
2.4. Regression Analysis
The relationship between urban growth and expansion was analyzed using the Ordinary Least Squares (OLS) method, given as: 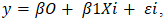 where y=dependent variable (urban expansion), βo=y-intercept, β1=slope coefficient, xi=independent variable (urban growth), εi=random error component.
2.5. Future Projection
The Markov Chain and Cellular Automata (CA–Markov) approach was used in IDRISI Selva 17.0 to model future urban growth (2022–2056). The model included built-up area, vegetation, water bodies, and bare land as land-use/land-cover (LULC) classes. LULC maps from 1988, 2002, 2012, and 2022, spanning a 37-year period, were used to create transition probability matrices. Future changes in land cover were then projected using these matrices. Using a 5 × 5 contiguity filter, which defines the neighborhood influence on land cover transitions, the Cellular Automata model was used to spatially allocate these changes. To simulate changes in land use over a 34-year projection period (2022–2056), the model was iterated to more realistically simulate future urban expansion patterns in Freetown by capturing both the spatial influence of neighboring cells and the temporal dynamics of land-cover transitions.
2.6. Limitations
It should be noted that the study makes use of four temporal data points, namely 1988, 2002, 2012, and 2022, and as such might not adequately incorporate all of the short-term variations and changes of Freetown urban growth and land use change. The analysis was also subjected to uncertainty due to the projected population numbers used to match census data with satellite imagery years were calculated using exponential growth assumptions. This is so because migration, economic conditions, disease outbreaks, government policies, and other unanticipated factors can all affect actual population changes that were not accounted for in the projection. Moreover, the 2056 prediction assumes that past land-use transition trends and spatial patterns will persist. However, this is bound to be affected by changes in planning policies, environmental regulations, infrastructure development, climate-related events, or socioeconomic transformations; future urban development may not necessarily follow historical trends. As a result, rather than being precise forecasts, the 2056 projections should be seen as reasonable future scenarios.
3. Results
The accuracy assessment produced an overall accuracy of 92.6% and an overall kappa statistic of 89.8% from the 1988 land cover map, while the 2002 land cover map produced an overall classification accuracy of 90.7% and an overall kappa statistic of 87.2%. On the other hand, the land cover map of 2012 produced an overall classification accuracy of 93.1% and an overall kappa statistic of 90.2%, while the 2022 land cover map produced an overall classification accuracy of 93.5% and an overall kappa statistic of 90.5%. Based on the kappa statistic rating criteria in [16], all land use/land cover maps produced by the classification fall within the 81-100% range, indicating an almost perfect classification for all the years under study. Hence, the classification can be relied on to make meaningful deductions.
3.1. Area Extent in Hectares of the Resulting Land Use
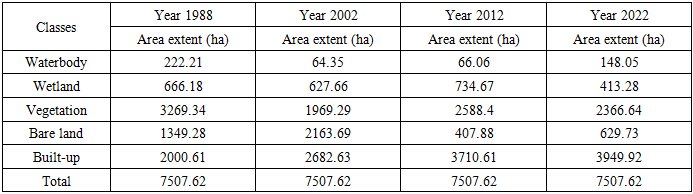
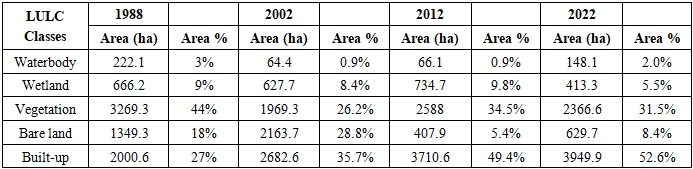
From Table 2 below, the built-up area expanded more than any other land use in the study area between 1988 and 2022, with no retrogressive growth and a consistent rise from one period to the next. The total built-up area grew from 2000.61 hectares in 1988 to 2682.63 hectares in 2002, 3710.61 hectares in 2012, and 3949.92 hectares in 2022. Vegetation cover, on the other hand, shrank in size from 3269.34 hectares in 1988 to 2366.64 hectares in 2022. While vegetation cover declined in 2002, bare land increased in size in 2022. The increase in bare land recorded in 2002 could be connected to the retreat of vegetation covering the same year, and this could be due to the pressure exerted on the environment as inhabitants of the city and its environs heavily depend on firewood and charcoal for fuel to which Davidson (1985) as cited in [17] asserted that firewood and charcoal combine to give at least 80% of the total energy demand for the peninsula area, representing Freetown and its environs. Table 2. Static land use/land cover area extent of Freetown
 |
| |
|
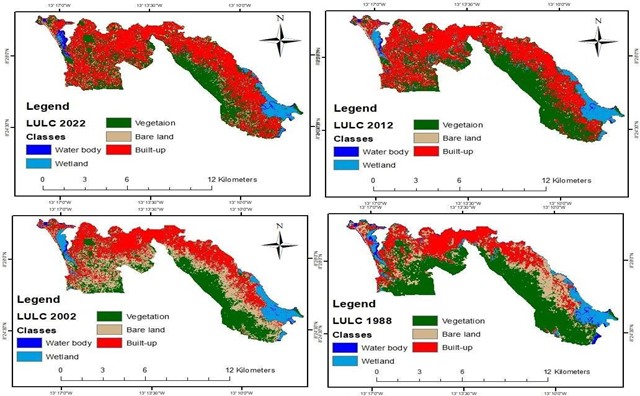 | Figure 1. Land cover maps of Freetown for the years 1988, 2012, and 2022 |
3.2. Land Use/Land Cover Change of Freetown 1988 – 2002
From Figure 2 below, the most notable change occurred between vegetation and bare land, with 1186.65 hectares of vegetation cover being converted to bare land. The exploitation of vegetation cover may be linked to the urban growth observed during this period. [7] noted that the civil war generated an estimated 500,000 Internally Displaced Persons (IDPs). It also revealed that bare land and vegetation were frequently converted to built-up areas, with 609.39 hectares and 277.47 hectares, respectively. On the other hand, water bodies experienced the least conversion to built-up areas. 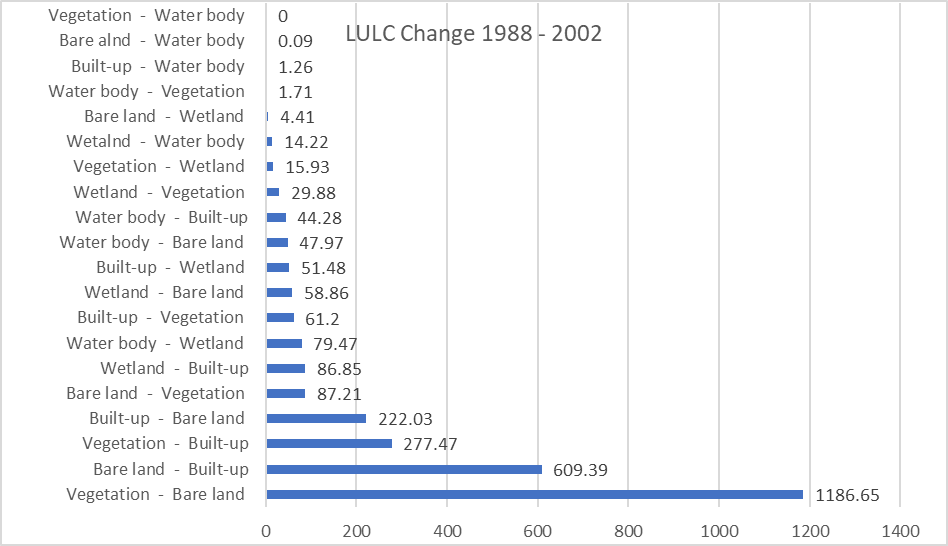 | Figure 2. land use/land cover change of Freetown 1988 – 2002 |
3.3. Land Use/Land Cover Change of Freetown 2002 – 2012
Figure 3 below presents the land use/land cover of Freetown 2002 – 2012, which marked the post-civil war period. During this period, there was a significant increase in Freetown's built-up area, with 2309.31 hectares converted. This expansion came at the expense of bare land and vegetation, with 1024.74 hectares and 309.15 hectares converted to built-up areas, respectively. In contrast, the conversion of water bodies to built-up areas was minimal, amounting to only 1.89 hectares. The findings suggest that the post-civil war period in Freetown strained natural resources. Interestingly, there was a notable increase in vegetation cover between 2002 and 2012, primarily at the expense of bare land. This indicates some positive changes in land use, with vegetation reclaiming previously bare areas. 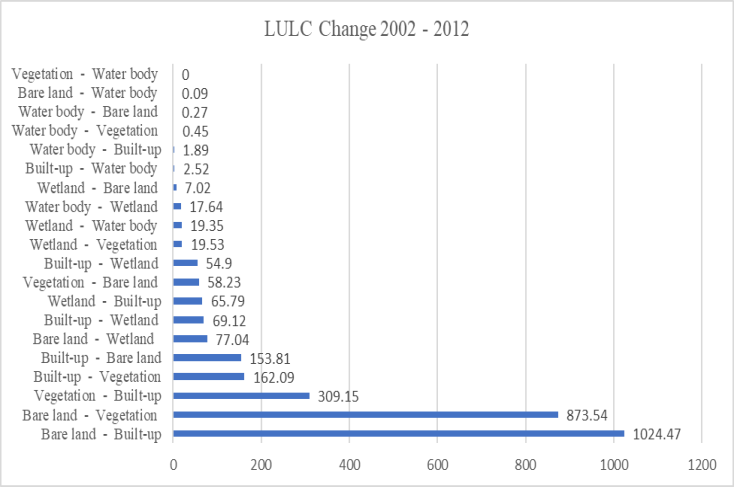 | Figure 3. Land use/land cover change 2002 – 2012 |
3.4. Land Use/Land Cover Change of Freetown 2012 – 2022
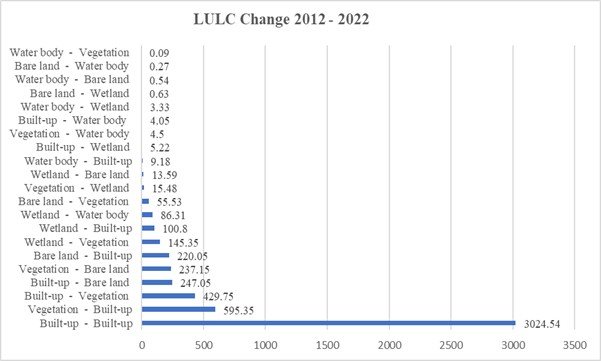 | Figure 4 |
The period between 2012 and 2022, as shown in Figure 4 above, shows a substantial increase in the built-up area of 3024.54 hectares. This growth can be attributed to stability, economic recovery, and a population growth rate of 4.2% per annum, resulting in high demand for housing and infrastructure development. Most of the built-up area expansion occurred at the expense of vegetation, with 595.35 hectares being converted to built-up areas. Additionally, there was a notable conversion of water bodies into built-up areas, particularly around slums and reclaimed water bodies near the city’s mountainous location. This resulted in a change of 21.97 hectares from water bodies to built-up areas.
3.5. Spatial Expansion Pattern of Freetown
As shown in Table 3 below, the share of built-up areas in Freetown’s land-use types has changed significantly over time. In 1988, built-up areas accounted for 27% of the overall share, making them the second-largest land-use type. This suggests steady urban development, possibly driven by the city’s population growth since independence. Subsequent periods, namely 2002, 2012, and 2022, witnessed a continuous increase in the share of built-up areas, reaching 35.7%, 49.4%, and 52.6%, respectively, thereby making it the most extensive land-use type in the post-civil-war period. In contrast, vegetation, which accounted for 44% of land use in 1988, experienced fluctuations in coverage. Its share decreased by one-third to 26.2% in 2002 but increased to 34.5% in 2012. However, by 2022, its share had slightly declined to 31.5%, remaining the second-largest land-use type. The decrease in the share of vegetation in 2002 can be attributed mainly to Freetown residents who resorted to farming during the civil war due to difficulties obtaining imports from other countries. Table 3. Share of land use/cover 1988, 2002, 2012, and 2022
 |
| |
|
3.6. Land Use/Land Cover Change Pattern (Trend) of Freetown
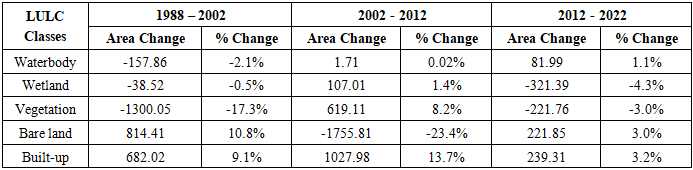
The analysis of Freetown’s land use/land cover change pattern reveals several key findings for the three distinct periods: 1988 – 2002, 2002 -2012, and 2012 – 2022. From 1988 to 2002, there was a decline in vegetation (-17.3%), wetlands (-0.5%), and water bodies (-2.1%), indicating a loss of these land-use types. The decrease in vegetation can be attributed to the impacts of the civil war, including deforestation for fuelwood and the establishment of settlements, which led to increased built-up areas and bare land. Land abandonment also contributed to the rise in bare land. Between 2002 and 2012, there was a significant decrease in bare land and an increase in vegetation cover and built-up areas. This suggests that most of the urban expansion during this period occurred on previously bare land. The conversion from bare land to built-up area was the most common land-use change, followed by conversion from bare land to vegetation. From 2012 to 2022, there was a decrease in vegetation, an increase in bare land, and an increase in built-up area, as shown in Table 4 below. This change can be associated with economic disruptions and ongoing urbanization processes. Throughout all three periods, there was a consistent trend of vegetation loss during economic difficulties, such as the civil war and disease outbreaks like Ebola and COVID-19. These challenging periods also marked slower growth in built-up areas. Economic disruptions and ongoing urbanization processes significantly shaped land use and cover changes during the examined periods. Understanding these patterns is crucial for effective urban planning and mitigating environmental impacts in Freetown. Table 4. Land use/land cover change trend (percentage change)
 |
| |
|
3.7. Annual Rate of Change
Figure 5 below shows the growth rates of built-up areas and other land-use types from 1988 to 2022. It shows a higher rate between 2002 and 2012, with an annual growth rate of 1.3% for the population under a million. However, between 2012and 2022, the growth rate declined to 0.3. This indicates that Freetown's urban expansion is occurring at a slower pace despite population growth. 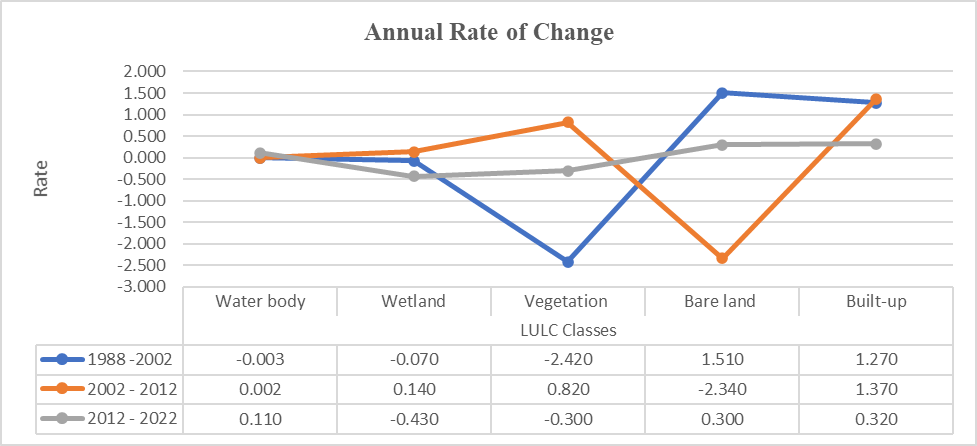 | Figure 5. The annual rate of change 1988 - 2022 |
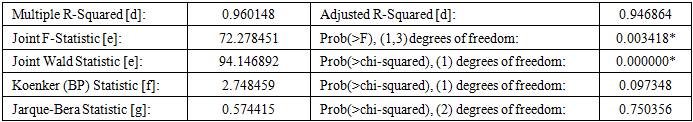
Table 5 below presents the Ordinary Least Squares (OLS) regression results of the relationship between urban growth and urban expansion. Given the small number of observations (n = 4), care must be taken when interpreting the model's high R2 value (0.960), which indicates a strong linear association between the variables. Statistical measures like R2, F-statistics, and p-values may not reliably demonstrate causality or predictive strength with such a small sample size. Therefore, the results are better understood as indicating a steady increase between the two variables over time, rather than as evidence that urban growth explains 96.01% of the variation in urban expansion. Therefore, this should be seen as a descriptive temporal pattern rather than a statistically significant causal relationship; the positive relationship implies that periods of increased urban growth are associated with corresponding increases in urban expansion. As a result, the results show a general trend of co-movement between urban expansion and growth; however, additional analysis with more time points would be necessary to develop a trustworthy inferential model.Table 5. The OLS regression diagnostic results
 |
| |
|
3.8. Land Use Land Cover Prediction 2056
Figures 6 and 7 below depict projected land-use and land-cover changes in Freetown for 2056. According to the model, the urban or built-up areas are expected to expand significantly, covering approximately 62% of the total land area. Meanwhile, vegetation is predicted to occupy around 25% of the land, followed by 8% bare land, 4% wetland, and 1% water body. These projections indicated a sustainable loss of Freetown’s water bodies, wetlands, and vegetation cover by 2056. 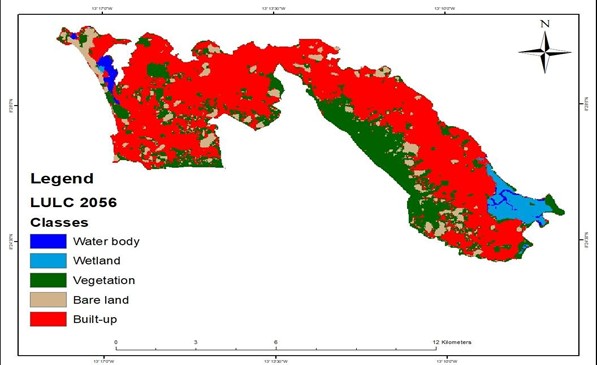 | Figure 6. Predicted land use land cover of Freetown 2056 |
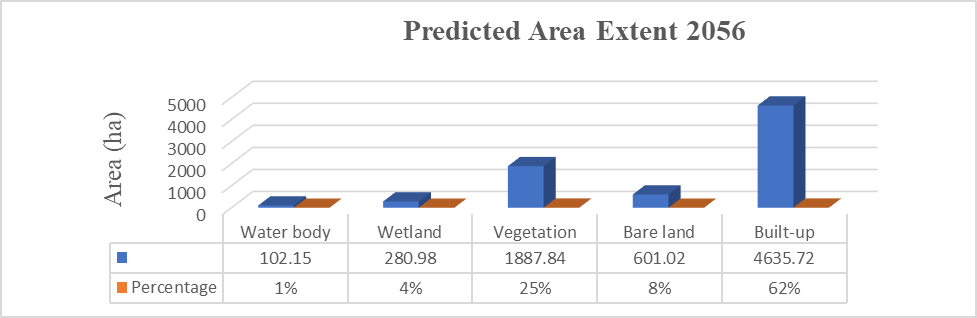 | Figure 7. Predicted area extent 2056 |
3.9. Predicted Land Use/Land Cover Change 2022 – 2056
Figure 8 below illustrates Freetown’s projected land-use and land-cover changes from 2022 to 2056. The model predicts that the built-up area will account for 62% of Freetown's total land area by 2056. Among the different land use types, vegetation is expected to undergo the most significant conversion to built-up areas, with approximately 500.76 hectares converted. Bare land is also projected to be converted to built-up areas, totaling around 286.56 hectares. On the other hand, wetlands and water bodies are expected to experience the least conversion to built-up areas, with only 61.11 and 26.37 hectares converted, respectively. These predictions indicate a substantial transformation of the land use in Freetown, with vegetation and bare land being the primary source of expansion for built-up areas. 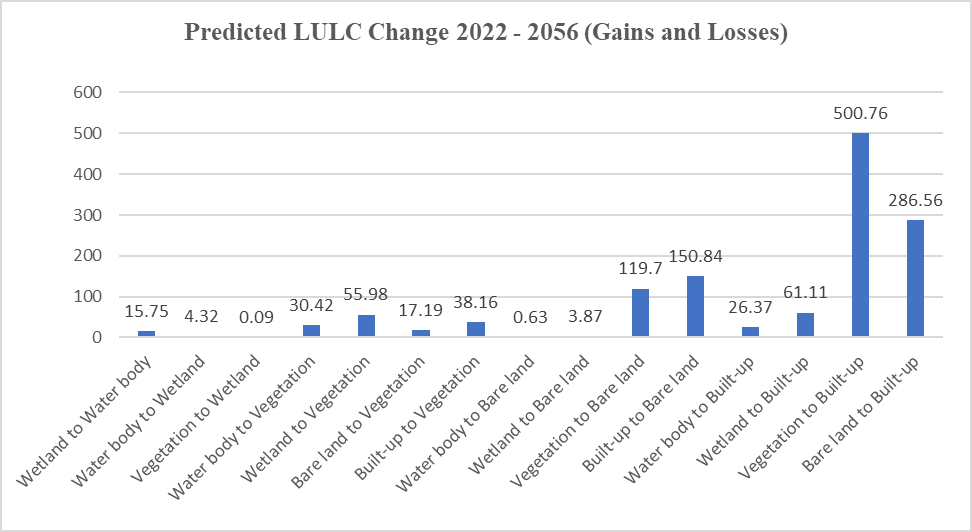 | Figure 8. Projected land use/land cover change of Freetown 2022 – 2056 |
3.10. The Land Use Land Cover Change Prediction 2056 Overlay
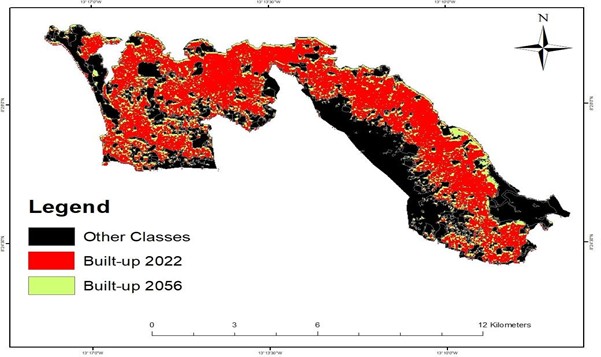 | Figure 9. Projected land use land cover change overlay operation |
From Figure 9 above, the overlay analysis for the predicted changes from 2022 to 2056 indicates a relatively uniform distribution of urban expansion throughout Freetown. However, it also highlights that a significant portion of the projected conversion of wetlands to built-up areas will occur in the city’s eastern part. This suggests that the eastern region of Freetown will undergo a notable transformation in land use, with wetlands converted to urban areas.
3.11. Observed and Predicted Land Use/Land Cover Change Pattern (Trend) 2022 – 2056
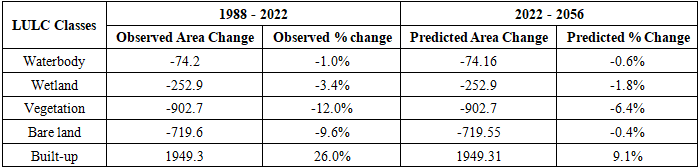
Table 6 below presents the observed and projected land-use/land-cover change patterns. Among the different types, only the built-up area is expected to show a positive trend between the observed and projected periods, indicating a long-run gain.Table 6. Observed and predicted land use/land cover change pattern
 |
| |
|
However, the projected trend of urban expansion indicates a significantly slower growth rate, with an anticipated 9.1% increase between 2022 and 2056, compared with the observed 26.0% increase between 1988 and 2022. This suggests that the rate of urban growth in Freetown is expected to decline, leading to slower expansion of built-up areas than in previous decades.
4. Discussion
The land-use/land-cover change between 1988 and 2002 in Freetown marked both the beginning and the end of the civil war. During this period, the most noticeable change was the conversion of vegetation to bare land, with 1186.65 hectares of vegetation cover converted. This change is consistent with the findings of [18], who noted that the exploitation of land resources tends to increase after a war, overshadowing any short-term recovery of forests and other resources. This conversion from vegetation to bare land, according to [7], is due to an estimated 500,000 Internally Displaced Persons (IDPs) generated by the civil war, which [17] noted that very few things may provide a strong impression of stability and changelessness, like wood fuel, which consists of charcoal and firewood, and this is especially noticeable in Freetown. The period between 2002 and 2012 marked the end of the civil war, during which the built-up area expanded by 2309.31 hectares at the expense of 1024.74 and 309.15 hectares of bare land and vegetation, respectively. The findings suggest that the post-civil war period strained natural resources in Freetown. Displaced individuals, including internally displaced persons (IDPs), exerted pressure on the environment for fuel and food, as noted by [21]. The pattern of spatial expansion in Freetown between 1988 and 2022 shows fluctuations in vegetation cover and a steady increase in built-up area, reflecting periods of economic instability caused by the civil war and disease outbreaks. Vegetation cover was 44% in 1988, a period of stability (post-civil war); 26.2% in 2002, which marked the end of the civil war; 34% in 2012, which marked economic recovery and stability, and 31.5% in 2022, marked by the outbreak of diseases. The urban expansion rate of Freetown from 1988 – 2022 indicated a higher rate between 2002 and 2012 at 1.3% per annum for a population under a million but decline between 2012 and 2022 at a rate of 0.3%, indicating a slower expansion despite population growth, which aligns with [19], suggesting that urban land development lags behind population and GDP per capita growth in cities with more than one million inhabitants.The study found a significant association between urban growth and urban expansion, with a correlation of 96.01%. In other words, the development of Freetown is a factor of urban growth, as opposed to [20] assertion that urban expansion might occur without a significant rise in population and activities due to people seeking a different lifestyle in industrialized countries. Therefore, urban expansion in developing countries is driven largely by urban growth and not necessarily by people’s lifestyle, the development of large shopping centers with their associated parking spaces, and wide road networks, as [20] claims.
5. Conclusions
It can be established that Freetown’s urban expansion is a function of urban growth, indicating that the urban expansion of developing nations is tied to population growth. Freetown’s expansion pattern is more rapid during stable or post-difficult economic periods and slower during difficult times, such as the civil war and disease outbreaks. Freetown’s future urban expansion is set to lag behind its urban growth, suggesting that the city will soon become densely populated.
References
| [1] | United Nations Department of Economic and Social Affairs. (2011). Population distribution, urbanization, internal migration, and development: An international perspective. United Nations. Retrieved on March 20th, 2025, from https://www.un.org/en/development/desa/populationn/publiccations/pdf/policy/ Compendium/Volume%20I/l_ Chapter%207.pdf. |
| [2] | Montgomery, M. R., Stren, R., Cohen, B., & Reed, H. E. (Eds). (2004). Cities transformed: Demographic change and its implications in the developing world. The National Academies Press. https://doi.org/10.17226/10693. |
| [3] | Amin, A. & Fazal S. (2012). Quantification of Land Transformation using Remote Sensing and GIS techniques. American Journal of Geographic Information System, 1(2), pp. 17-28. |
| [4] | United Nations Human Settlements Programme (UN-Habitat). (2008). The state of African cities 2008: A framework for addressing urban challenges in Africa. Nairobi: UN-Habitat. Retrieved on January 16, 2025, from https://unhabitat.org/the-state-of-the-african-cities-report-2008. |
| [5] | Oloukoi, J., Oyinloye, R.O., & Yadjemi, H. (2014). Geospatial analysis of urban sprawl in Ile-Ife city, Nigeria. South African Journal of Geomatics, 3, 128-144. |
| [6] | Angel, S., Sheppard, S. C., & Civco, D. L. (2005, September). The Dynamics of Global Urban Expansion. ALNAP; Transport and Urban Development. The World Bank. https://alnap.org/help-library/resources/the-dynamics-of-global-urban-expansion/. |
| [7] | Frediani, A. A. (2021). Freetown: City scoping study. African Cities Research Consortium. Retrieved February 26, 2025 from https://www.african-cities.org/wp-content/uploads/2021/12/AC RC_Freetown_City-Scoping-Study.pdf. |
| [8] | Megha, M. (2019). Freetown urban sector review: Options for growth and resilience. World Bank Group. Retrieved 11th November 2024 from https://documents.worldbank.org/en/publication/documents- reports/documentdetail/994221549486063300/freetown-urban-sector-review-options-for-growth-and- resilience. |
| [9] | Jones, A. (2020, July 6). Colonial expansion from Freetown to Sierra Leone, 1800–1900. Medium. Retrieved March 2nd, 2025 from https://alex-jones.medium.com/how-did-colonisation-spread-from-freetowns-coast-to- all-of-sierra-leone-85ed3698a30d. |
| [10] | Alie, J. A. D (1990). A new history of Sierra Leone. London and Basingstoke: Macmillan, pp. x, 300. |
| [11] | World Bank. (2018). Reviving urban development: The importance of Freetown for the national economy (Sierra Leone Economic Update, Edition No. 1). World Bank Group. Retrieved on October 9, 2025 from https://documents.worldbank.org/en/publication/documents-reports/documentdetail/ 304841528737912303/reviving-urban-development-the-importance-of-freetown-for-the-nation al-economy. |
| [12] | Mansaray, L. R., Huang, J. & Kamara, A. A. (2016). Mapping deforestation and urban expansion in Freetown, Sierra Leone, from pre- to post-war economic recovery. Environ Monit Assess, 188(8): 470. https://doi.org/10.1007/s10661-016-5469-y. |
| [13] | Forkuor G. & Cofie O. (2011). Dynamics of land-use and landcover change in Freetown, Sierra Leone and its effects on urban and peri-urban agriculture – a remote sensing approach. International Journal of Remote Sensing, 32(4), pp. 1017-1037. https://doi.org/10.1080/01431160903505302. |
| [14] | Congalton, R. G., & Green, K. (2008). Assessing the accuracy of remotely sensed data: Principles and practices (2nd ed.). CRC Press. https://doi.org/10.1201/9781420055139. |
| [15] | Opeyemi, Z. A. (2008). Monitoring the growth of settlements in Ilorin, Nigeria: A GIS and remote sensing approach. The International Archives of the Photogrammetry, Remote Sensing and Spatial Information Sciences, 37, 225–232. |
| [16] | Islami, F. A., Tarigan, S. D., Wahjunie, E. D., & Dasanto, B. D. (2022). Accuracy assessment of land-use change analysis using Google Earth in Sadar Watershed, Mojokerto Regency. IOP Conference Series: Earth and Environmental Science, 950(1), 012091. https://doi.org/10.1088/1755-1315/950/1/012091. |
| [17] | Cline-Cole, R. A. (1987). The socio-ecology of firewood and charcoal on the Freetown peninsula. Africa: Journal of the International African Institute, 57(4), 457–497. https://doi.Org /10.2307/1159894. |
| [18] | Dudley, J. P., & Woodford, M. H. (2002). Bioweapons, biodiversity, and ecocide: Potential effects of biological weapons on biological diversity. BioScience, 52(7), 583–592. https://academic.oup.com/bioscience/article/52/7/583/247983. |
| [19] | Mahtta, R., Fragkias, M., Güneralp, B., Mahendra, A., Reba, M., Wentz, E. A., & Seto, K. C. (2022). Urban land expansion: The role of population and economic growth for 300+ cities. npj Urban Sustainability, 2(1), Article 5. https://doi.org/10.1038/s42949-022-00048-y. |
| [20] | Bryant, C. (2008). The impact of urbanization on rural land use. In V. R. Squires (Ed.), The role of food, agriculture, forestry and fisheries in human nutrition (Vol. 3, pp. 60–74). EOLSS Publishers. |
| [21] | McCarthy, J. J., Canziani, O. F., Leary, N. A., Dokken, D. J., & White, K. S. (Eds.). (2001). Climate change 2001: Impacts, adaptation, and vulnerability. Contribution of Working Group II to the Third Assessment Report of the Intergovernmental Panel on Climate Change. Cambridge University Press. |

 Abstract
 Reference
 Full-Text PDF
 Full-text HTML