Ugwu Okwudili J.1, Emmanuel Udo A.1, Uzoeshi Samson1, Benison Yason2, Geoffrey Ogbonna Nwodo3, Anthony Okoroji1
1Department of Surveying and Geoinformatics, Federal University of Technology, Owerri, Nigeria
2Department of Geography, Gombe State University, Gombe, Nigeria
3Department of Geomatics, University of Benin, Nigeria
Correspondence to: Ugwu Okwudili J., Department of Surveying and Geoinformatics, Federal University of Technology, Owerri, Nigeria.
| Email: |  |
Copyright © 2025 The Author(s). Published by Scientific & Academic Publishing.
This work is licensed under the Creative Commons Attribution International License (CC BY).
http://creativecommons.org/licenses/by/4.0/

Abstract
This study used machine learning and geospatial data analysis to evaluate Lagos State, Nigeria's flood risk and urban resilience. The Regularized Random Forest (RRF) method identified flood-prone areas by examining key factors such as elevation, slope, flood frequency, topographic wetness index (TWI), height above drainage, flood event data, land-use changes, and rainfall patterns. The analysis reveals that low-lying regions, areas with significant impervious surfaces, and locations experiencing heavy rainfall are particularly susceptible to flooding. Between 2000 and 2023, rapid urban expansion—marked by an increase in built-up areas from 14.89% to 24.93%—has significantly heightened flood risks. This urbanization has led to reduced natural water absorption, causing excessive surface runoff and making certain areas more susceptible to flooding. Simultaneously, rainfall patterns have become more erratic and intense, with the highest recorded monthly rainfall reaching 174.91 mm in 2019. These combined factors—climate variability and uncontrolled urban growth—pose serious challenges to flood management and urban planning efforts in Lagos State. The study highlights the complex relationship between urbanization, land-use changes, and climate shifts in exacerbating flood risks. It emphasizes the urgent need for adaptive and integrated flood mitigation strategies. To ensure long-term resilience and minimize flood impacts, the study recommends a combination of structural and non-structural approaches. Structural measures include constructing and maintaining levees, floodwalls, stormwater management systems, and dams to regulate water flow and mitigate flooding. Non-structural strategies involve strategic land-use planning, disaster preparedness training for communities, wetland restoration to enhance natural water absorption, and investment in advanced flood prediction and management research to improve early warning systems and response mechanisms.
Keywords:
Flood, Machine Learning, Flood Risk, GIS, SRTM
Cite this paper: Ugwu Okwudili J., Emmanuel Udo A., Uzoeshi Samson, Benison Yason, Geoffrey Ogbonna Nwodo, Anthony Okoroji, Flood Susceptibility Mapping and Urban Resilience Assessment in Lagos State Using a Machine Learning Approach, American Journal of Geographic Information System, Vol. 14 No. 1, 2025, pp. 1-13. doi: 10.5923/j.ajgis.20251401.01.
1. Introduction
Flooding is a significant threat to the environment and the economy in Lagos, Nigeria. This is due to lousy drainage systems, fast city growth, and climate changes. As one of the fastest-growing cities in Africa, Lagos faces heavy rainfall and rising sea levels that can overwhelm the city's drainage and cause severe flooding. These floods interrupt travel, damage homes, and force many people to leave their areas each year, causing economic losses that reach millions of dollars. Moreover, the growth of informal settlements on flood-prone land and poor waste management worsens waterway blockages, increasing flood risks [20,22]. The health effects of flooding in Lagos go beyond just temporary displacement and lead to long-lasting health issues. Diseases spread by water, like cholera, typhoid, and malaria, become more common in flooded areas, as standing water creates ideal conditions for mosquitoes to breed. When sewage systems overflow into city areas, this heightens the risk of exposure to dangerous germs, especially in crowded and low-income neighbourhoods. Additionally, flooding makes it harder for people to access crucial services such as healthcare, education, and clean drinking water, increasing socio-economic inequalities and making vulnerable groups even more at risk (International Information and Engineering Technology Association [12,4]. Even with ongoing efforts, there are still many research gaps around urban flooding in Lagos. There is a shortage of complete, real-time flood prediction models considering climate changes, city development trends, and economic factors. Furthermore, the local ability to analyse geospatial data and implement early warning systems is limited, hindering effective flood management. To truly mitigate flooding, more detailed studies are needed on community resilience strategies and the socio-economic consequences of frequent floods [1]. Addressing these gaps through interdisciplinary research and new technologies like machine learning could significantly improve Lagos's flood management and resilience approaches.The main goals of this study are to assess flood risk in Lagos State using machine learning methods (Regularized Random Forest) and geospatial data analysis. It aims to examine how urban growth, land-use changes, and climate change have influenced flood risk over time, highlighting key patterns and vulnerabilities. Additionally, the study seeks to develop effective strategies for enhancing urban resilience, improving flood management, and reducing disaster risks in rapidly expanding cities like Lagos, with a focus on integrating data-driven approaches and sustainable urban planning solutions.
2. Study Area
Lagos State, in southwestern Nigeria, is a very crowded city with over 20 million people, making it one of the biggest cities in Africa. Lagos is located in a flat coastal area next to the Atlantic Ocean and has many lagoons, creeks, and rivers (Figure 1). Because of this location, the city often faces flooding, especially during the rainy season, from April to October [18]. The city's fast growth, mixed with poor drainage systems and many residents, worsens the flooding risks in homes and businesses. Additionally, changes in climate in recent years, like more heavy and frequent rain, have made flooding worse in the area, making it important to analyse flood risks for urban planning and managing disasters [20,19]. The state is about 3,577 square kilometres big and is split into 20 Local Government Areas (LGAs). These LGAs experience flooding differently based on land use, height above sea level, and closeness to water. Coastal LGAs like Eti-Osa, Lagos Island, and Amuwo-Odofin are very prone to storms and flooding from the ocean, while inland LGAs face flooding from rivers and poor drainage [17,4]. Knowing where flooding is likely to happen is key to creating effective flood prevention plans. In this study, the flood susceptibility assessment uses geospatial data and machine learning methods to understand how urban growth, land use changes, and climate factors affect flood risks in different LGAs.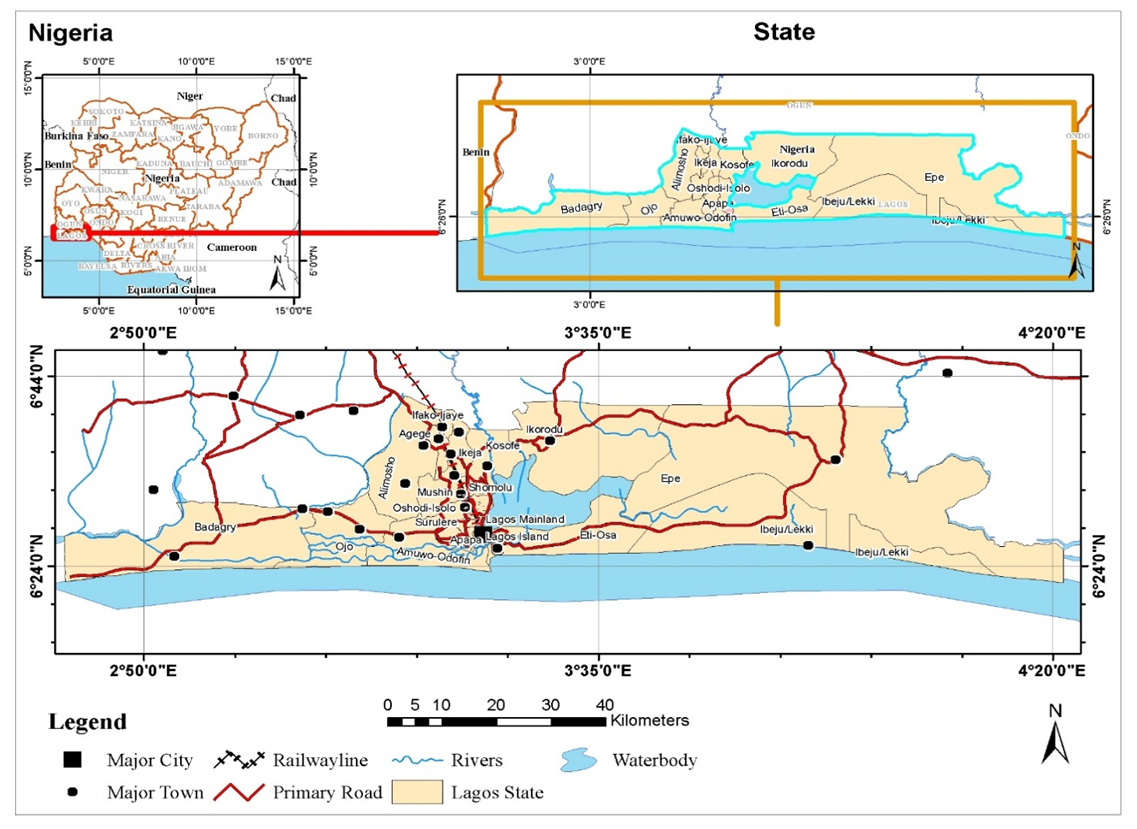 | Figure 1. Study Area map – Lagos State |
3. Method of Data Analysis
This research uses geospatial data and machine learning methods to create a flood risk model for Lagos State, focusing on the Regularized Random Forest (RRF) technique. Data sources consist of Digital Elevation Models (DEMs) from the Shuttle Radar Topography Mission (SRTM) [10] to assess height and slope, flow accumulation, Topographic Wetness Index (TWI), and multi-temporal Landsat satellite images for mapping land-use and land-cover (LULC) [2]. Climate data, especially rainfall records, come from the Climate Hazards Group InfraRed Precipitation with Station data (CHIRPS) for trend investigations (Funk, 2015), Height above drainage (HAND) [6], and Flood Frequency [13]. Flood event data from the Dartmouth Flood Observatory is used to check the model by contrasting predicted flood-prone areas with past occurrences [4]. This combination of datasets aids in understanding flood risk factors in Lagos, such as terrain, urban growth, and weather changes. The RRF technique was selected for its effectiveness in managing complex and non-linear connections between predictors and flood events. It builds upon the traditional Random Forest method by adding regularisation techniques, which decrease overfitting risk and enhance generalisation. Significant predictors in the model consist of elevation, slope, drainage density, rainfall intensity, flow accumulation, Height above drainage (HAND), Topographic Wetness Index (TWI), flood frequency, and LULC shifts. Change detection analysis is performed with ArcGIS to support the machine learning method to observe urban growth over time [19]. The effectiveness of the flood vulnerability model is confirmed using field studies and historical flood records. This method thoroughly evaluates flood risks, crucial for urban resilience planning in fast-growing cities like Lagos [1,17]. See Figure 2 for the methodological flow chart.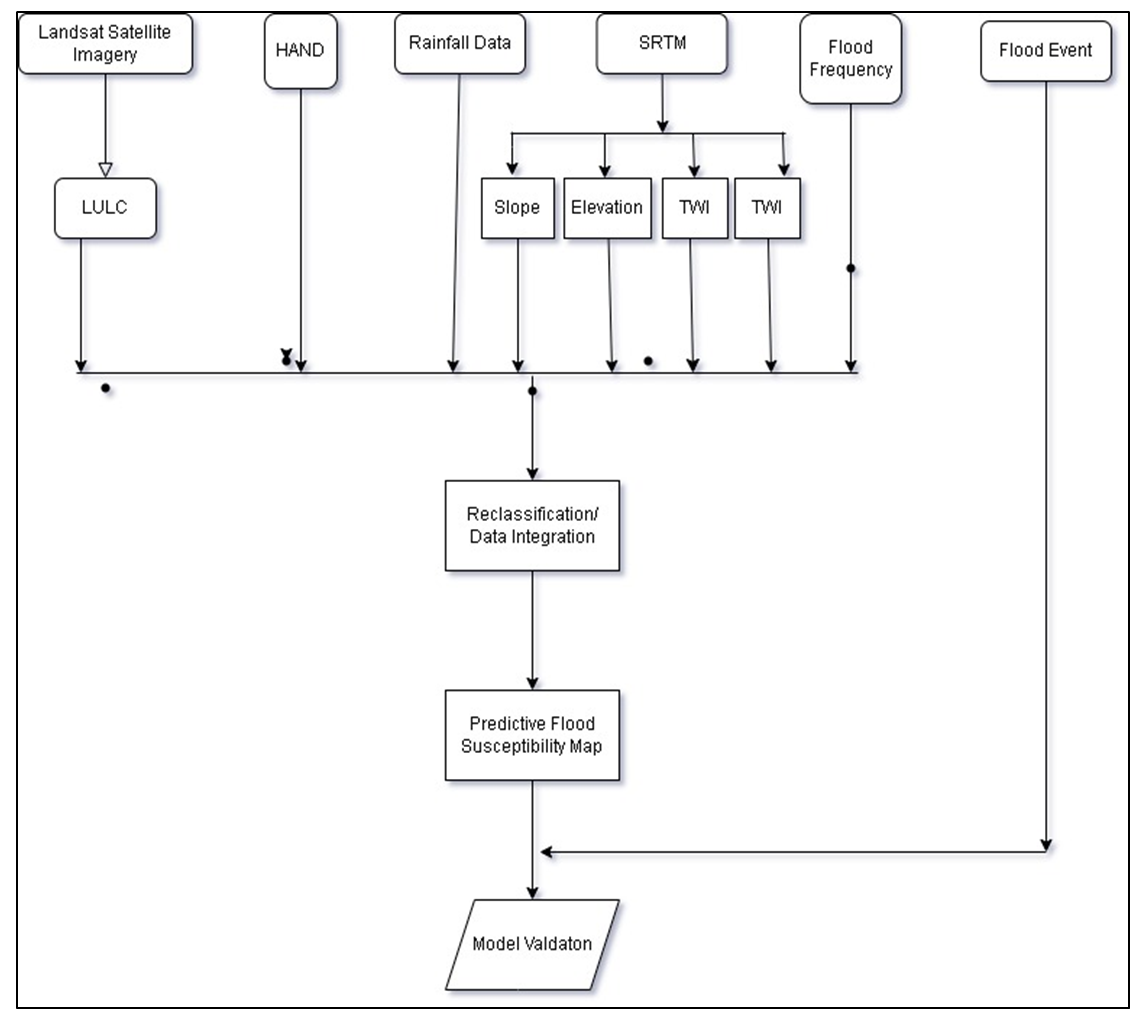 | Figure 2. Methodology Flow Chart |
4. Result and Discussions
4.1. Flood Susceptibility in Lagos State
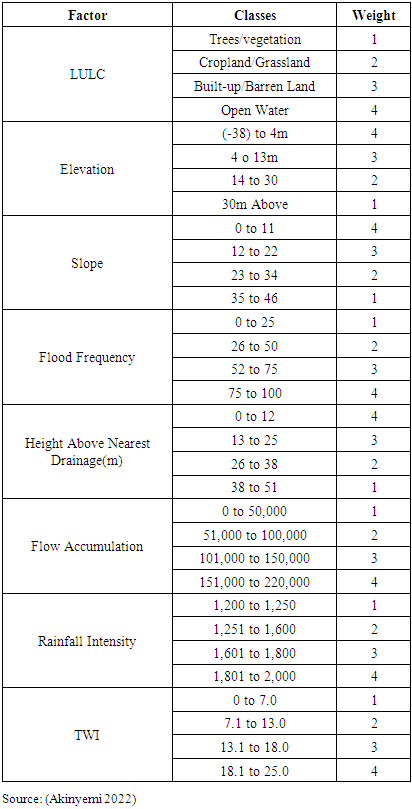
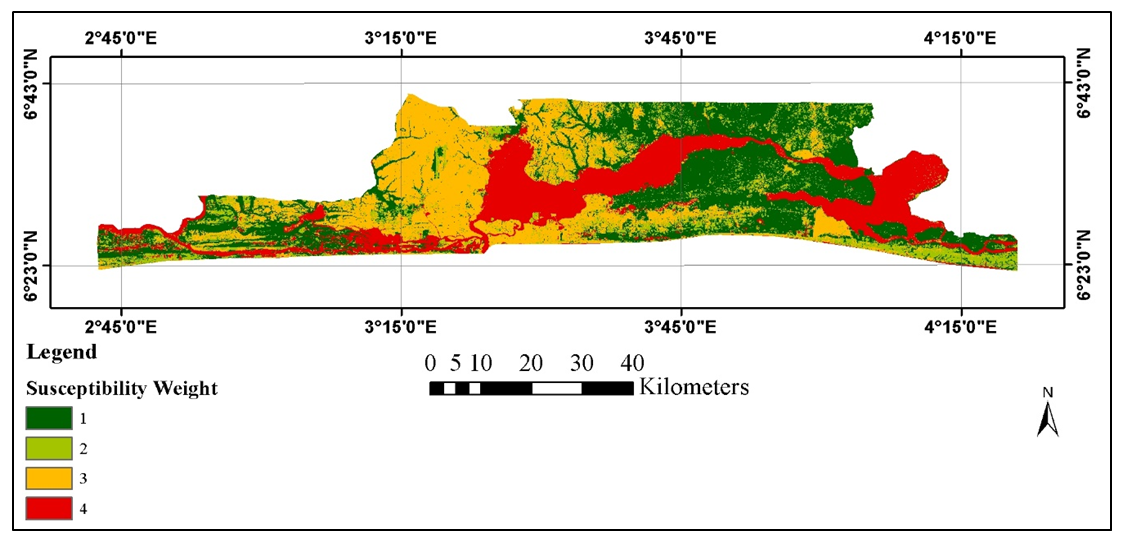
The analysis of flood risk in Lagos State, found in Table 1 and Figures 3 and 4, shows that many environmental and geographic factors impact the city's flood risk. This study divides flood susceptibility into categories using land use and land cover (LULC), elevation, slope, rainfall intensity, flood frequency, height above drainage and flow accumulation. Each factor gets a weight that shows how much it adds to the flood risk. For instance, built-up areas and barren land (weight 3) are at higher risk because their hard surfaces do not allow water to soak in, while trees and vegetation (weight 1) are less likely to flood because they can absorb water. Areas with elevations between -38 and 4 meters get the highest weight (4) since they are more vulnerable to water buildup, particularly in coastal and low areas [1,19]. Additionally, changes in land use and environmental harm point to the complicated link between urban growth and flood risk, emphasising the need for comprehensive measures to enhance the area's ecological quality [4].Table 1. Flood factors
 |
| |
|
 | Figure 3. Flood Factors/Flood Susceptibility Factors |
 | Figure 4. Factors Weights |
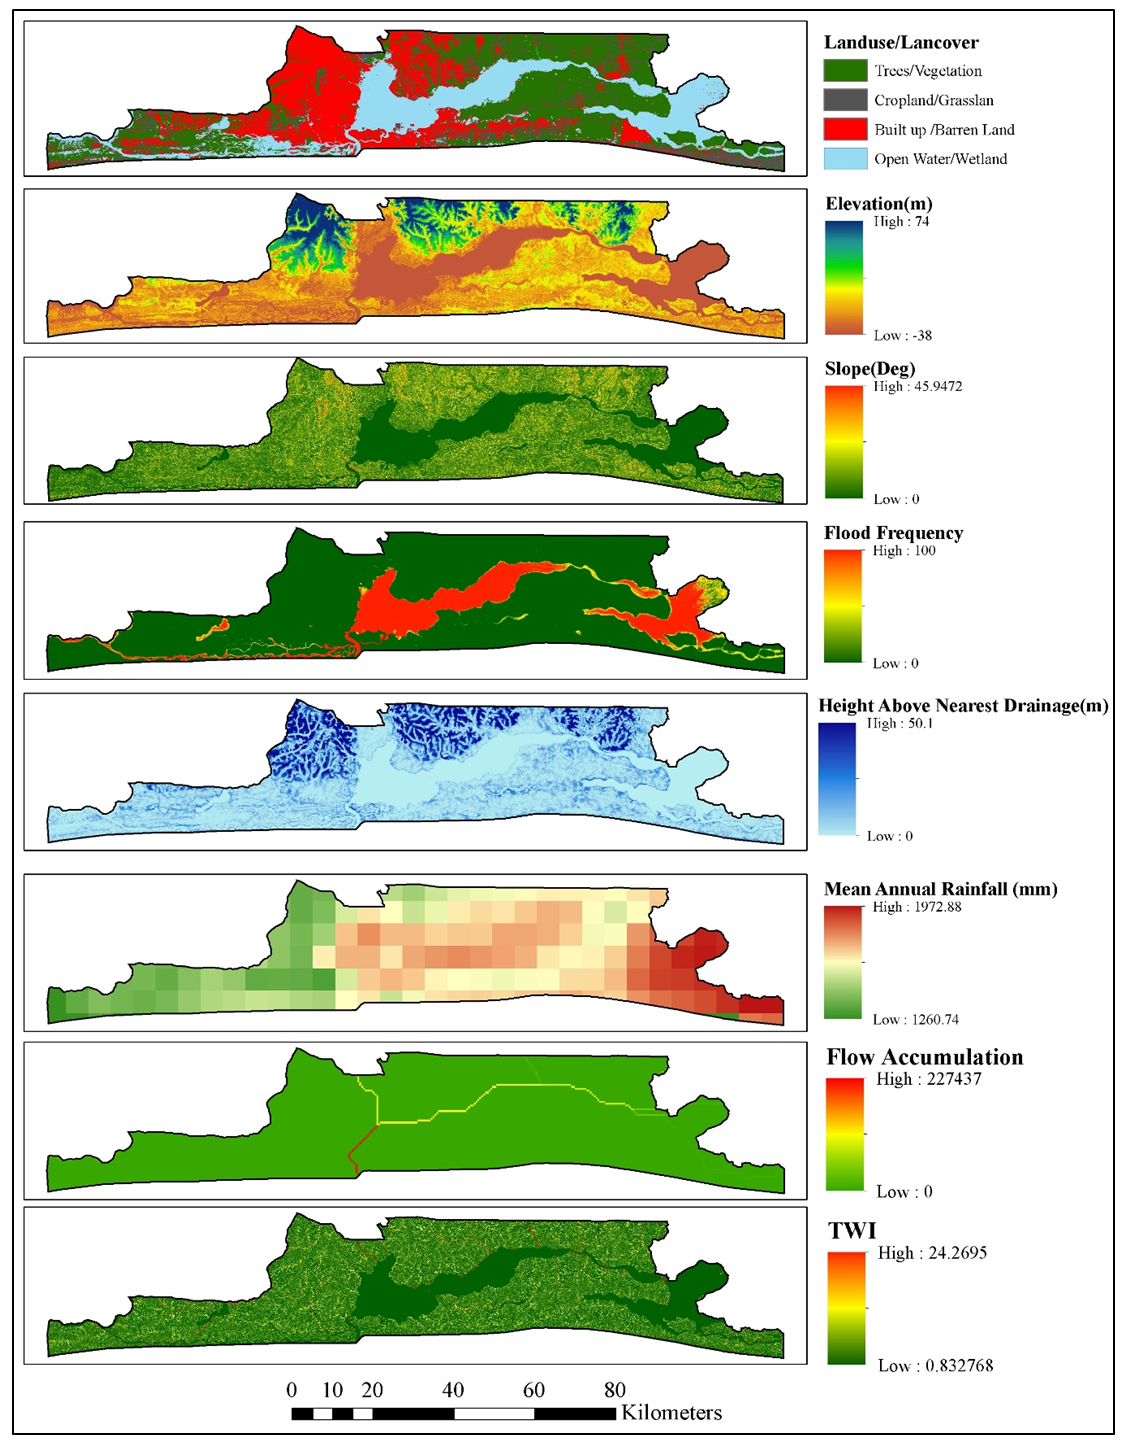
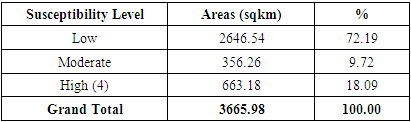
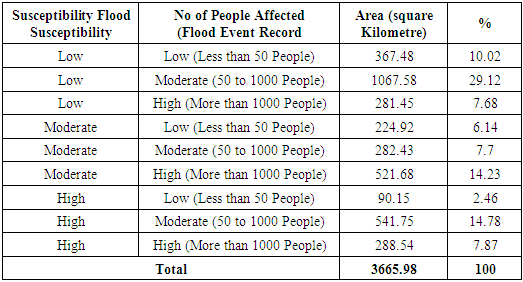
Recent studies have demonstrated that urban expansion and land-use changes play a crucial role in increasing flood risks, emphasizing the need for comprehensive flood risk assessments that consider multiple contributing factors [19]. Additionally, incorporating ecological variables, such as vegetation cover and soil permeability, into flood susceptibility models can enhance their accuracy and reliability, ultimately supporting more effective decision-making for flood-prone regions [4].Flood risk models, which typically analyse various land-use and land-cover (LULC) types, are essential tools for understanding flooding patterns and informing urban planning strategies [19]. Assigning appropriate weights to these LULC categories—such as residential areas, wetlands, and impervious surfaces—is critical for accurately modelling their respective impacts on flood occurrences and improving predictive capabilities [14]. Furthermore, integrating remote sensing and geospatial analysis can refine these models, enabling proactive flood management and adaptive urban planning solutions. Elevation is important for flooding risk because land rises or falls can change how water moves and drains in cities [19]. Lower areas are often at greater risk of flooding, a situation made worse by more buildings and climate shifts [4]. This connection shows why it is critical to use elevation information when looking at flood risks to create effective relief plans [19]. The patterns seen in different elevation levels relate to how likely flooding issues could happen, highlighting the need for careful study in these elevation levels [4].Table 2 shows that the total area in Lagos at risk of flooding is 3,665.98 square kilometres, with specific zones more prone to flooding. Areas with a susceptibility weight of 4 cover 663.18 square kilometres, indicating a significant number of high-risk zones, primarily found in low-lying regions, poorly drained areas, and locations where water tends to accumulate. The Topographic Wetness Index (TWI) supports this finding, revealing that areas with TWI scores between 18.1 and 25.0 face the highest flood risk due to their terrain and hydrological characteristics [17,19]. This data is visually represented in Figure 5, showing the spatial distribution of flood-prone zones across Lagos, particularly emphasizing the heightened vulnerability in coastal and riverine areas. Utilizing geospatial analysis and machine learning has enabled the creation of an accurate and detailed flood risk map, which serves as a crucial tool for urban planning, infrastructure development, and disaster risk reduction efforts [17,4].Table 2. Flood Susceptible Areas
 |
| |
|
 | Figure 5. Flood Susceptibility map |
Additionally, understanding flood risk levels in urban areas is increasingly critical as cities continue to experience heightened flood hazards due to rapid land-use changes, urban expansion, and climate variability. Comprehensive flood risk assessments are essential for identifying the most vulnerable locations, allowing for targeted interventions that mitigate flood impacts and enhance community resilience [19]. Regions identified as highly susceptible may require substantial infrastructure upgrades, improved drainage systems, and the implementation of sustainable land management practices to reduce flood exposure and long-term risks [4]. This proactive approach is vital in minimizing flood-related damages, safeguarding lives and properties, and ensuring sustainable urban development in flood-prone regions.
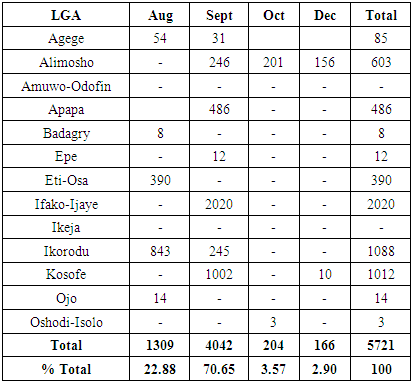
4.2. Flood Events in Lagos State
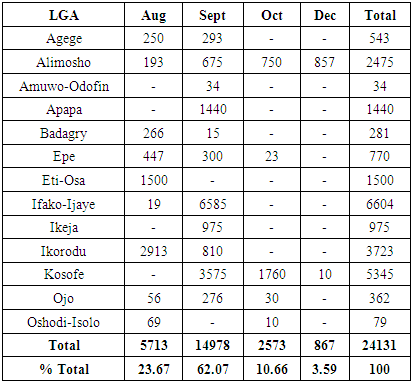
Tables 3, 4, and Figure 6 analyse how floods in Lagos State affect humans, detailing the number of people harmed and displaced in different Local Government Areas (LGAs) as reported in 2022. The data shows notable differences in space and time, with September being the most impactful month, responsible for 62% of people affected and 71% of displaced persons. LGAs like Ifako-Ijaye, Kosofe, and Ikorodu report the most affected and displaced individuals, likely because of their low-lying areas, poor drainage systems, and high population density [19]. Coastal LGAs, such as Eti-Osa and Apapa, also display significant impacts, highlighting issues with tidal flooding and storm surges [19]. On the other hand, LGAs like Amuwo-Odofin and Ikeja show low displacement figures, which might suggest better flood management or milder flooding. An important finding is the gap between those affected and those displaced. While more than 24,000 people were impacted, only 5,721 were forced to leave, indicating that many faced disruptions without abandoning their homes. This points to differing flood severities and coping abilities among LGAs. For instance, in Eti-Osa, 390 out of 1,500 affected were displaced, suggesting better resistance or flood management systems. In contrast, Ifako-Ijaye and Kosofe have higher displacement percentages, reflecting the severity of flooding and possible shortcomings in preparedness and housing quality. These patterns highlight the necessity for flood risk reduction strategies tailored to the specific weaknesses of each LGA [4].Table 3. People Affected by Flood Events across Lagos State
 |
| |
|
Table 4. People Displaced by Flood Event across Lagos State
 |
| |
|
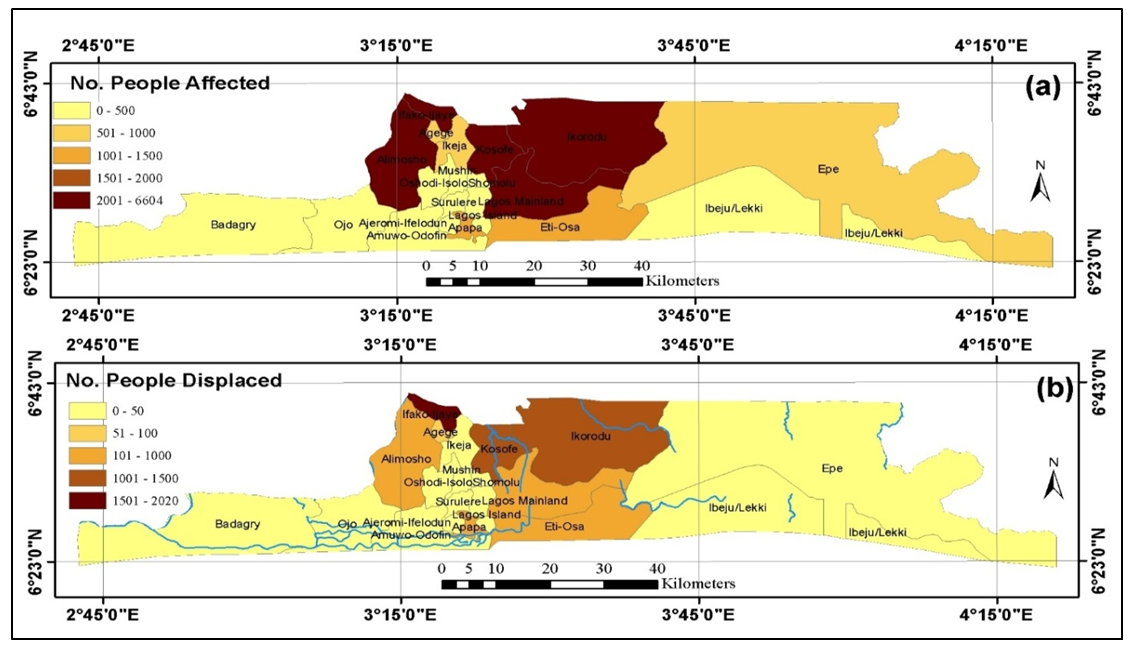 | Figure 6. (a) No. Of People Affected by Flood, (b) No. Of People Displaced by Flood Events by LGA |
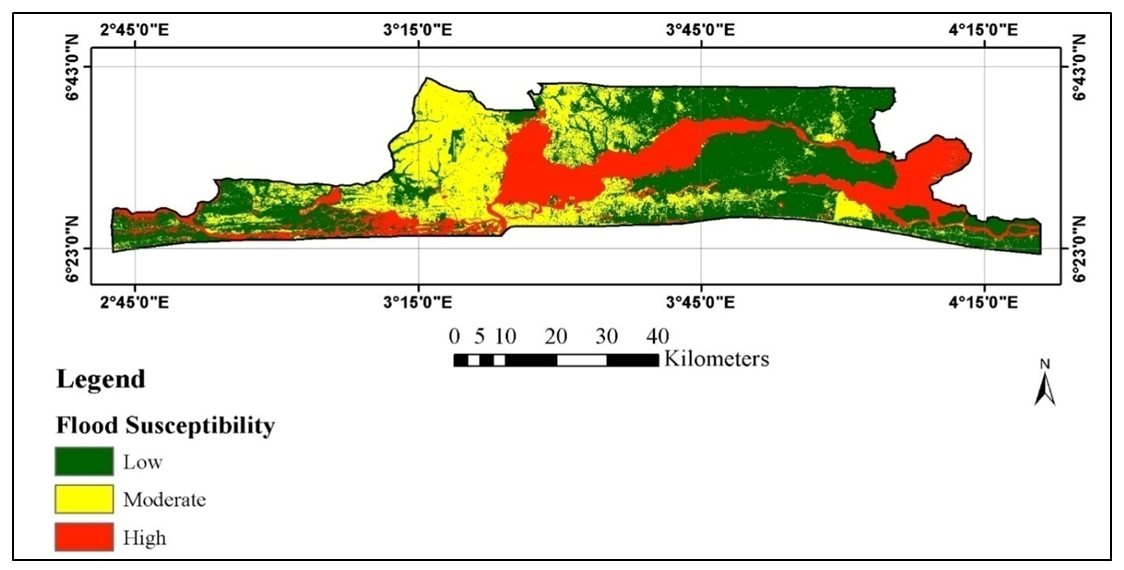
4.3. Validation of Flood Susceptibility Model through Overlay with Recorded Flood Event
The checking of the flood susceptibility model, shown by putting together flood susceptibility maps and records of flood events, gives information about how susceptibility levels relate to the affected population and the layout of flood-risk areas [14]. This approach confirms the model's predictive accuracy and highlights critical factors contributing to flood vulnerability, such as proximity to water bodies and rapid urban development [9]. Understanding these dynamics is essential for effective flood risk management and the development of strategies to minimize potential damages.Table 5. Overlay Result of Flood Susceptivity Map and Flood Event Record
 |
| |
|
Low Susceptibility AreasLow-susceptibility zones comprise 46.82% of the total area, with different levels of population effects. Most of these zones (29.12%) had moderate population effects (50 to 1,000 people), and 7.68% saw high impacts, affecting over 1,000 people. This shows that even areas seen as low risk can face serious flood-related problems, likely due to severe weather or weak infrastructure [4]. Furthermore, finding and managing low-susceptibility areas is important in city planning, as these areas might still be impacted by land use changes that could change their vulnerability in the future [19].Moderate Susceptibility AreasModerate susceptibility zones comprise 28.07% of the area, showing a more even impact profile. About 14.23% of these zones face high population impacts, indicating the weaknesses in these regions [14]. Even though they are considered moderate risk, the significant impact on populations implies that factors like urban density, poor drainage systems, and lack of preparedness play a role in these effects [19].High Susceptibility AreasHigh-risk areas make up 25.11% of the total land. Notably, 7.87% of these areas face strong population effects, while 14.78% show moderate effects. These spots are critical for flood-related problems, especially in places with significant populations [19]. The smaller land size with high impact highlights the urgent need for focused flood prevention plans in these places. Combined efforts are needed for future research to enhance ecological quality and restore environmental health as urban growth worsens flood risk [4]. The analysis confirms the flood risk model by showing a clear link between the risk categories and actual flood occurrences (Figure 7). The connection between high-risk areas and more significant population effects supports the model's predictive ability.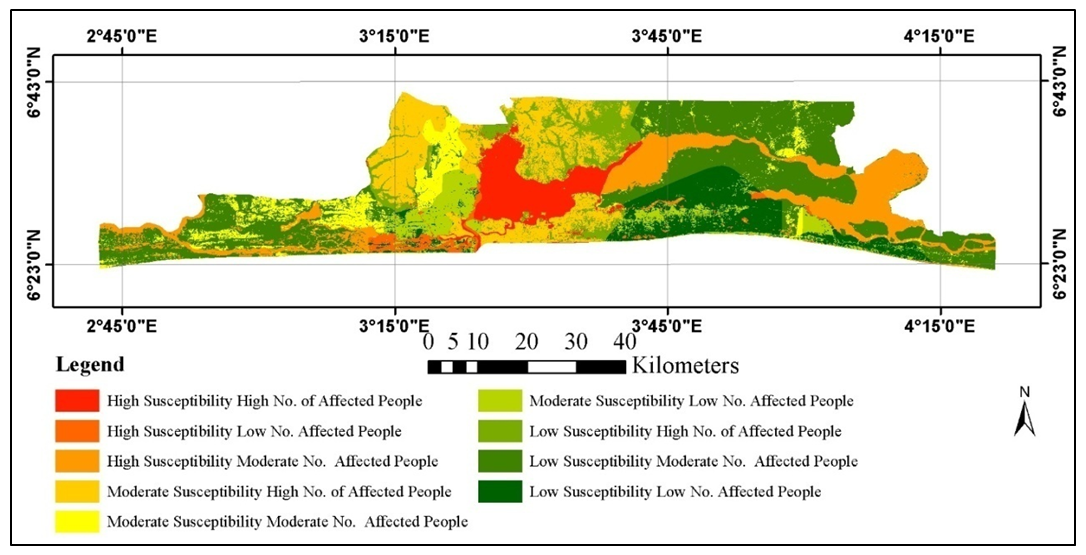 | Figure 7. Overlay of Flood Events (People Affected) and Predicted Flood Susceptibility |
4.4. Urban Expansion and Climate Variability in the Study Area
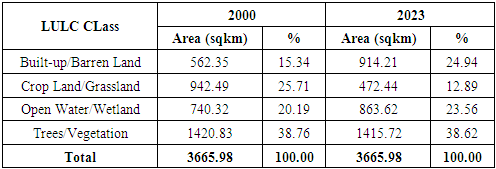
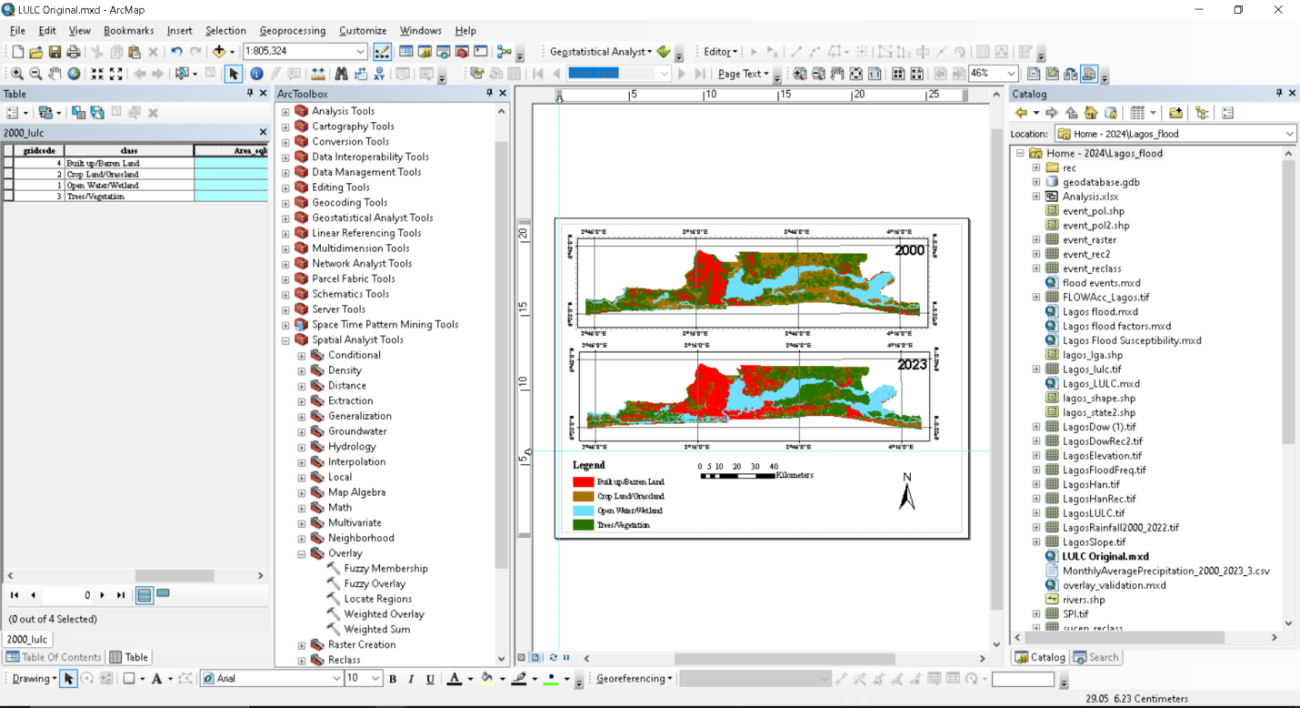
The analysis of land-use and land cover (LULC) changes from 2000 to 2023 reveals significant urban expansion in Lagos State. During this period, built-up areas increased from 517.51 km² (14.89%) in 2000 to 866.37 km² (24.93%) in 2023 (Table 6 and Figure 8). This rapid urbanization is driven by population growth, improved infrastructure, and industrial development, leading to a decline in cropland and grassland, which shrank from 897.65 km² (25.83%) in 2000 to 424.60 km² (12.22%) in 2023. Meanwhile, open water and wetland areas expanded from 685.48 km² to 815.80 km², indicating increased water coverage, likely influenced by both natural factors and human interventions such as reservoir construction and land reclamation [22].Figure 6 illustrates these transformations, showing the most pronounced urban sprawl in coastal and mainland areas, which has resulted in a rise in impervious surfaces and heightened flood risks [1,14]. Additionally, the slight reduction in vegetation cover highlights the strain of urbanization on natural ecosystems. This trend has serious ecological implications, including reduced groundwater recharge, increased surface runoff, and elevated flood susceptibility, further exacerbating environmental and infrastructural challenges [14].
4.4.1. Urban Expansion in the Study Area
Table 6. LULC Changes in the Study Area
 |
| |
|
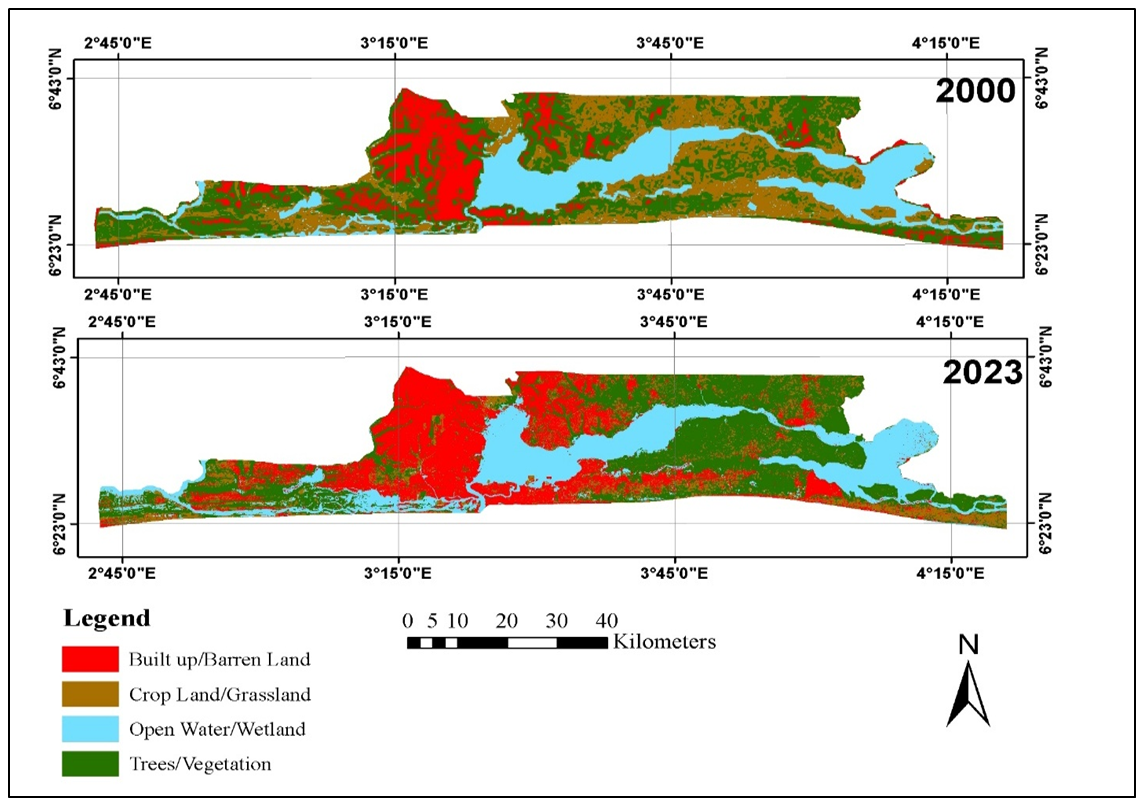 | Figure 8. Urban Expansion and Land use Changes Year 2000 and 2023 |
4.5. Climate Variability over Time
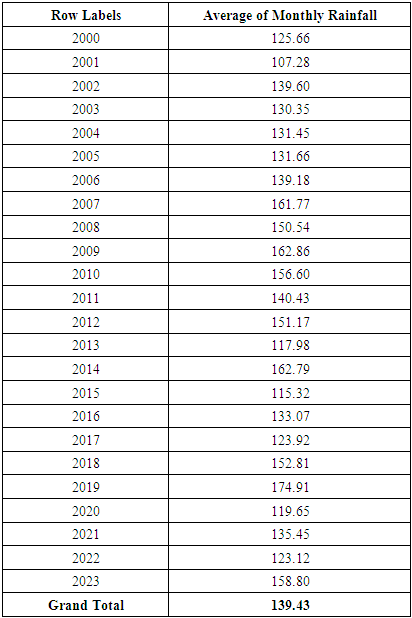
The changes in rainfall patterns in Lagos from 2000 to 2024 significantly affect the likelihood of floods. Table 7 and Figure 9, 10 show that the average monthly rainfall varied from a low of 107.28 mm in 2001 to a high of 174.91 mm in 2019. These inconsistent and intense rainfall amounts lead to more frequent and worse flooding. Figures 8 and 9 show the monthly and yearly rainfall changes, suggesting a trend of higher rainfall extremes in the latest years. These changes in rainfall patterns put pressure on the city's flood management systems, often causing urban flooding and disruption [17,2,14].Table 7. Average Monthly Rainfall 2000 to 2023
 |
| |
|
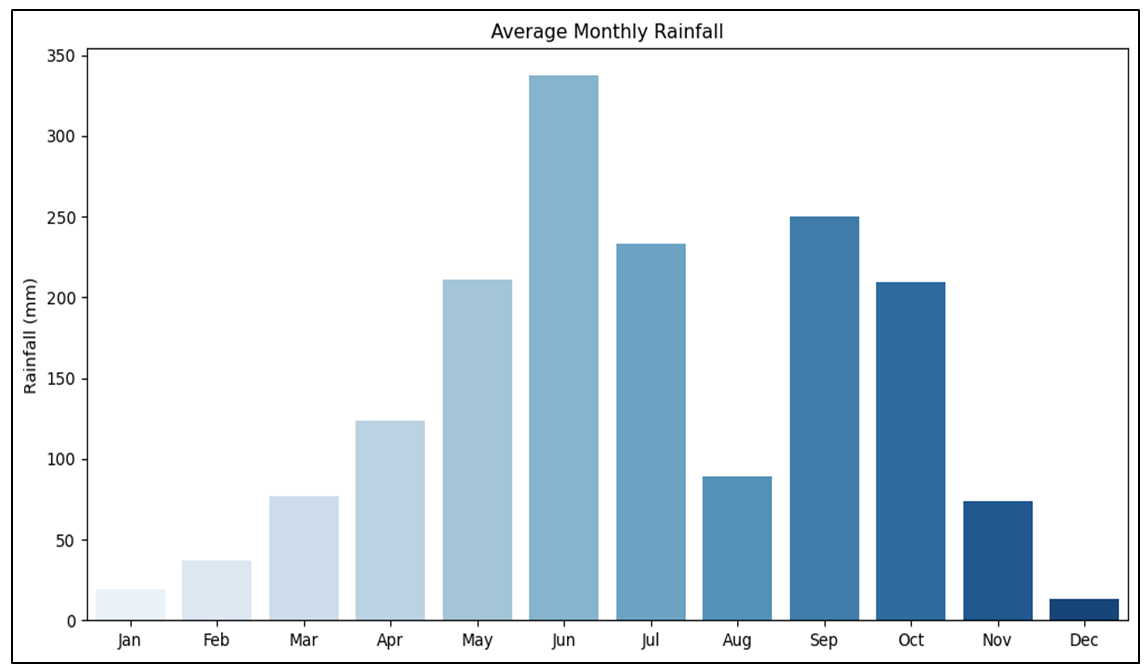 | Figure 9. Monthly Average Precipitation 2000 to 2024 |
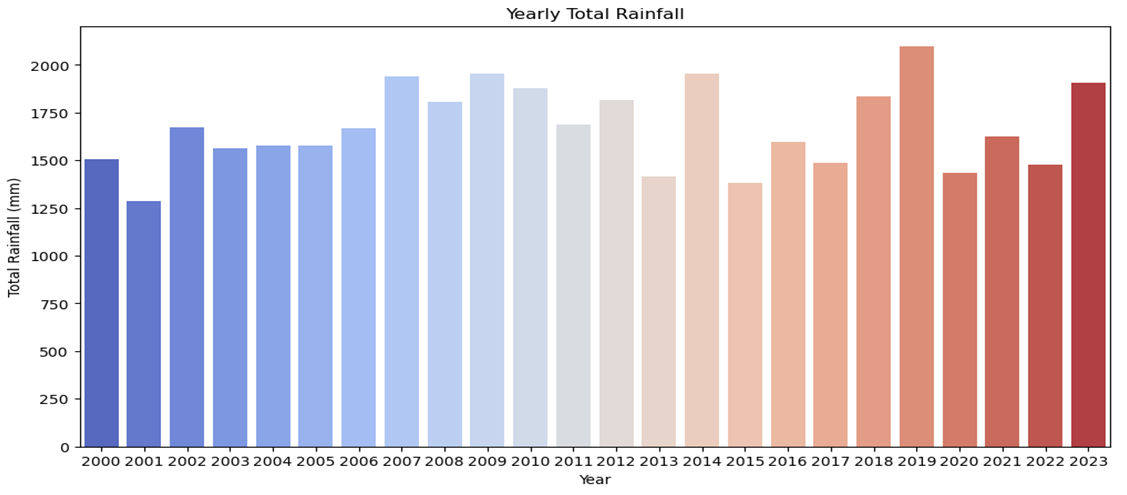 | Figure 10. Total Annual Rainfall Average 2000 to 2023 |
When heavy rainfall occurs, low-lying and densely populated areas face an increased risk of flooding. Climate change continues to alter rainfall patterns, causing more frequent and intense storms, which, combined with rapid urban expansion, significantly heighten flood hazards. In many cases, extreme rainfall overwhelms existing drainage systems, leading to water accumulation in critical locations such as roads, residential areas, and commercial hubs. Poorly planned urbanization, with inadequate stormwater management and insufficient green spaces to absorb excess water, further exacerbates the situation.The flood risk model, which considers rainfall as a key factor, highlights that regions experiencing higher precipitation levels are more vulnerable to severe flooding events [13]; 'Springer Science and Business Media LLC', 2021). This correlation underscores the urgent need to enhance water management infrastructure, including improved drainage networks, flood control reservoirs, and sustainable urban planning strategies. Additionally, with alarming projections indicating worsening impacts on agriculture and water resources due to climate change, it is crucial to develop adaptive flood mitigation strategies that account for both current and future precipitation trends [9,7].
5. Flood Mitigation
Flood mitigation means methods and actions focused on lowering the damage and destruction caused by floods as much as possible. It covers various approaches, from physical infrastructure improvements to community planning and awareness (Boedi Tjahjono et al., 2024). Flood mitigation aims to protect human life, reduce economic losses, and maintain environmental health (Membele et al., 2022).Structural Mitigation Strategies1. Levees and Floodwalls: The Erosion Control, Flood and Coastal Zone Management of the Federal Ministry of Environment should start building levees and floodwalls. Levees are dirt mounds made next to rivers or flood areas to stop water from covering nearby land. Floodwalls do a similar thing but are usually made from concrete or other strong materials. While these structures provide good defence, they are imperfect and need regular upkeep to work well [16]. Regularly maintaining and checking levees and floodwalls is important to adjust to new flood patterns and climate change risks [23].2. Stormwater Management Systems: Cities often deal with stormwater runoff because of hard surfaces that do not allow water to soak in. Stormwater management systems like retention basins, permeable pavements, and green roofs help manage water flow and lessen flood risks in urban areas [23]. Including local knowledge when designing these systems can make them more effective and sustainable [14]. 3. Dams and Reservoirs: Dams can hold extra rainwater and let it out slowly, which helps reduce flooding downstream. Building big dams can significantly affect the environment and communities, so it is vital to carefully plan their design and use [15]. In flood management plans, balancing structural measures like dams with ecological concerns is essential for long-term flood resilience [14].Non-Structural Mitigation Strategies1. Land-Use Planning: The Lagos State Capital Development Authority (LSCDA) should be in charge of planning, managing, and overseeing the growth of infrastructure and housing in Lagos State. They need to use strategic land-use planning with zoning rules to stop building in areas that may flood. This method protects people and buildings from flooding risks and lowers potential damage [21,11].2. Disaster Preparedness and Response Training: The Nigerian National Environment Management Authority (NEMA) should teach people about flood dangers, how to respond, and where to evacuate. This is very important for reducing the effects of floods. Community training sessions can help individuals react quickly and lower stress during flood situations [11].3. Wetland Restoration: Fixing wetlands can be a natural defence against floods. Wetlands take in extra rain and slow down water movement, which lessens flood effects downstream. This ecological method also supports diverse species and enhances water quality [24,14].4. Investment in Research and Technology: More funding for studies on predicting floods and modelling them can help us better understand flood risks and respond. Policymakers should encourage teamwork among government groups, communities, and researchers to develop thorough flood management plans [14].
6. Conclusions
This research highlights the vital role of machine learning and geospatial analysis in assessing flood risk and urban resilience in Lagos State. The Regularized Random Forest (RRF) method effectively identified flood-prone areas, revealing that low-lying terrain, a high percentage of impervious surfaces, and increasing rainfall are key contributors to flood hazards [8]. The findings indicate that rapid urbanization—where built-up areas expanded from 14.89% in 2000 to 24.93% in 2023—has intensified flooding risks, particularly in coastal and low-lying regions [8]. Unpredictable and heavy rainfall patterns further complicate flood management, increasing both the frequency and severity of flood events in the city [8]. The validation of the flood risk model using overlay analysis confirms its accuracy and practical value in pinpointing high-risk zones, which is crucial for designing targeted mitigation strategies. To enhance urban resilience, this study underscores the urgent need for improved flood management measures, including the development of more efficient drainage systems, climate-adaptive urban planning, and stricter land-use policies [8]. The varying impacts of flooding across different Local Government Areas (LGAs) highlight the necessity of localized interventions, particularly in densely populated and highly vulnerable communities. Additionally, integrating community-driven resilience initiatives with advanced flood prediction and early warning systems can strengthen preparedness and adaptive capacity, ultimately reducing flood-related damages and disruptions [8].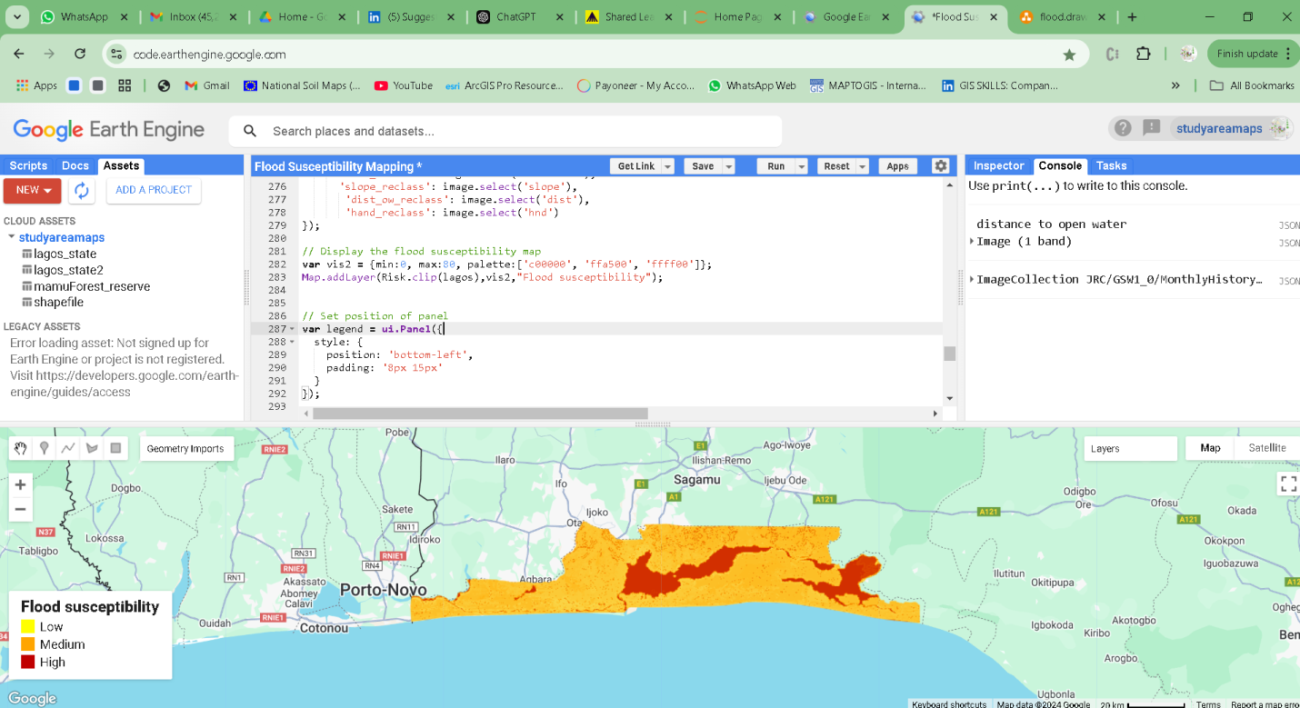 | Figure 11 |
 | Figure 12 |
References
| [1] | Akinyemi, F. O., Olowu, B. T., & Oke, R. A. (2022). "Spatial analysis of flood vulnerability in Lagos using GIS and remote sensing.". Vol 50, Issue 2. pp. 312-326. |
| [2] | Ayinla, Chando Abdulrazak (2021). "Ordered Logit regression model for predicting flood magnitude along Foma River Kwara Nigeria". https://core.ac.uk/download/524698073.pdf. |
| [3] | Beecham, Roger, Long, Jed A., Smith, Dianna, Wise, et al. (2023). "LIPIcs, Volume 277, GIScience 2023, Complete Volume". LIPIcs - Leibniz International Proceedings in Informatics. 12th International Conference on Geographic Information Science (GIScience, 2023). https://core.ac.uk/download/586077274.pdf. |
| [4] | Boedi Tjahjono, Eggy Arya Giofandi, Latief Mahir Rachman (2024). "Understanding the impact of land use change on urban flood susceptibility mapping assessment: A review". University of Brawijaya. https://core.ac.uk/download/614682264.pdf. |
| [5] | Chris Funk, Pete Peterson, Martin Landsfeld, Diego Pedreros, James Verdin, Shraddhanand Shukla, Gregory Husak, et al. (2015). "The climate hazards infrared precipitation with stations-a new environmental record for monitoring extremes (CHIPS)". https://doi.org/10.1038/sdata.2015.66. |
| [6] | D. Yamazaki, D. Ikeshima, J. Sosa, P.D. Bates, G.H. Allen, T.M. Pavelski (2019). "MERIT Hydro: A high-resolution global hydrography map based on latest topography datasets". pp. 5053–5073. https://doi.org/10.1029/2019WR024873. |
| [7] | Danioko, Sidy, Tapo, Allahsera Auguste, Tembine, Hamidou, Traore, et al. (2024). "Machine Intelligence in Africa: a survey". http://arxiv.org/abs/2402.02218. |
| [8] | Giofandi, Boedi Tjahjono, Latief Mahir Rachman (2024). "Understanding the impact of land use change on urban flood susceptibility mapping assessment: A review". https://www.semanticscholar.org/paper/2d2d9e0312d685d1bc12e1c6f5e91f0933c54dbf. |
| [9] | Ekeu-Wei, Iguniwari (2018). "Application of open-access and third-party geospatial technology for integrated flood risk management in data sparse regions of developing countries". Lancaster University. https://core.ac.uk/download/146457220.pdf. |
| [10] | Farr, T.G., Rosen, P.A., Caro, E., Crippen, et al. (2007). "The shuttle radar topography mission". Vol 45, Issue 2. pp. 2004. https://doi.org/10.1029/2005RG000183. |
| [11] | FEMA (2020). "Training and Education". FEMA. https://www.fema.gov. |
| [12] | International Information and Engineering Technology Association (IIETA) (2023). "Urban Drainage and Flood Risk Management in Nigeria: A Case Study of Lagos". https://www.iieta.org. |
| [13] | Jean-Francois Pekel, Andrew Cottam, Noel Gorelick, Alan S. (2016). "High-resolution mapping of global surface water and its long-term changes.". Nature Publishing Group, Vol 540, Issue N/A. pp. 418–422. https://doi.org/10.1038/nature20584. |
| [14] | Membele, Garikai Martin. (2022). "Integrating local, Indigenous knowledge and geographical information system in mapping flood vulnerability at Quarry Road West informal settlement in Durban, KwaZulu-Natal.". https://core.ac.uk/download/541929171.pdf. |
| [15] | Morris, G. L., & Fan, J. (2016). "Reservoir Sedimentation Handbook". McGraw-Hill. |
| [16] | National Research Council (2009). "Privately Owned Flood Control Infrastructure: A Review of the Bureau of Reclamation’s Creeks and Rivers Program". The National Academies Press. |
| [17] | Okpara, U. T., Obalola, A. I. (2023). "Climate change impacts on flooding patterns in Lagos.". 41(1). pp. 89-105. |
| [18] | Olaniyan, T.F., Olasunkanmi, K.A. (2023). "Urban flood resilience in Lagos: A study". 46(6). pp. 731-745. |
| [19] | Olowe, F. Jeremiah (2021). "Spatial prediction of flood susceptible areas using machine learning approach: a focus on west African region". https://core.ac.uk/download/389472766.pdf. |
| [20] | P. Williams (2023). "The Drainage System That Stands in the Way: Seeking Disease Eradication in Lagos, Nigeria". Pulitzer Center. https://pulitzercenter.org. |
| [21] | R. J. Burby (1998). "Coastal Land-Use Planning: A Summary of the Planning Process from the Perspective of the Non-Planning Professional". 26(2). pp. 161-171. |
| [22] | Tetsuya Sumi, Sameh A. Kantoush, Mohamed Saber (2021-10-11). "Wadi Flash Floods". Springer Nature. https://play.google.com/store/books/details?id=o2dHEAAAQBAJ&source=gbs_api. |
| [23] | US Environmental Protection Agency (2013). "Stormwater Management". US Environmental Protection Agency. https://www.epa.gov. |
| [24] | W. J. Mitsch, J. G. Gosselink (2015). "Wetlands". Wiley. |

 Abstract
 Reference
 Full-Text PDF
 Full-text HTML