Sharon Jeptanui, Emmanuel C. Kipkorir
Department of Civil and Structural Engineering, Moi University, Eldoret, Kenya
Correspondence to: Sharon Jeptanui, Department of Civil and Structural Engineering, Moi University, Eldoret, Kenya.
| Email: |  |
Copyright © 2024 The Author(s). Published by Scientific & Academic Publishing.
This work is licensed under the Creative Commons Attribution International License (CC BY).
http://creativecommons.org/licenses/by/4.0/

Abstract
Water is an indispensable resource not only for sustaining all life but also for human socio-economic development. With the increase in population comes land use pressure, which degrades the quality of groundwater, which is one of the most reliable sources of water for domestic, industrial and irrigation uses. This study sought to evaluate the groundwater quality of the Burnt Forest area, Uasin Gishu County and map its spatial distribution in terms of suitability for drinking purposes. Groundwater sources that consisted of 19 shallow wells and one borehole were sampled at random, and water samples were collected and tested for nine select water quality parameters: Feacal coliforms, Total coliforms, Nitrates, Chlorides, Turbidity, Total Hardness, pH, Total Dissolved Solids and Electrical Conductivity. Standard methods were used for the analysis of groundwater samples in the laboratory, and the results obtained were compared to WHO and NEMA guideline values to establish the portability of the groundwater and the extent of pollution. The inverse Distance Weighting Method in ArcGIS was used to generate thematic maps for each of the tested parameters. It was observed from the Water Quality Index (WQI) that the majority of the area had poor water quality, followed by good, very poor, and finally, one source (borehole) with excellent water quality. The sanitary survey revealed that proximity to pollution sources coupled with poor or lack of protection facilities on some wells placed a higher risk of contamination in some wells than others. Proper wells' construction, protection and maintenance is encouraged, and groundwater should be treated before domestic use, mainly for drinking purposes.
Keywords:
Groundwater quality, Spatial Distribution, Digital Elevation Model, Land use/Land cover, Water Quality Index
Cite this paper: Sharon Jeptanui, Emmanuel C. Kipkorir, Ground Water Quality Assessment Using GIS and Remote Sensing: A Case Study of Burnt Forest, Uasin Gishu County, Kenya, American Journal of Geographic Information System, Vol. 13 No. 1, 2024, pp. 1-11. doi: 10.5923/j.ajgis.20241301.01.
1. Introduction
The phrase "Water is life" is often used lightly to emphasize the importance of water in sustaining life on earth. However, the depth of this statement cannot be fully captured nor understood without a clear picture of the world's water demand and available supply. Access to clean and safe water is one of the major contemporary issues the world is currently grappling with as the accessible clean water sources continue decreasing by the day, yet the demand is increasing. While closing the water deficit is a major concern in the fight against water scarcity, maintaining the water quality of the available waters is equally important, and the gap widens. Various water sources are susceptible to different kinds of contamination and pollution. Groundwater sources are the largest contributor of fresh water; about 97% of water available and suitable for human use is vulnerable to contamination by industrial discharges, urban activities, agriculture, groundwater pumping, and disposal of waste, which affects its quality (Mishra, 2023). Once the groundwater is contaminated, its quality cannot be restored by stopping the pollutants from the source, and therefore, it becomes very important to monitor the quality of groundwater regularly and to devise ways and means to protect it (Verma et al., 2020). Growing urban centres such as Burnt Forest located in the agricultural area in the North Rift part of Kenya are the most vulnerable as no effective sewerage systems are in place. Most families use pit latrines and septic tanks, yet they depend on wells as the main sources of water for domestic use. Therefore, groundwater vulnerability assessment is crucial in determining how vulnerable a certain region is to a specific threat, whether natural or man-made. This study sought to evaluate groundwater quality in the Burnt Forest area and thematically represent it using the Geographic Information System (GIS) and remote sensing techniques. Study AreaThe study was conducted in the Burnt Forest area in Kesses constituency, Uasin Gishu County, along the Eldoret-Nakuru Highway. Geographically, the area falls within a latitude of 0.2154° N and a longitude of 35.4316°E (Figure 1) with an area of approximately 2.8 km2. Burnt Forest is among the fastest-growing peri-urban areas along the Eldoret-Nakuru highway, which has an approximate population of 5,242 permanent residents. However, the actual population influencing water and sanitation services is most likely much higher because of the various social amenities within the area, such as schools, Burnt Forest Level IV hospital, the market, and the police station. The area is divided into six administrative estates or villages: Kahuho, Town Centre, Wainaina, Job Estate, Pipeline, and Turudi. The area falls under the Timboroa sub-catchment, part of the larger Mau water catchment complex, which lies on the Tinderet volcanic; hence, the rocks are mostly porphyritic phonolites and nepheline phonolites of the tertiary age (Walsh, 1969). Burnt Forest has an altitude of approximately 2762 meters above sea level with a mean annual temperature of 18°C and average annual rainfall of 1205 mm, the rainy season extending between April and September. Evapotranspiration range between 50-150 mm/month. Figure 1 shows the location and details of the study area.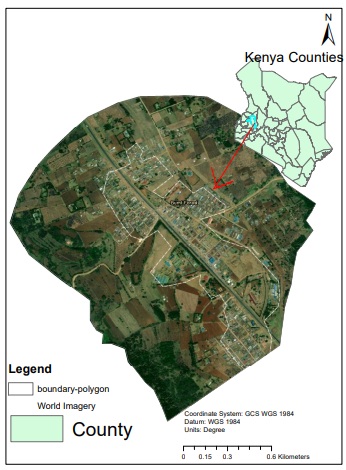 | Figure 1. Study area location and details |
2. Materials and Methods
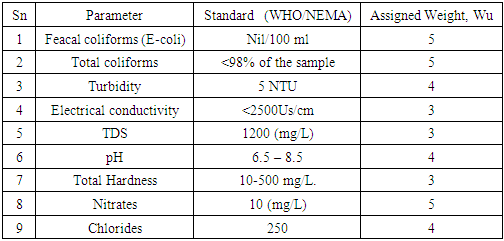
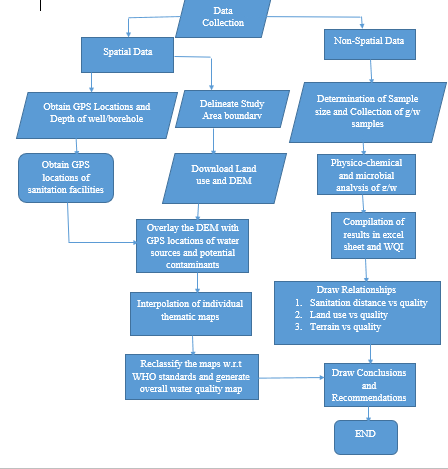
Figure 2 presents a methodology flowchart used in the study. The methodology basically entailed the collection of data, both spatial and non-spatial. The first step was to delineate the study area’s boundary using Google Earth Pro and export to ArcGIS. The land use categories were classified based on Sentinel characterization to show how they relate to the water quality. Similarly, the DEM was used to show the topography and slope of the study area and extract the contours which cumulatively influence groundwater movement. In developing the water quality index (WQI), the sample size of water sources was determined using Cochran's formula (Nanjundeswaraswamy & Divakar, 2021), after which the water samples were collected at random from different water sources within the study area, noting their locations and those of nearest contaminant sources, more so sanitation facilities using mobile GPS application. The physical, chemical, and microbial characteristics of the water samples were then tested and analyzed in accordance with standard laboratory procedures, and WQI was calculated using the weighted average index method. Thematic maps of the various tested water quality parameters were developed using the inverse distance weighting (IDW) interpolation technique in ArcGIS. In order to demonstrate conformity with the guidelines, the thematic layer of each parameter was then classed into five classes, with one being the least acceptable and five the most suitable, taking into account the WHO standards for drinking water. The weighted overlay function in ArcMap 10.2 software was then used to construct a drinking water quality index for the research area based on the classified characteristics and their corresponding weights as shown in Table 1.Table 1. Water quality parameters standards and assigned weights
 |
| |
|
 | Figure 2. Schematic representation of the data collection process |
3. Results and Discussion
Land Use Map and Digital Elevation ModelThe data used in the study include a digital elevation model (DEM) downloaded from Divagis.org and analyzed using ArcGIS. Additionally, the satellite land use imagery-Sentinel-2 data of 10 meters resolution of the study area downloaded from the European Space Agency was used to compare land use and water quality. Figures 3 and 4 are land use and DEM of the study area, respectively.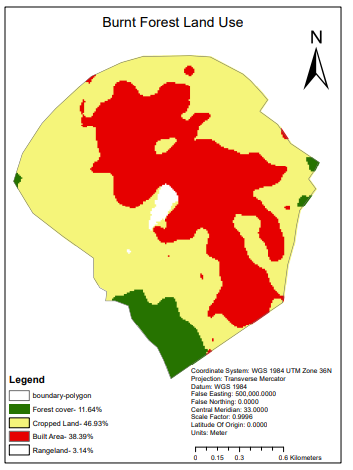 | Figure 3. Land use map of the study area |
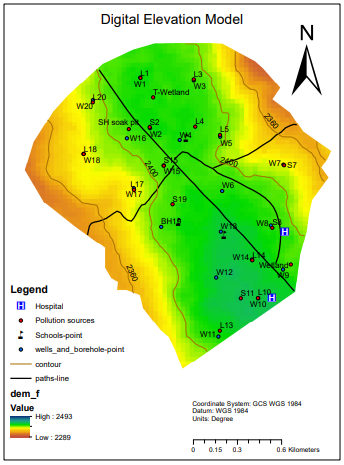 | Figure 4. DEM of the study area |
Physical, Chemical and Microbial Characteristics of GroundwaterTable 2 shows the results of groundwater samples' physical, chemical and microbial analysis for the 20 water sources spatially sample in the study area. The depths of sampled wells ranged from 8 to 12 meters, with a borehole at approximately 30 meters. The sources were sampled during a fairly rainy season when the water levels in the wells were about 3 to 5m whereas the borehole pump water was sampled.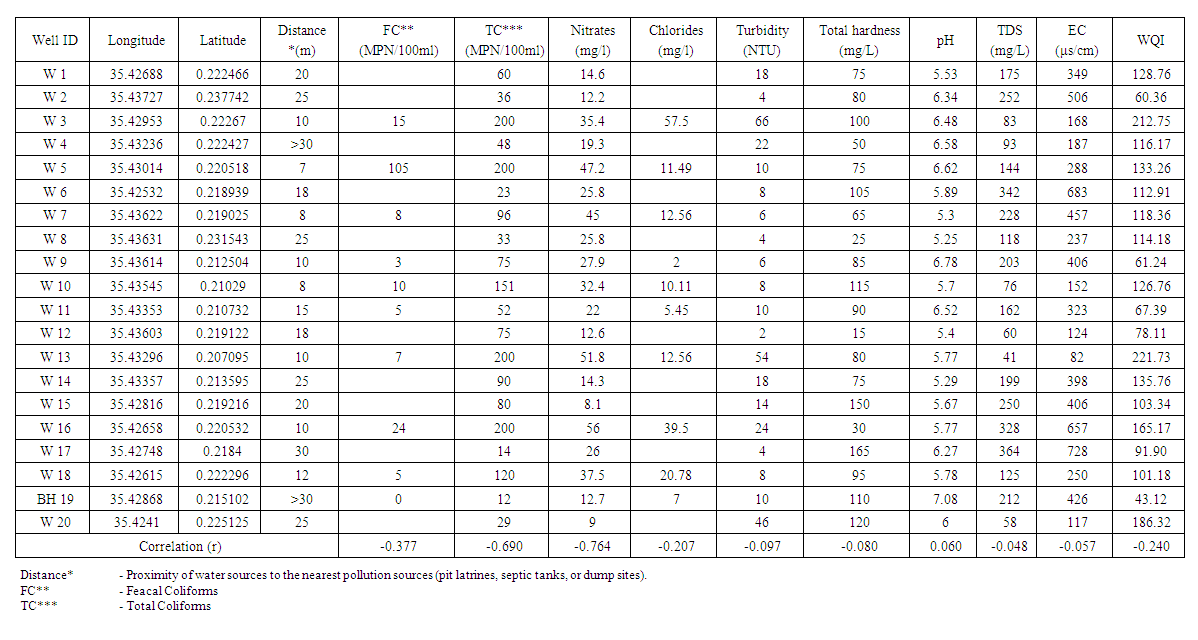 | Table 2. Water quality parameters values |
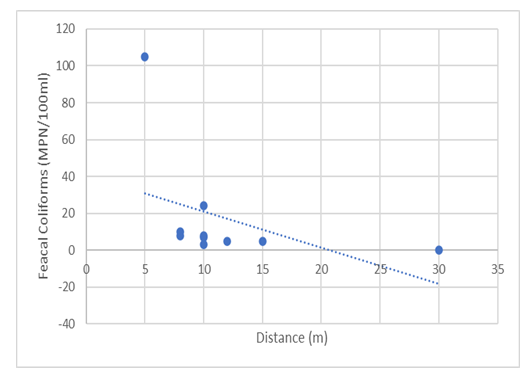
Thematic Maps for Individual Water Quality Parameters(i) Feacal ColiformsThe sampled water sources in the area displayed varied feacal coliform counts. Figure 5 shows the spatial distribution of feacal coliforms in the study area while figure 6 shows the relationship between FC and distance to pollution sources.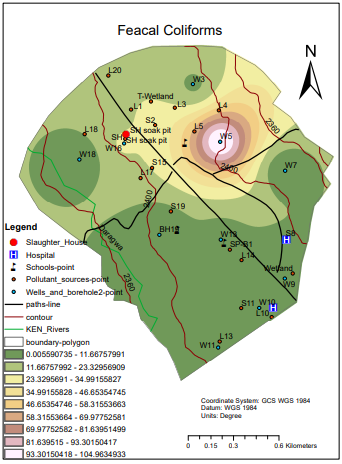 | Figure 5. Feacal coliforms spatial distribution map |
 | Figure 6. Feacal coliforms vs. distance to pollution sources |
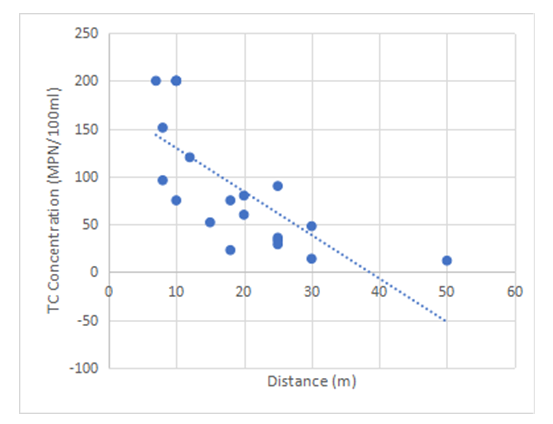
The map (Figure 5) shows that the upper area had the highest values, indicating the most pollution, whereas the lower side had a lower risk. The relationship between feacal coliform counts and distances to pollutant sources portrays a moderate inverse correlation of r = -0.3773. This can be attributed to the high population densities in these areas as well as proximity to onsite sanitation facilities, whereas the low values on the lower side can be attributed to less population pressure on these sides. According to Masood et al. (2024), water sources located in highly populated urban areas are susceptible to faecal contamination due to their proximity to water sources. Furthermore, the sanitary survey conducted by Kitonga et al. (2018) in Ainabkoi, where the study area is partly located, attributes faecal contamination of groundwater sources to poor sanitation, such as improper siting of wells with respect to pit latrines or septic tanks. Also, the relationship between feacal coliform counts and distances to pollutant sources portrays a moderate inverse correlation of r = -0.3773 as shown in Figure 6. This implies that sources closer to sanitation facilities are highly likely to have high coliforms counts whereas those far away are less likely to be contaminated by coliform bacteria. These results are reiterated by Kiprotich, (2006) study that feacal contamination in water sources is inversely proportional to sanitation facilities distances.(ii) Total ColiformsThe sampled water sources in the area recorded varying total coliform values as shown in figure 7 which indicates their spatial distribution.The map (Figure 7) shows that most of the area has total coliform counts ranging from 55-117 MPN/100ml. The areas with high coliform counts are concentrated in densely populated neighbourhoods with different potential contaminant sources. Activities such as careless dumping of waste, municipal waste disposal, or improper disposal of hazardous materials contaminate groundwater and contribute to high total coliform counts in wells. Kitonga et al. (2019) further stresses that a poorly organized environment around the homestead, with poultry and livestock kept near the well will have an impact on the coliform contamination of ground water sources. According to Kitonga et al. (2019), the distance at which the household premises, the cowsheds, greenhouses, vegetable gardens, pit latrines, dumps and other aggressive sources of pollution can be located and still have an impact on well water quality is 145 meters. Most residents in the study area reside in plots small as 15 m by 30 m while they have a well, livestock, a garden, and a pit latrine in the small piece of land. Similarly, the relationship between total coliform counts and distances to pollutant sources portrays a strong inverse correlation of r = -0.690 as shown in Figure 8, implying that coliform contamination in water sources is inversely proportional to the distance to pollution sources such as cowsheds, greenhouses, vegetable gardens, pit latrines, and dumps.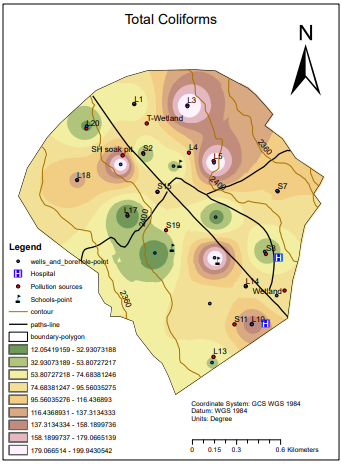 | Figure 7. Total Coliforms spatial distribution map |
 | Figure 8. Concentration of Total Coliforms vs. distance to pollution sources |
(iii) ChloridesThe chlorides concentrations of the sampled water sources in the study area were moderately low. Figure 9 shows the spatial distribution of chlorides in the area.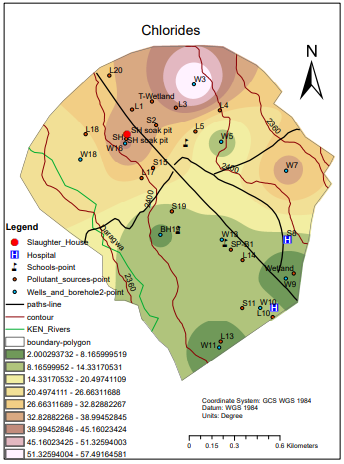 | Figure 9. Chlorides concentrations spatial distribution map |
From the map (Figure 9), the northern part of the study area had slightly higher chloride values than the southern part. The chloride values in the area were generally lower, with the highest recorded value being 57.1 mg/l, which is much lower than WHO's 250 mg/l. According to Gupta (2019), lower chloride values are largely attributed to the geologic formation of the area, as some geological formations naturally contain lower levels of chloride, leading to low chloride values in the well water. In this regard, the wells in the study area were not that deep (not more than 12 m deep), hence no chloride contribution from underground rock formations.(iv) NitratesThe area recorded moderate nitrate values, as shown in the spatial distribution map in Figure 10. 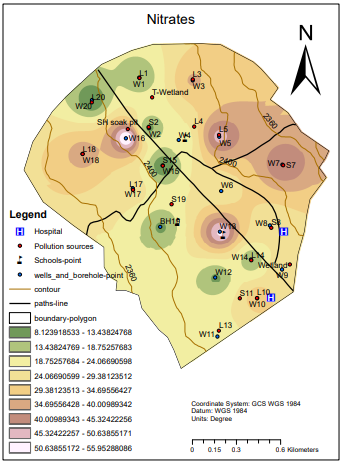 | Figure 10. Nitrates concentrations spatial distribution map |
From the map (Figure 10), the majority of the area had nitrates concentrations between 18 and 40 mg/l. From the maps, the lighter the shade of colour, the greater the concentration of nitrates in the water samples of that area. Well 16 specifically had the highest concentrations of Nitrates. This is attributed to its close proximity to the slaughterhouse, and hence, the facility's waste (cattle kraals) must have contributed to the high concentrations. According to Kitonga et al. (2018), animal wastes from active or abandoned feedlots may be a significant source of nitrates in groundwater. When manure is stored in open lots for eight months, 7% nitrogen, 14% phosphorus and potassium enter the environment in the form of leachate, resulting in groundwater pollution from the leachate greatly exceeding the maximum allowable concentrations for the area (Kitonga et al., 2018). The direction of groundwater flow also has an important influence on the probability of contamination. Based on groundwater hydrology, water flows downslope along the gradient of the groundwater surface or water table (Kitonga et al., 2018). This gradient generally conforms to the surface contours. Thus, water quality in wells is highly influenced by pollutants moving from up-slope in the vicinity of the well. This is the case in the study area as sources closer to the highway, which is elevated, had lower nitrate concentrations, whereas those in lower areas had high concentrations. Additionally, from the recorded data, the distances of sources to sanitation sources shows a strong inverse correlation of r= -0.7642 with nitrates concentration levels as shown in Figure 11. This implies closer the source to the sanitation facility the higher the likelihood of high nitrate concentrations.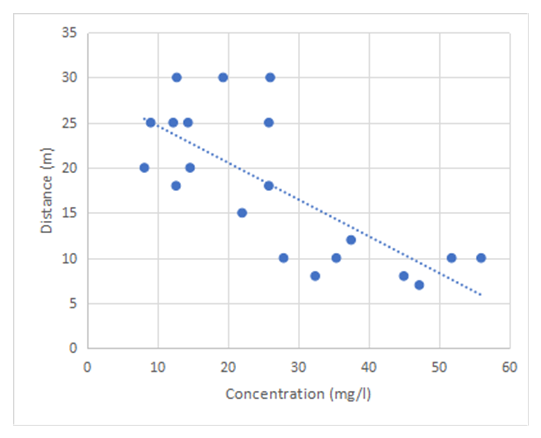 | Figure 11. Relationship between nitrates concentrations and distances to sanitation facilities |
(v) TurbidityThe generated thematic map for Turbidity in Figure 12 shows the spatial distribution of turbidity in the study area. It was observed that the northern part had the highest values for turbidity, signaling the greatest pollution.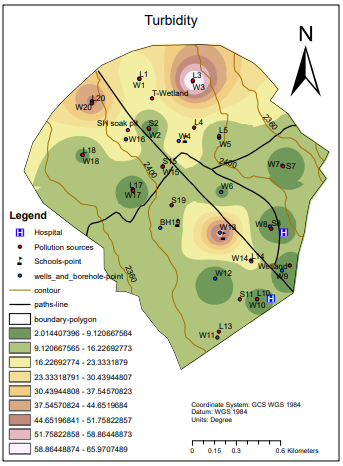 | Figure 12. Turbidity spatial distribution map |
From the map (Figure 12), the majority of the area had low turbidity values, with a small portion of the Northern part recording values above 15 NTU. This can be attributed to the general terrain of the area, as the land gently slopes towards that part, increasing the possibility of runoff pollution, which increases Turbidity (Kitonga et al., 2018). As in the case of nitrates, turbidity is largely influenced by the terrain of the area. As water flows downstream, it carries with it different pollutants that risk downstream sources of pollution. Hence, turbidity in wells is highly influenced by pollutants moving from up-slope in the vicinity of the well.(vi) Total HardnessFigure 13 shows the spatial distribution of total hardness concentrations in the study area.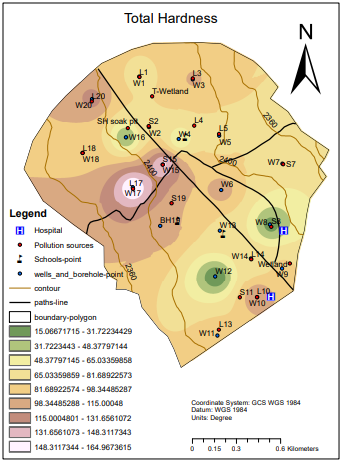 | Figure 13. Total Hardness spatial distribution map |
From the map (Figure 13), most parts of the area have total hardness values ranging from 48-98 mg/l. These low values can similarly be attributed to the area's geologic formation, as the aquifer's composition and surrounding geological formations can influence the hardness of well water. According to Masood et al. (2024), the hardness of the water is reflected by the geological formations from where the water is derived. Some geological formations naturally contain fewer minerals, such as calcium and magnesium, which are major contributors to water hardness. Carbonates naturally present in surface soils and sediments will increase the hardness of surface waters. Similarly, subsurface limestone formations increase the hardness of subsurface waters.(vii) pHThe thematic map in Figure 14 shows the spatial distribution of pH in study areas. From the map, it is clear that the pH water quality in the majority of the area is acidic.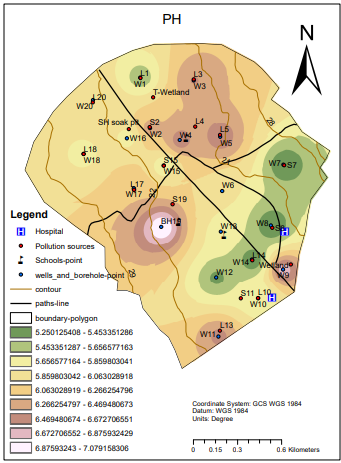 | Figure 14. pH spatial distribution map |
From the map (Figure 14), the majority of the area recorded acidic pH values ranging from 5.6 to 6.0. This acidity can be attributed to the location of water sources in close proximity to sanitation sources. Sewage tends to percolate to groundwater over time, increasing its acidity. Agricultural practices such as the use of fertilizers and organic manure, pesticides, and herbicides in agricultural areas can contribute to soil acidification and leach acidic compounds into groundwater, resulting in acidic pH values in wells (Kiprotich & Ndambuki, 2012). Borehole 19 had the most optimum pH value, indicating the absence of any possible contamination that could alter the pH of the water.(viii) Total Dissolved SolidsFigure 15 is a thematic map of TDS spatial distribution in the area. 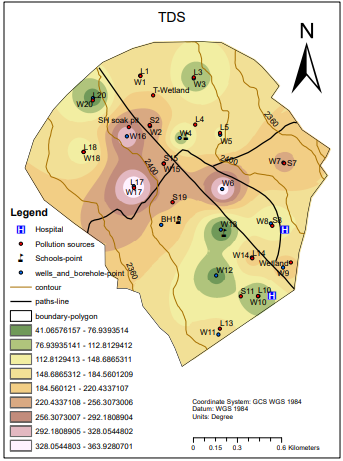 | Figure 15. TDS spatial distribution map |
From the map (Figure 15), the majority of the area had TDS values ranging from 112 mg/l to 220 mg/l, which are very low. There are also a number of isolated sources with considerably low TDS levels below 75 mg/l. As stated earlier, the low TDS concentrations in groundwater sources can be attributed to natural filtration, as water passing through certain geological formations or soil layers can naturally filter out minerals and other dissolved substances, leading to lower TDS levels Pandey et al. (2020). The water sources in the area are mostly fed by groundwater systems that undergo natural filtration. Furthermore, surface protection of wells minimizes the chances of runoff in to the sources, which tends to decrease TDS levels.(ix) Electrical ConductivityFigure 16 shows the spatial distribution of electrical conductivity in the study area. 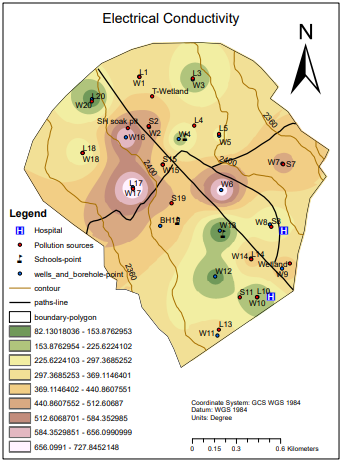 | Figure 16. Electrical Conductivity Spatial Distribution Map |
From the map (Figure 16), the majority of the area has moderate electrical conductivity with values ranging between 225 μS/cm and 440 μS/cm. Well 16, which is located in close proximity to the slaughterhouse, recorded slightly higher values. This can be attributed to slaughterhouse waste, such as blood and intestinal waste rich in ionic concentration, which percolates in the ground and finds its way into nearby water sources. Well 17, which recorded the highest electrical conductivity value, is located close to a pit latrine, about 12 m. Wells located closer to sources of pollution or human activity are likely to have elevated dissolved ions and pollutants levels, resulting in higher electrical conductivity (Kiprotich & Ndambuki, 2012). Furthermore, according to Mugun (2015), the concentration of total suspended solids in groundwater sources is directly proportional to that of electrical conductivity. Therefore, the moderate electrical conductivity values in the area can be attributed to factors similar to TDS.Water Quality IndexThe Water Quality Index (WQI) is a numeric expression used to transform large quantities of water characterization data into a single number. It is a measure of how the water quality variables compare to the water quality guidelines for a specific site. It is used to assess the appropriateness of the quality of the water for a variety of uses (Kawo & Karuppannan, 2018), such as habitat for aquatic life, irrigation, recreation, and drinking water. The water quality index converts complex or complicated water quality data into information that is understandable and usable by the public.Figure 17 indicates an overall water quality thematic map of the study area.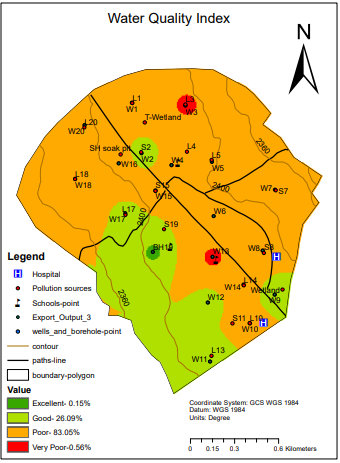 | Figure 17. Water Quality Index Spatial Map |
From the map (Figure 17), 83.05% of the area has poor water quality, 26.09% has good, 0.56% has very poor, and 0.15% has excellent water quality. The northeastern part of the study area has a higher population density compared to the western part, hence the poor and good water quality. The one source (BH 19) with excellent water quality is a well-protected school borehole isolated from various contamination sources. Hence, the excellent water quality can be attributed to the natural filtration of water as it percolates deep underground. According to Matsumbe (2020), boreholes tend to have better water quality than shallow wells because of the low possibility of surface contamination by runoff and stormwater. Furthermore, boreholes draw water from aquifers located deep underground; hence, as water percolates into the aquifers, it undergoes natural filtration, eliminating pollutants and improving water quality in the process. Wells 3, 14, 16, and 20 exhibited the highest index values (lowest water quality), implying areas with more pronounced water quality challenges within the study area. The other four water sources with very poor quality can be attributed to their very close proximity to pollution sources. Unplanned urbanization and the conversion of agricultural land to residential areas are two of the major causes of water quality deterioration. Burnt Forest's population has increased exponentially over the last decade. Commercializing peri-urban centres attracts more people seeking job opportunities or livelihood sources, leading to overexploiting resources such as groundwater. Overlay of Overall Water QualityFigure 18 shows the study area's overall water quality compliance map from the overlay of all nine tested water quality parameters. From the map, the majority of the study area (57.24%) had between 70-81% compliance with WHO standards on the tested parameters. However, there are sections (19.24% of the study area) with lower compliance, below 65%, indicating poor water quality. This overall water quality of the study area reiterates the water quality index as the northeastern part of the study area seems to have lower compliance, which is attributed to high population density compared to the southwestern part, which displays higher compliance with less population density. 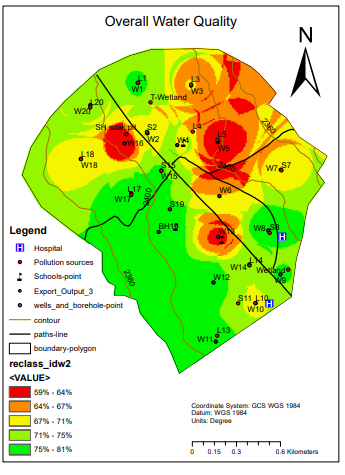 | Figure 18. Overlay of Overall Water Quality Map |
It can be seen that groundwater compliance with WHO standards is in deed lower in built-up areas when the land use/land cover map of the study area is compared with the overall water quality map. These results underscore the necessity of targeted actions to improve water quality in different sectors, especially in areas where the percentage of compliance is low, indicating more serious water quality concerns, with the goal of raising the general quality of groundwater for better environmental and public health in the area.
4. Conclusions and Recommendations
In this study, the groundwater quality of the Burnt Forest area was evaluated and mapped using the Geographic Information System (GIS) to understand the present status of groundwater quality. Based on the study's findings, the most densely populated areas had the poorest water quality, the relationship between distance and contamination of the water is inversely proportional with r values ranging from -0.048 to -0.764, and the terrain of the study area affects various water quality parameters. Also, most of the physicochemical and bacteriological parameters assessed in the study did not conform to the WHO and NEMA guideline values for portable water. The study area complied with WHO guideline standards in three tested parameters only: total hardness, total dissolved solids, and electrical conductivity. Faecal coliforms, nitrates, turbidity, and chlorides showed partial compliance, while total coliforms and pH showed total non-compliance. Furthermore, the estimated WQI values showed that 50% of the area has poor water quality, 47.6% is good, 2.04% is very poor, and 0.36% has excellent water quality. Nitrates, chlorides, and turbidity, which are related to the high WQI values, made significant contributions. The overall water quality compliance map generated by overlaying all the parameters reiterates WQI values' spatial distribution. Therefore, the study advances the following recommendations: rehabilitation of the Burnt Forest water treatment and supply system to ensure residents have reliable access to clean and safe water throughout the year. Also, the study recommends the adoption of a more appropriate and sustainable waste and wastewater treatment and disposal system for the slaughterhouse to eliminate the nuisance and contamination of nearby groundwater sources by the generated waste. Lastly, the residents should employ better well and sanitation facilities management practices (in accordance with WHO guidelines) to prevent the contamination of water sources and employ low-cost sustainable household point of use water purification techniques such as boiling, bio-sand filters and thermal treatment with solar radiation, among others to improve quality of drinking water.
ACKNOWLEDGEMENTS
First, the authors would like to thank Moi University Department of Civil and Structural Engineering for their technical support in the research. Secondly, the first author would like to thank her parents and siblings for their financial and moral support throughout the research period, together with anybody who made it possible to complete this project.
References
| [1] | Gupta, R., Jindal, T., Khan, A. S., Srivastava, P., & Kanaujia, A. (2019). Assessment of ground water quality and its suitability for drinking in industrial area Jajmau, Kanpur, India. |
| [2] | Kawo, N. S., & Karuppannan, S. (2018). Groundwater quality assessment using water quality index and GIS technique in Modjo River Basin, central Ethiopia. Journal of African Earth Sciences, 147, 300-311. |
| [3] | Kiprotich, K. C. & Ndambuki, J. M. (2012). Well water contamination by pit latrines: A case study of Langas. International Journal of Water Resources and Environmental Engineering Vol. 4(2), pp. 35-43. |
| [4] | Kitonga, L. M., Moturi, W. N., Mwonga, S. M., & Taabu, I. (2018). Assessment of physico-chemical characteristics of groundwater among different farm sizes in Ainabkoi sub-county, Uasin Gishu County, Kenya. |
| [5] | Masood, M. U., Rashid, M., Haider, S., Naz, I., Pande, C. B., Heddam, S., ... & Sammen, S. S. (2024). Exploring Groundwater Quality Assessment: A Geostatistical and Integrated Water Quality Indices Perspective. Water, 16(1), 138. |
| [6] | Matsimbe, J. (2020). Comparative Study of Water Quality From Boreholes and Hand-Dug Wells: Case of Namatapa in Bangwe Township. Engineering and Technology Quarterly Reviews, 3(3). |
| [7] | Mishra, R. K. (2023). Fresh water availability and its global challenge. British Journal of Multidisciplinary and Advanced Studies, 4(3), 1-78. |
| [8] | Mugun, K. K. (2015). Assessment of Drinking Water Quality In Shallow Wells In Koitoror Location Of Uasin Gishu County, Kenya. Kenyatta University. |
| [9] | Nanjundeswaraswamy, T. S., & Divakar, S. (2021). Determination of sample size and sampling methods in applied research. Proceedings on engineering sciences, 3(1), 25-32. |
| [10] | Pandey, H. K., Tiwari, V., Kumar, S., Yadav, A., & Srivastava, S. K. (2020). Groundwater quality assessment of Allahabad smart city using GIS and water quality index. Sustainable Water Resources Management, 6, 1-14. |
| [11] | Verma, P., Singh, P. K., Sinha, R. R., & Tiwari, A. K. (2020). Assessment of groundwater quality status by using water quality index (WQI) and geographic information system (GIS) approaches: a case study of the Bokaro district, India. Applied Water Science, 10, 1-16. |
| [12] | Walsh, J. (1969). Geology of the Eldama Ravine-Kabarnet area. Rep. Geol. Surv. Kenya, 83, 1-48. |


 Abstract
 Reference
 Full-Text PDF
 Full-text HTML