-
Paper Information
- Paper Submission
-
Journal Information
- About This Journal
- Editorial Board
- Current Issue
- Archive
- Author Guidelines
- Contact Us
American Journal of Geographic Information System
p-ISSN: 2163-1131 e-ISSN: 2163-114X
2022; 11(2): 41-50
doi:10.5923/j.ajgis.20221102.02
Received: Oct. 19, 2022; Accepted: Nov. 4, 2022; Published: Dec. 6, 2022

Spatio Temporal Analysis in Forest Cover Using Google Earth Engine in Ashanti Region, Ghana
 Abstract
 Reference
 Full-Text PDF
 Full-text HTML
Kwaku Agyekum Codjoe, Akwasi Afrifa Acheampong
Geomatic Engineering Department, Kwame Nkrumah University of Science and Technology, Kumasi, PBM KNUST, Ghana
Correspondence to: Kwaku Agyekum Codjoe, Geomatic Engineering Department, Kwame Nkrumah University of Science and Technology, Kumasi, PBM KNUST, Ghana.
| Email: |  |
Copyright © 2022 The Author(s). Published by Scientific & Academic Publishing.
This work is licensed under the Creative Commons Attribution International License (CC BY).
http://creativecommons.org/licenses/by/4.0/

The earth surface is constantly changing for various reasons, and an accurate identification and monitoring of the spatiotemporal changes can support informed environmental and socio-economic decisions. While certain physical features like forestlands supports life and other essential services, a clear understanding of its existence and sustainability is key to the survival of our environment and the world as a whole. This study analysed spatiotemporal change in forest cover using machine learning algorithm, Random Forest (RF) and Support Vector Machine (SVM) classifier in Ashanti region, Ghana using cloud computing engine Google Earth Engine (GEE) and statistical computing program R-Studio. The RF and SVM classifiers were applied on a geometrically corrected Landsat-7 and Landsat-8 satellite images from 1 January 2006 to 31 October 2020. Land covers were grouped into six (6) classes namely, urban, closed forest, open forest, bareland, water and farmland. One thousand two hundred (1200) randomly reference samples were used for training (0.7%) and testing (0.3%) for each year i.e., 2006, 2011, 2015 and 2020. The results showed that the RF classifier yielded an overall accuracy of 98% and a kappa coefficient of 0.97 whereas SVM yielded an overall accuracy of 90% and a kappa coefficient of 0.88 using GEE. The results showed that, from the year 2006 to 2015, there was 22.6% loss in the region’s closed forest but a slight increase of 0.13% from 2015 to 2020. Open forest increased by 12.6% from 2006 to 2015 and decreased by 6% from 2015 to 2020. The results provided evidence that GEE cloud-computing being cost-effective, can provide information on land cover changes and can assist forest stakeholders in policy and decision making.
Keywords: Remote Sensing, Random Forest, Support Vector Machine, Cloud Computing, RStudio, Land Use Change, Machine Learning
Cite this paper: Kwaku Agyekum Codjoe, Akwasi Afrifa Acheampong, Spatio Temporal Analysis in Forest Cover Using Google Earth Engine in Ashanti Region, Ghana, American Journal of Geographic Information System, Vol. 11 No. 2, 2022, pp. 41-50. doi: 10.5923/j.ajgis.20221102.02.
Article Outline
1. Introduction
- A forest is basically defined as a vast tract of land dominated by trees. Forest covers approximately 31% of the world’s land surface. Changes in forest cover can significantly affect the ecosystem, i.e., reducing or increasing social vulnerability [1]. It is therefore crucial to accurately access forest cover and its quality in order to properly manage it. All the six continents in the world contribute 31% of the world’s forest cover but due to different land uses, the forest cover areas differ from continent to continent [1]. As of 2015, Europe was the largest contributor although it is the sixth largest continent with a forest cover of 25.38%, whilst Oceania was the lowest contributors to the world’s forest cover with 4.35% [2]. From 1990 to 2015, global forest decreased 0.13% annually. It is known that human activities greatly impact the natural environment, most importantly land cover [3]. The impacts on the natural environment are often negative, resulting in pollution, degradation, scarcity, soil erosion, flooding, threat to biodiversity, climatic change, water cycle disruption, species loss and extinction [4]. Increasing human population in the world has resulted in the demand of urban space and land for settlement and agricultural purposes. It accounts to why many natural habitats have experienced conversion to serve human needs [5]. Globally the total forest land use has declined with a net reduction of approximately 5.3 million ha/year between 1990 and 2010 [1]. This decline is most significant in Africa where shifting cultivation makes up 93% of forest loss, followed by Asia and the Middle East. According to [6], every year, 1% of globally intact ecosystems is converted to other uses. Also, with the world’s population growing every now and then and projected to increase to about 10 billion people by 2050, demand for food is expected to be grow. This has caused a lot of developing countries where hunger and poverty are at a high rate to turn most of their forest areas to farmlands and livestock areas. The challenge has always been how to increase agricultural production and improve food security without decreasing forest area [7]. [8] recorded that in Ghana, expansion of annual crop farms and tree crops causes 78% of forest loss. Though there are various activities causing deforestation, agricultural expansion adds more pressure on the remaining forest areas. Too much use of natural resources through illegal and unsustainable logging and mining also contributes to this forest area reduction globally, especially in Ghana [9].The Sustainable Development Goal 15 highlights on keeping, reinstating and promoting sustainably managed forest. The trend of forest area change rate at global level remains an issue of concern. This shows the extent of importance that the world attaches to forest resources [10]. The value of forest resources is immeasurable, being a natural resource and an environmental asset [1]. The world’s forest accounts for 80% of the earth’s plant biomass and plays an essential part in maintaining the ecological balance of the earth [11]. A lot of research has been conducted to find out the relationship between forests and climate change. It is known that forest presents an opportunity for climate change adaptation. It serves as an environmental carbon source through deforestation and forest degradation whiles acting as carbon sink through afforestation, promoting forest sustainable management [12]. Population growth and climate change stands above the other reasons for forest cover changes [13]. The effects are often not seen immediately but in the future. In Ghana, artisanal and small-scale mining forms one of the major agents damaging the nations forest cover. In 2019, the president of the nation gave an address on the Voluntary National Review Report (NVR) on the implementation of the 2030 agenda for Sustainable Development which also addressed our current forest cover because of the alarming rate of land degradation by illegal mining activities [14]. This was in line with the Sustainable Development Goal 15.Through remote sensing, analyses can be made on data which sensors have captured about an object, area or phenomenon [15]. Most researchers employ the use of US Geological Survey’s Landsat satellite, Sentinel, MODIS, High Resolution Imagery and Worldwide Reference System for forest cover analysis [1]. Accuracy assessment on such classifications have been identified within the remote sensing community [16]. This makes it possible to explore the temporal spatial variations in land distribution and historic trends of such distributions to appreciate the natural and anthropogenic phenomena fuelling the process [17]. Land Use and Land Cover changes (LULC) has therefore become essential for comprehending the relationships and trends of anthropogenic effects within a temporal scale [18]. Google Earth Engine (GEE) has inbuilt tools and computational power necessary to analyse large data and visualize it to users. It hands to any user freely available satellite data including Landsat, MODIS, ASTER, sentinel, among others [23,33]. It stands out in its rapid processing of results because of its cloud-based high computational powers in handling big data [19]. Working with large dataset specifically satellite imageries require supercomputers with high-performance computing powers that GEE platform readily provides [20]. With the large amount of satellite data in the world at the moment, there recurs efficient data storage facilities and faster technologies to help make meaning of the available big data for decision making.Monitoring to know and understand the state of our forest as a country is of great importance and holds much benefits. Forest provides goods and services which performs an essential role in sustainable development. Random forest classification [24] has proven to be suitable for varying applications with not much known on how well it does in classifying forest cover. RF algorithm is suitable for classifying data that consist of series of decisions. In classifying large-scale and noisy data, RF provides very good result [28]. The regions forest needs to be consistently monitored to ensure sustainability and conservation of the forest resource. This requires an efficient platform, accuracy processing procedures and tools that can be used to process data to ascertain information for decision making. The research investigates how well RF does in classifying forest cover against SVM whilst deploying Google earth cloud computing API. It tests GEE’s ability to easily provide solution for search a task. i.e., with its availability of data, inbuilt processing tools and flexible manipulation of data with JavaScript and Python programming. This article focuses on the use of Google Earth Engine cloud computing platform to analysis the spatio-temporal change in forest cover in one of the developed regions in Ghana, West Africa using Random Forest algorithm and Support Vector Machine.
2. Materials and Methods
2.1. Study Area
- Ashanti region forms part of the regions in the southern sector of Ghana. It lies approximately at the center of Ghana, as shown in Figure 1 and forms a part of the sixteen administrative regions of Ghana. Ashanti Region is the third largest administrative region occupying a total land surface of 24,389 km2 or 10.2 percent of the total land area of Ghana. It lies between approximately 0.15W and 2.25W, and approximately 5.50N and 7.46N [21]. The region has a tropical climate and a population of 5,426,435 according to the 2021 census thus, forming 17.6% of Ghana’s total population [22]. The region experiences two rainy seasons: April to mid-August where rains are major and September to November where rains are minor. Ashanti region is known for cocoa growing and gold mining. The region has waterfalls, forest reserves, lake, national parks, birds and wildlife sanctuaries: There are rivers like Offin, Pra and Afram with Lake Bosomtwe being the largest natural lake in the country.
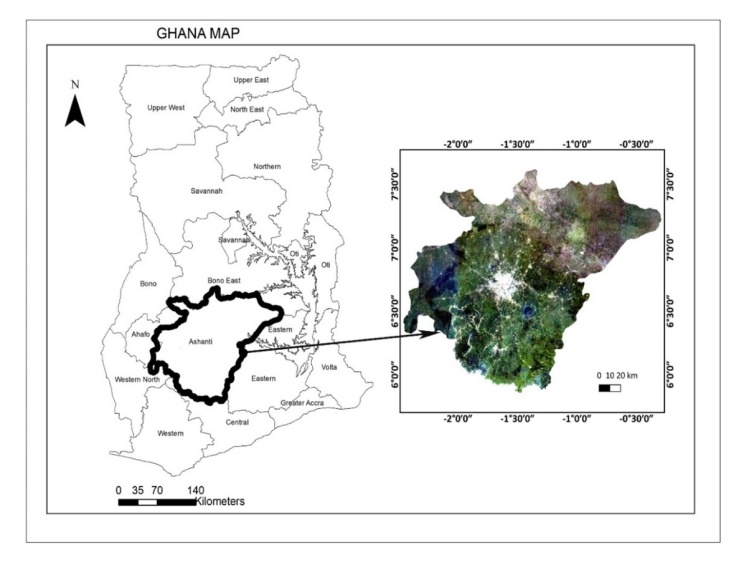 | Figure 1. Study Area - Ashanti Region, Ghana |
2.2. Materials
2.2.1. Dataset
- The data used included a shapefile of the boundary of Ashanti region, Landsat 7 and 8 satellite imagery and 1200 training data point coordinates extracted from Google Earth. Landsat 7 and Landsat 8 atmospherically corrected Surface Reflectance (SR) product were used as the main raster dataset [19]. Landsat 7 imagery from 2006 and 2011 were used whilst that of the year 2015 and 2020 were adopted from Landsat 8. All the yearly images were acquired between November and April based on availability and least clouds and shadows. Tier 1 data was used because it meets both geometric and radiometric quality requirements [34].
2.3. Methods
2.3.1. Image Corrections
- The Landsat 7 and Landsat 8 images in Google Earth Engine have been corrected for top-of-atmosphere (TOA) reflectance, surface reflectance (SR) and cloud free composite. All SR image have been processed to Level-1 precision and terrain corrections (http://glovis.usgs.gov). Cloud, cloud shadow, aerosol and inundation were masked for quality assessment as provided in Tier 1 products. C Function of Mask (CF Mask) algorithm was used to remove cloud cover from the Level -1 Landsat collection imageries (http://glovis.usgs.gov).
2.3.2. Training and Validation Data
- Training data was collected from Google Earth across the time series [23]. Therefore, two hundred (200) random samples points for each LULC class were accurately identified on Google Earth and collected for both training and validation data. The number of classes were six, namely, urban/settlement, water bodies, bareland, closed forest, open forest and farmland (Table 1). Two-third of the sample data were used as training data and one-third was used as the validation data for each LULC class. The same training data was applied on both GEE and RStudio using the corrected SR imagery from GEE.
|
2.3.3. Random Forest Classification (RF)
- Random Forest (RF) is a pixel-based classification. It combines tree predictors in a way where individual tree depends on the values of a random vector sampled independently and the same distribution for all tress in the forest [24]. The Random Forest is an ensemble classification algorithm, which uses bootstrap aggregating to generate an ensemble of classification (using multiple decision trees) and each tree trains on a certain subset of the entire training data [25]. The advantages of RF include, their non-parametric nature, high classification accuracy and the ability to find out variable importance [30]. A Random Forest is a classifier consisting of a collection of tree structured classifiers {h (x, Θk), k=1, ...} where the {Θk} are independent identically distributed random vectors and each tree casts a unit vote for the most popular class at input x.A random vector Θk is generated, independent of the past random vectors Θ1, ..., Θk−1 but with the same distribution; and a tree is grown using the training set and Θk, resulting in a classifier h (x, Θk) where x is an input vector. The nature and dimensionality of Θ depends on its use in tree construction. After a large number of trees are generated, they vote for the most popular class. We call these procedures Random Forests [24].Random Forest (RF) classification has been successfully used on different applications worldwide [24]. Among them are large area crop mapping [26], mapping tropical disturbed forest [23] and others. The method is suitable for classifying applications that consist of series of decision trees to undertake to get a suitable response. Studies have shown that Random Forest is superior to other classifiers [27] when considering large-scale and noisy datasets [28].
2.3.4. Support Vector Machine (SVM)
- Support Vector Machine (SVM) is a supervised machine-learning model for two–group classification problems [29]. SVM looks at a given data and sort it into one of two categories. A high dimensional space is defined via a kernel function. This is done in such a way that the support vectors are as far as possible from each other and the hyperplane is positioned at the exact center which is referred to as the optimal hyperplane. The support vectors are the extreme points in the dataset. Based on the distance margin of the data, the optimal hyperplane class prediction is defined. If the hyperplane is not optimal., misclassification is bound to occur. Apart from classifications, it is used for regression. With SVM, a hyperplane is introduced to separate the adjacent classes.
2.3.5. Accuracy Assessment
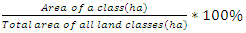
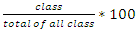
- Accuracy assessment determines how well a classification process has been successful. The procedure compares how the classified classes accurately defines the land cover obtained from the training data [30]. Using error matrix, the overall accuracy, errors of omission, errors of commission, user’s accuracy, producer’s accuracy and accuracy statistics (e.g., kappa) can be accessed. Error matrices produce effective representations of map accuracy since it shows the individual accuracies of each class label with the errors of inclusion and the errors of exclusion [30].The matrix is formed by classifying the sampled training set pixels and listing the known cover class used for training i.e., representing the columns, whilst the pixel actually classified into specific land cover class represents the row. Training set pixel classified accurately into land cover classes are found along the major diagonal of the error matrix. All non-diagonal elements of the matrix shows either errors of omission or commission. The overall accuracy is computed by dividing the total number of correctly classified pixels by the total number of reference pixels [15]. Beside the overall accuracy, user’s accuracy and producer’s accuracy are two approaches where accuracies of the individual class can be computed. Producer’s accuracy describes how well a particular area has been classified. It comprises of an error of omission which measures the portion of observed features on the ground that are not classified in the map. The less errors of omission exist, the higher the producer’s accuracy. Mathematically,
 | (1) |
 | (2) |
 | (3) |
 | (4) |
 is computed as
 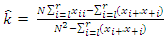 | (5) |
 | (6) |
 | (7) |
 | (8) |
 | (9) |
2.4. Software
- Listed below are the computer software used to analyze and derive results, maps, charts and calculations for the project. • Google Earth Engine (GEE)• RStudio (R)• Quantum GIS (QGIS)• Microsoft ExcelRStudio is a free and open-source software for data science, scientific research and technical communication. It comprises of a console, syntax-highlighting editor that supports direct code execution, and also tools for visualization, history, debugging and workspace management. RStudio have been used for several articles, amongst them is time series air quality forecasting [31]. In summary, Landsat 7 and 8 imageries were obtained and clipped using the shapefile for Ashanti region. Using GEE, Image pre-processing was done to correct for clouds and shadows. The least cloudy imagery in the region was obtained with the JavaScript code. After the corrections, RF and SVM classifiers were applied on the Landsat imagery using training and validation samples points from Google Earth. Exactly 70 percent of the reference points were used to train the classifier whilst 30 percent were used to validate the results. Producer accuracy, user accuracy, kappa and overall accuracies were then computed in the GEE. Classification images were displayed on GEE. Using the pre-processed images data downloaded from GEE, it was imported into RStudio and both RF and SVM classification was applied to obtain an error matrix. The results were imported to Microsoft Excel as tables. Using formulae, computations for percentages and charts were developed in the Microsoft Excel. Final maps were made using QGIS with the Geotiff files downloaded from GEE dataset (Figure 3 and Figure 4). Figure 2 displays the flow chart of the methods.
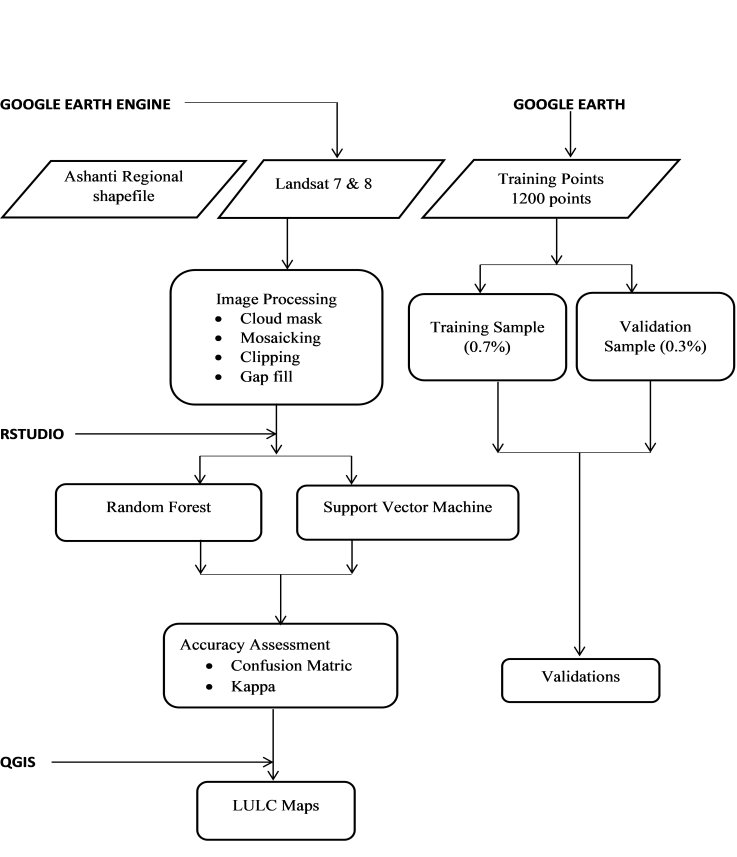 | Figure 2. Flow Chart of Method |
3. Results
3.1. Land Use Land Cover
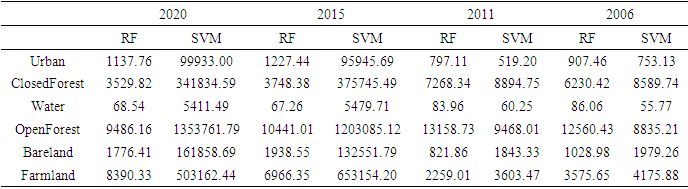
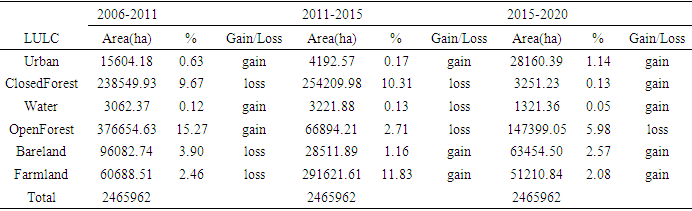
- Four LULC maps were produced for both RF and SVM for the years 2006, 2011, 2015 and 2020 as displayed in (Figure 3 and Figure 4). RF and SVM classification methods produced results within the acceptable accuracy range using both confusion matrix and kappa statistics [32] whilst using either GEE or RStudio. Six LULC were identified and classified for each year. The LULC were closed forest, open forest, water, urban, farmland/grassland and bareland. Over the years, Ashanti region was dominated by open forest. It covered the highest total land area of 54.9% for SVM in 2015 and 54.0% for RF in 2011 using results from GEE. Farmland and closed forest followed next interchangeably. Water bodies occupied the least land surface area throughout the years thus, representing 0.2% or 0.3% of the total land area within the study period. The water bodies comprised of Lake Bosomtwe, Owabi dam, Barekese dam, rivers and pools of water. All the above results were based on GEE. The areas of the various LULC using RF and SVM are shown in (Table 2) below.
|
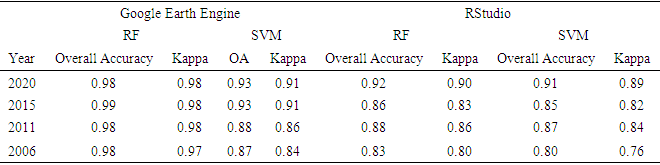
3.2. Accuracy Assessment
- A complete classification is said to be done when accuracy assessment is complete and found within the accepted range. As mentioned early on, confusion matrix and kappa statistics were used to determine the accuracy of the classification methods [32]. This was done on both GEE and RStudio. The results for the confusion matrix and kappa statistics are displayed in (Table 3). The best results are seen using Random Forest classifier with both Google Earth engine and RStudio. Random Forest proved to have finer accuracies throughout the years for both the overall accuracies and for the kappa statistics. Again, by using both the producer’s accuracy and the user’s accuracy from the confusion matrix, Random Forest gave relatively finer results as compared to Support Vector Machine. The number of pixels that Random Forest classified completely right (i.e., 100%) were more than that of Support Vector Machine in both GEE and RStudio. The differences in results using GEE and RStudio is because aside the basic parameters which both software shared, there were additional parameters to engage with each software that were unique to each software. Example is RStudio run a code on its classifiers called mtry to select optimal accuracy using repeated and random variables which GEE lacks. But the results from both software made it obvious that RF stood finer than SVM.
|
4. Discussion
4.1. Changes in LULC over the Period
- The main objective of the research was to use Google Earth Engine cloud computing platform to analysis the spatio-temporal change in forest cover in one of the developed regions in Ghana, West Africa using Random Forest algorithm and Support Vector Machine. The various LULC changes could be derived by using the GEE. From the Figure 3, Figure 4, Table 2 and Table 4, it is obvious that there had been changes in the spatial patterns over the years. Under the Sustainable Development Goal indicator 15.1.1, forests are to be efficiently managed [10]. In the research, it was observed that there had been an increase in open forest from 2006 to 2015 but a significant decrease in open forest from 2015 to 2020. Reasons for the losses were associated with an increase in farming and farming activities from the year 2015 to 2020 in the region. Open forest was lost to mainly to farmlands. Ashanti region lies third place when it comes to annual value of crops harvested and sales by region with about 71% of the farming being crops. Farming is practiced almost everywhere within the region i.e., ranging from large scale to small scale (backyard gardens). The regions copping systems are Traditional (Maize/Cassava/plantain), Tree crops (cocoa, citrus, oil palm, citrus) and newly emerging cash crops (rice and vegetables). The Ministry of Food and Agriculture (MOFA) in collaboration with other agricultural agencies have in the past years invested extensively in the agricultural sector in the region. There have been free or subsidized provisions for farm tools, equipment and fertilizers, incentives and loans for farmers over the years under the Agricultural Policy Support Project. Another reason for the increase in farmlands is the introduction of the policy titled “Planting for food and jobs (PFJ)” by the government [35]. These policies have added up significantly to faming activities through its provisions and services and has subsequently increased farmlands in the region [36]. Agriculture in the region has therefore become very lucrative and considerable number of people have gone into farming. All these and more have made people and companies interested in farming and as a result the increase in farmlands. [37] in their article to find out what is driving deforestation came to a conclusion that agriculture dominated land cover in Ashanti region over the 29-year period of study i.e., from 1986-2015.
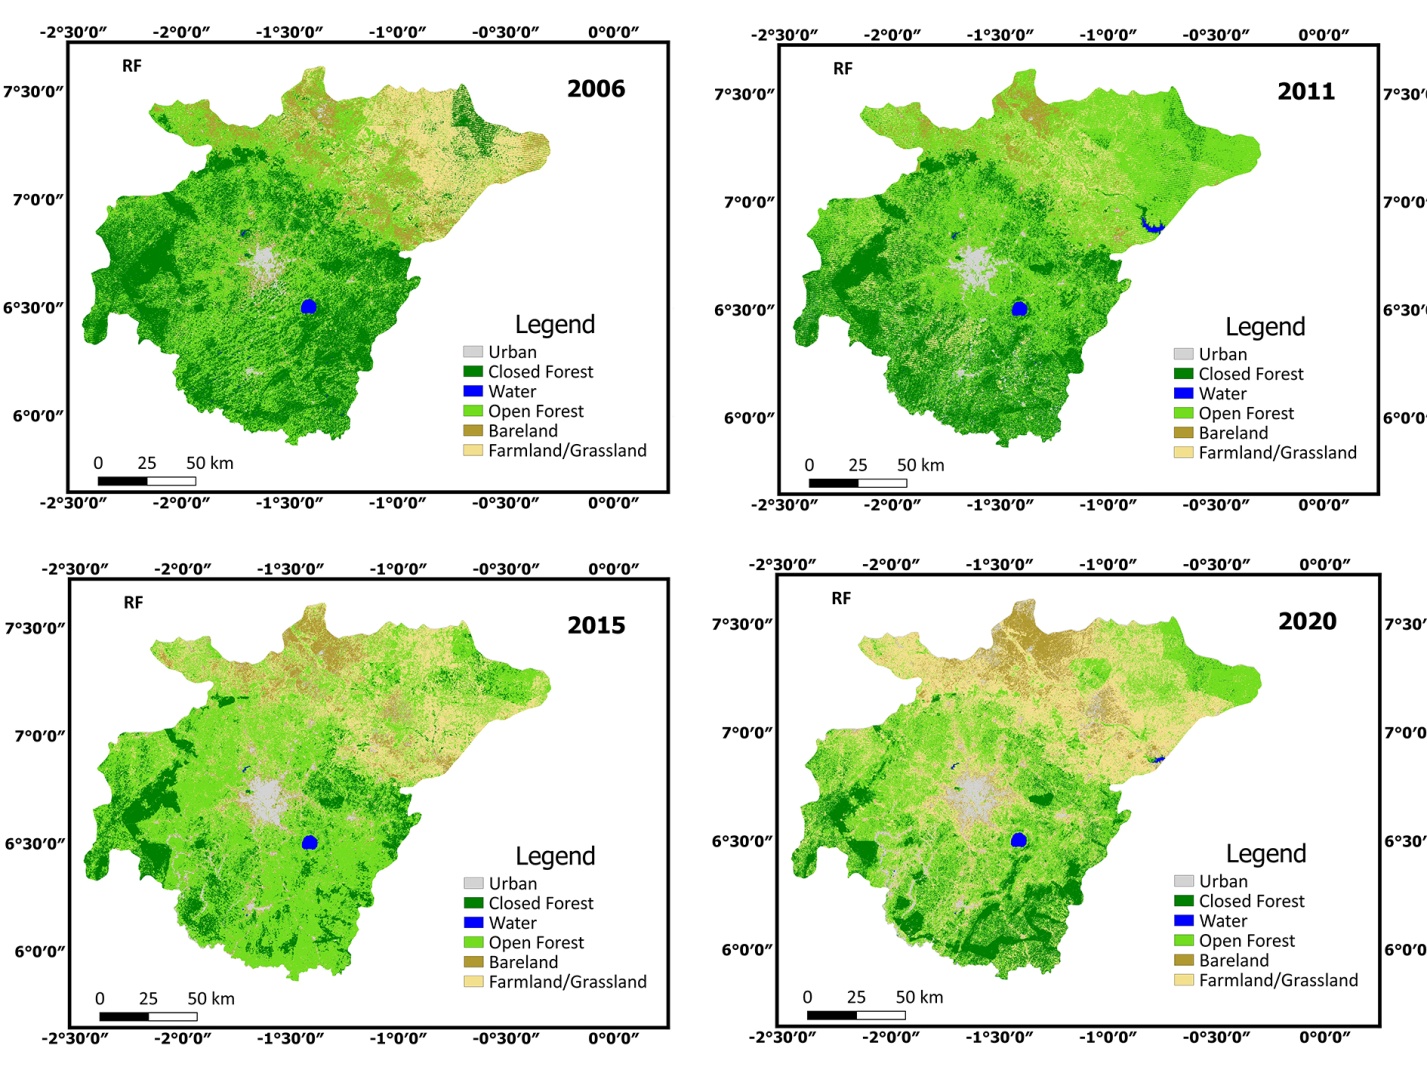 | Figure 3. LULC Maps using Random Forest for 2006, 2011, 2015 and 2020 |
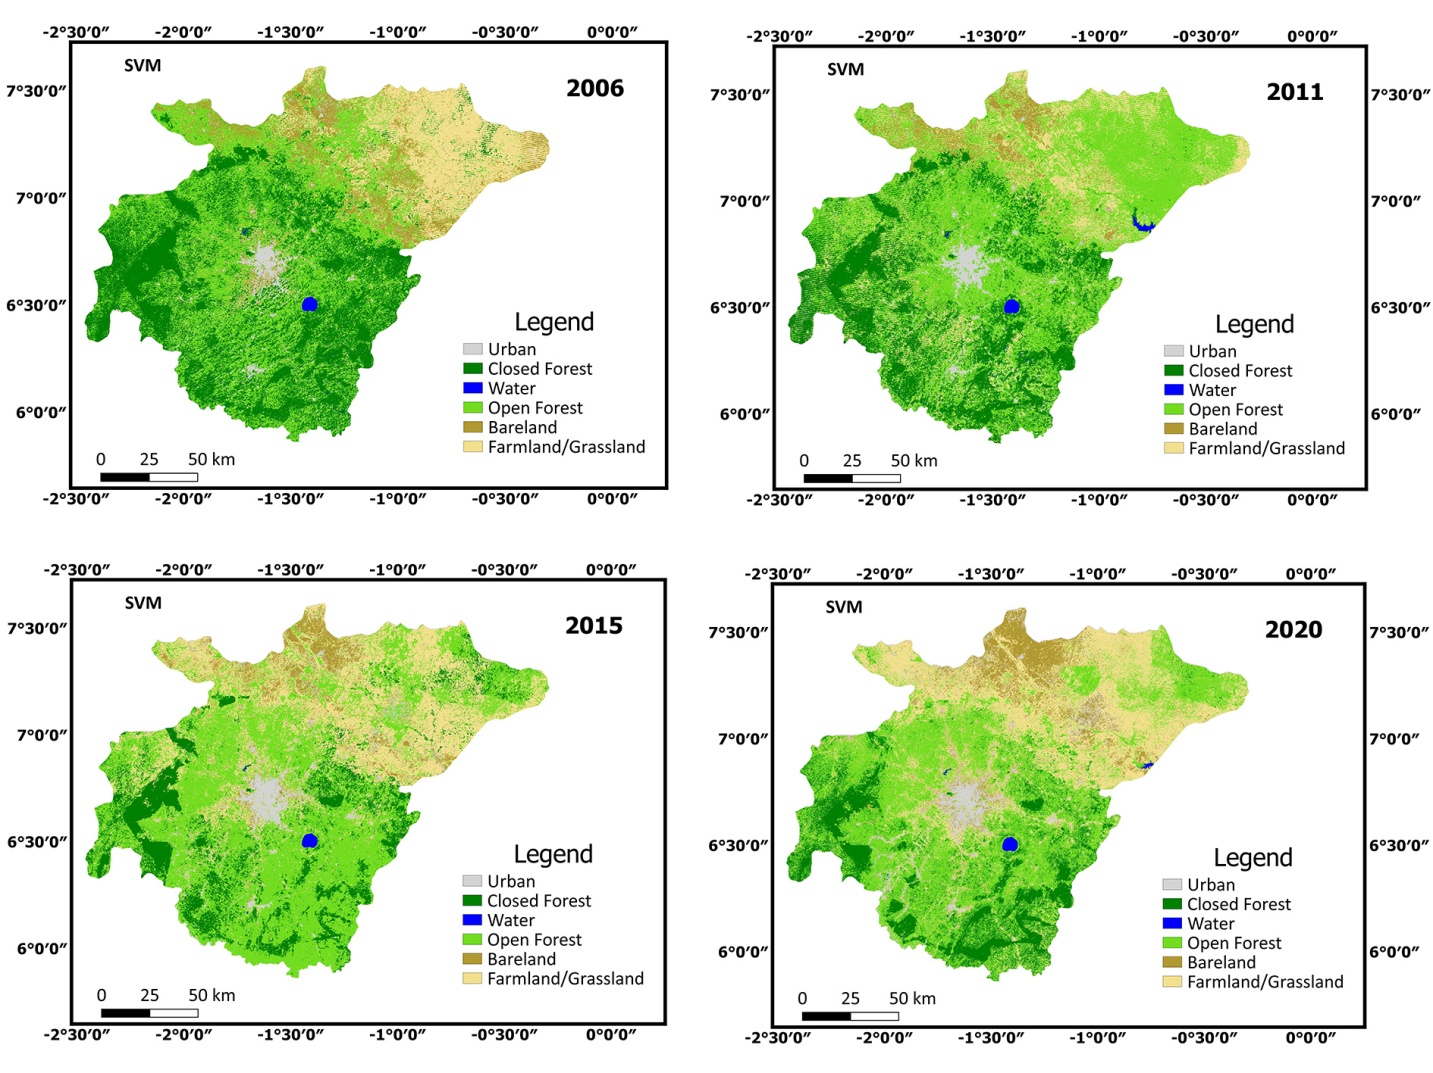 | Figure 4. LULC Maps using Support Vector Machine for 2006, 2011, 2015 and 2020 |
|
4.2. Google Earth Engine and Accuracy Assessment
- The results of this study confirms that GEE is appropriate to analyse spatial change in LULC using RF and SVM. The overall accuracies indicated the efficiency of the two algorithms used for the classification. The RF classification uses multiple random decision trees, which makes a more accurate classification decision based on related features [24]. It displays a high performance and shows a low tendency of overfitting [44]. It therefore produced more stable and robust results using either GEE or RStudio as displayed in (Table 3). Accuracy standards used were the overall accuracy and the kappa statistics. [26,44] compared four classification algorithms for cropping activities and RF classifier obtained the best results.
5. Conclusions
- Google Earth Engine through its Application Programming Interface (API) was successfully used to explore and process supervised image classification on the Landsat imagery. The API’s provided functions which readily provided geoprocessing tools for analysis. With its readily inbuilt tools, it provided functions for easy manipulation of data such as data visualization, data queries and data analysis. RF came up best in the research compared to SVM in classifying forest cover. Analysis of LULC classes over the assigned period indicated various changes in the region and was consistent with both data from the Ghana Statistical Service [22] and previous conducted studies [45]. Knowledge about the respective land cover classes can inform the responsible agencies to be abreast with current situations on the ground and this can aid them in their long-term decision processes. It can therefore be concluded that the outcome of the research is relevant to stakeholders in making informed decisions about forest management and its sustainability with using GEE cloud computing platform.
ACKNOWLEDGEMENTS
- The authors thank Professor Edward Matthew Osei Jnr and Sylvia Esi Otchere for their guidance, comments and suggestion throughout the course of this research.