-
Paper Information
- Paper Submission
-
Journal Information
- About This Journal
- Editorial Board
- Current Issue
- Archive
- Author Guidelines
- Contact Us
American Journal of Geographic Information System
p-ISSN: 2163-1131 e-ISSN: 2163-114X
2022; 11(2): 33-40
doi:10.5923/j.ajgis.20221102.01
Received: Sep. 20, 2022; Accepted: Nov. 19, 2022; Published: Nov. 24, 2022

Comparison of NDVI Values from Multiple Satellite Sensors to Monitor for Public Health in an Urban Sub-tropical Setting
 Abstract
 Reference
 Full-Text PDF
 Full-text HTML
Julius R. Dewald1, Jane Southworth2, Scott C. Brown1, 3, Jose Szapocznik1, 3
1Department of Public Health Sciences, University of Miami Miller School of Medicine, Miami, FL, USA
2Department of Geography, University of Florida, Gainesville, Florida, USA
3University of Miami School of Architecture, Coral Gables, FL, USA
Correspondence to: Julius R. Dewald, Department of Public Health Sciences, University of Miami Miller School of Medicine, Miami, FL, USA.
| Email: |  |
Copyright © 2022 The Author(s). Published by Scientific & Academic Publishing.
This work is licensed under the Creative Commons Attribution International License (CC BY).
http://creativecommons.org/licenses/by/4.0/

Normalized Difference Vegetation Index (NDVI) is commonly used as a measure of greenness in public health research. Changes in NDVI over time in urbanized areas have been linked to improvements to multiple chronic conditions. Studies have been conducted using ASTER or Landsat, but their equivalence has not been established. To determine the equivalence or lack thereof between ASTER and Landsat, and between Landsat 7 and 8, this study compares NDVI values from ASTER, Landsat 7, and Landsat 8 satellite sensors at different times of the year (Fall and Spring) and at different locations in Florida (the City of Miami and Polk County). Although other studies have examined how Landsat and ASTER NDVI values compare, no study has explicitly investigated how NDVI values differ across ASTER and Landsat for urban areas. A comparison of the scatterplots of ASTER with Landsat satellite sensor NDVI scores, produced R2 values consistently above 0.75 with p-values less than 0.001 across both locations and times of the year, indicating that Landsat and ASTER-derived NDVI values share considerable variance. By repeating these analyses separately by season and location, we demonstrated that the relationship between Landsat and ASTER NDVI varies more by season than location within urban subtropical settings. These findings suggest that studies comparing NDVI values from these different satellite sensors would require calculating separate coefficients for each season.
Keywords: NDVI, Vegetation, Landsat 8 OLI, Landsat 7 ETM+, Remote Sensing, ASTER, Comparison
Cite this paper: Julius R. Dewald, Jane Southworth, Scott C. Brown, Jose Szapocznik, Comparison of NDVI Values from Multiple Satellite Sensors to Monitor for Public Health in an Urban Sub-tropical Setting, American Journal of Geographic Information System, Vol. 11 No. 2, 2022, pp. 33-40. doi: 10.5923/j.ajgis.20221102.01.
Article Outline
1. Introduction
- Understanding how greenness indices, such as Normalized Difference Vegetation Index (NDVI), differ across satellite sensors is critical to understanding the extent to which findings across studies may differ as a function of different satellite sensors. Studies that rely on any measures of greenness, especially temporal ones, must often account for differences across sensors due to different sensors being available across different time periods. An example of such research is found in studies relating greenness to human health. Previous research has shown that higher NDVI predicts lower BMI, lower risk of being overweight or obese [1,2], decreased cardiometabolic conditions [3], and reduced cardiovascular disease [3-5]. For example, our prior research investigated how NDVI relates to chronic medical conditions in urban Miami, Florida, using U.S. National Aeronautics and Space Administration (NASA) Advanced Spaceborne Thermal Emission and Reflection Radiometer satellite (ASTER) data [3,5,6]. These studies have shown that higher mean NDVI, compared with lower mean NDVI, was associated with reduced risk of diabetes and reduced odds of acute myocardial infarction, ischemic heart disease, heart failure, and atrial fibrillation, as well as Alzheimer’s disease and depression [3,5,6]. These cross-sectional studies all used ASTER satellite imagery to calculate and track changes in NDVI through time. However, future longitudinal research linking trajectories of greenness to health outcomes will rely on Landsat 7 and Landsat 8 data (NIH grant R01HL148880 and NIA grant RF1AG0743607). Hence, if different results were obtained using ASTER and Landsat satellites, it would be useful to understand the comparability of NDVI values derived from the ASTER and Landsat satellite sensors.Although ASTER provides higher resolution imagery than Landsat (15m resolution for ASTER and 30m for Landsat), Landsat has a broader swath width and an extensive historical archive. Furthermore, Landsat imagery has more processing levels than ASTER. Processing refers to the types of calibration and corrections the controlling agency performs upon the satellite imagery before it is made available to the public. Landsat data can be obtained at a high level of processing where the imagery has been georeferenced using ground control points, elevation data provided by various digital elevation models, and payload correction data collected by the spacecraft and sensor [7,8]. Landsat data also comes with quality reference data that identifies each scene's cloud and shadows [7,8]. This makes it possible to identify clouds and remove them through built in automated processes for each image which makes working with large amounts of Landsat data easier compared to ASTER data— which does not have the same level of processing and does not come with pre-identified clouds and cloud shadows. Previous research has already compared Landsat 7 to ASTER-derived NDVI and found that the values differ between the two sensors. The difference was due to ASTER's higher reflectance in the red band and lower reflectance in the near-infrared band than the Landsat 7 ETM+ sensor [9]. Comparing the NDVI values between the two sensors revealed that the ASTER sensor had NDVI values 8.1% lower on average than the NDVI values obtained from the Landsat 7 ETM+ sensor [10]. Most previous studies have examined how these sensors detect NDVI across various landcovers [11,12]. Despite these results, there has been a lack of studies comparing how the NDVI values from these two sensors compare in urban settings [13]. Further, no study has yet compared how ASTER and Landsat 8 NDVI values correlate when measuring vegetation greenness [12]. The primary focus of this study is to examine how NDVI values between ASTER, Landsat 7, and Landsat 8 satellite sensors compare in urbanized human environments found within Miami, Florida. Miami was chosen due to the usage of ASTER in previous cross-sectional studies that examined the relationship between changes in greenness and public health [3,6], and the importance of using Landsat in currently ongoing longitudinal studies. In addition to its processing capabilities, Landsat is useful for longitudinal studies because there are more frequent images, which makes it easier to match the same time of the year across multiple years. Furthermore, due to the subtropical setting of Florida, there was a more extensive selection of imagery when compared with more temperate urban locations such as New York City which is in a temperate ecological zone and only has a limited window of greenness before the senescence of vegetation during the winter. This is important to increase the pool of useable imagery to find nearly cloudless imagery across all three satellite sensors. Lastly, in addition to the direct comparison between Landsat and ASTER NDVI values, this study will also provide equations allowing for the conversion of ASTER NDVI to Landsat NDVI (both Landsat 7 and Landsat 8, respectively) to allow for direct comparisons across satellite sensors.Urban area was defined consistent with the United States Census Bureau classification that classifies separately Urbanized Areas (UAs) and Urban Places Outside of UAs (UPs). UAs are continuously built-up areas with a population of 50,000 or more, such as Miami, FL. UPs are built-up areas with at least 2,500 inhabitants that are not part of a larger UA. Accordingly, to evaluate transferability of these approaches, a second study location was also selected to represent a UP also in Florida. For this reason, the Northeastern corner of Polk County FL, was included in this study. This section of Polk County can be defined as a UP comprised of multiple small townships (Haines City, Davenport, and various unincorporated communities). This area also has similar environmental and climatic conditions to Miami, FL. Furthermore, both of these locations were chosen because prior research has examined the relationship between changes in greenness and public health [6]. Using these study areas this research compares ASTER and Landsat satellite imagery using generalized linear models to determine the compatibility of ASTER and Landsat in an UA and a UP area. Examining how Landsat and ASTER NDVI values compare in urban settings is useful to better understand differences between findings across these satellite sensors and to determine how to increase the comparability of such findings.
2. Materials and Methods
2.1. Data
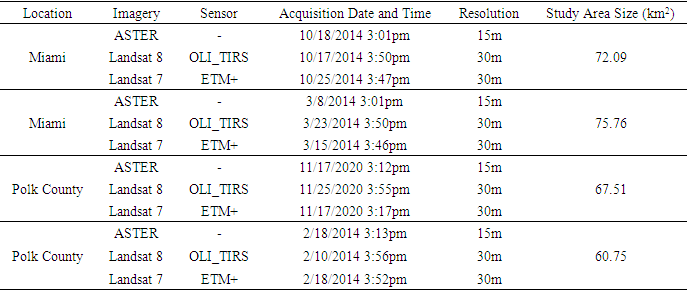
- This study relies on ASTER, Landsat 7 Enhanced Thematic Mapper Plus (ETM+) Instrument, and Landsat 8 Operational Land Imager (OLI) imagery. The ASTER data was downloaded from the EarthData website at Level 1B, and the Landsat data was acquired from the Earth Explorer website at Level 1. Images for these two locations were taken from two different times of the year (October-November and February-March) to replicate the study of the relationships between the NDVI values of the different satellite sensors across two seasons (Fall and Spring). Therefore, this study utilizes four images from each satellite seen in Table 1. Image sets and the seasons of Fall and Spring were chosen primarily based on the availability of cloud-free images across all three satellite sensors used in this study. The ASTER images were geometrically corrected to the Landsat imagery of each image set using first-order polynomials generated from various control points placed across the different image sets. This was done to perfectly match the ASTER to the Landsat pixels. Further, the ASTER images were resampled using bilinear interpolation to match the spatial resolution of the Landsat images.
|
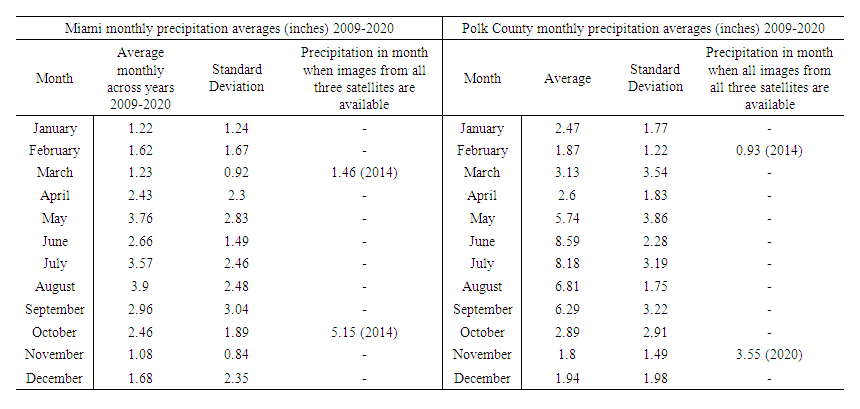 | Table 2. Monthly average precipitation and standard deviation across years 2009-2020; and precipitation for the month in which images from all three satellites were available – all in inches |
2.2. Study Areas
- All areas of cloud cover, Landsat 7 scan-line error, or open water were removed from the study areas as needed for each image set. The areas used to test the similarity between ASTER and Landsat 7 and 8 can be seen in Figure 1, these areas represent the study area before the removal of cloud cover or scan line error. For Miami, the constraining features rely on two main components. First is the boundary for the city of Miami, as provided by the City of Miami GIS Open Data Portal (https://datahub-miamigis.opendata.arcgis.com/). The second is areas classified as 'developed' by the 2013 National Land Cover Database (NLCD) (https://www.mrlc.gov/). The 2013 version of the land cover dataset was used to closely match temporally to the date of the imagery used for this analysis. For Polk County, the criteria for inclusion in this study are slightly altered. The individual cities within Polk County are substantially smaller than the city of Miami. Therefore, instead of a city boundary, all developed areas in the ASTER image footprint were used as defined by the NLCD dataset within Polk County. In reference to the November Polk County imagery set, the 2019 NLCD dataset was used for imagery for 2020. For Polk County, there was no cloud cover or scan line error within the study areas. The exact area of Polk County being used for this study is limited by the extent of the ASTER imagery within the boundary of Polk County itself. This intersection of boundaries results in only the northeastern corner of the county being used. We ran the analysis only after the final image sets were chosen for the study.
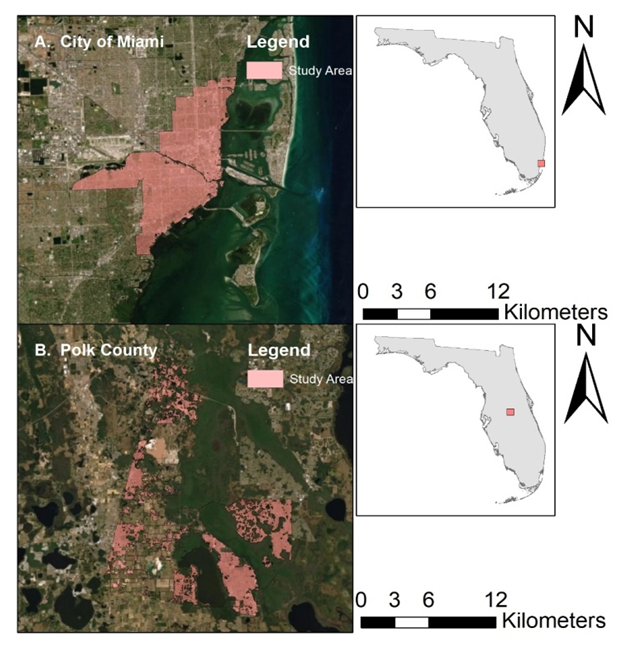 | Figure 1. Total study areas for the (A) City of Miami and (B) Polk County before cloud cover and scan line errors were removed per image set |
2.3. Radiometric Correction
- All imagery used in this study was first converted from the simple digital number (DN) to Top-of-Atmosphere reflectance. This is necessary as NDVI has to be calculated with reflectance values. The handbooks of ASTER, Landsat 7, and Landsat 8 provide models that have been commonly used in previous satellite comparison studies [7-10,12,13,19]. These models are used for this study as well. Landsat 7 and Landsat 8 have the following equation that can directly convert DN to reflectance values:
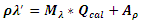 Where ρλ' is top of Atmosphere planetary reflectance, Mλ=Band-specific multiplicative rescaling factor from the metadata, Qcal is the cell value DN, and Aρ is the band-specific additive rescaling factor from the metadata [7,8]. Whereas the ASTER satellite data first needs to have the DN converted to radiance units using the following equation:
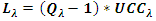 UCCλ is the unit conversion coefficient for band λ to convert DN to radiance, obtained from the ASTER User Handbook [19]. The UCCλ is in W/(m2*ster*μm)/DN. This spectral radiance was then converted to Top-of-Atmosphere planetary reflectance using the following formula:
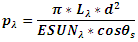 Referring to the above equation, ρλ is Top-of-Atmosphere planetary reflectance (%); Lλ is spectral radiance at sensor's aperture in W/(m2·ster·μm); ESUNλ is band dependent mean solar exoatmospheric irradiance in W/(m2·μm); θs is solar zenith angle in degrees; d is Earth-Sun distance in astronomical units [19]. These also can be found in the ASTER header files or the user handbooks mentioned earlier [19].
2.4. Vegetation Index
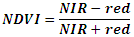
- As stated earlier, NDVI is the vegetation index that is commonly used in human health-related research due to its known relationship with higher NDVI predicting better health outcomes. NDVI is the ratio of the difference between the near-infrared (NIR) and red bands divided by the sum of NIR and red. The formula is expressed as:
2.5. Comparison and Equations for Conversion
- Comparisons using generalized linear models of the NDVI values between every satellite image were performed on a pixel-to-pixel basis within each image set. The number of pixels varies for each image set but is in the range of 75 to 85 thousand. Generalized linear models were performed for each combination of satellite imagery for every image set (i.e. Landsat 8 and ASTER, Landsat 7 and ASTER, Landsat 7 to Landsat 8). Any correlation with a p-value of 0.001 or less was considered significant. The coefficients of each generalized linear model were averaged for each study area to create conversion equations that can convert ASTER-derived NDVI into near equivalencies of Landsat NDVI values at each season. The final coefficients for the conversion equations were developed based on the average values of multiple correlation coefficients, for the same season. For example, the Fall conversion coefficients were developed by taking the average values of the coefficients from the Fall image sets for Miami and Polk County, separately.
3. Results
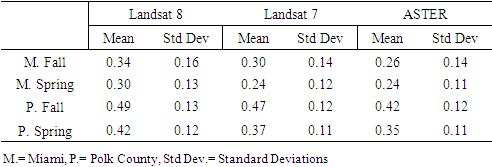
- As seen in Table 3, the ASTER NDVI values were generally lower than the associated Landsat 7 and Landsat 8 NDVI values. This disparity is consistent with prior research that has documented that the difference in red band detection and NIR wavelengths in a reduced NDVI score compared to Landsat 7 [9,10,12,13].
|
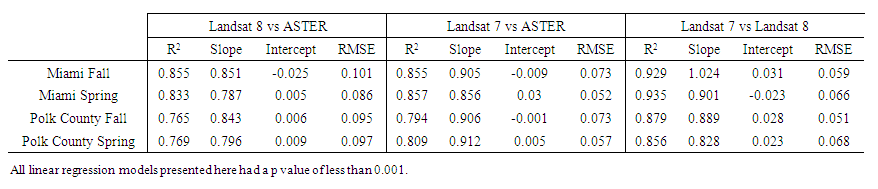 | Table 4. Generalized linear model results for the four different image sets of this study |
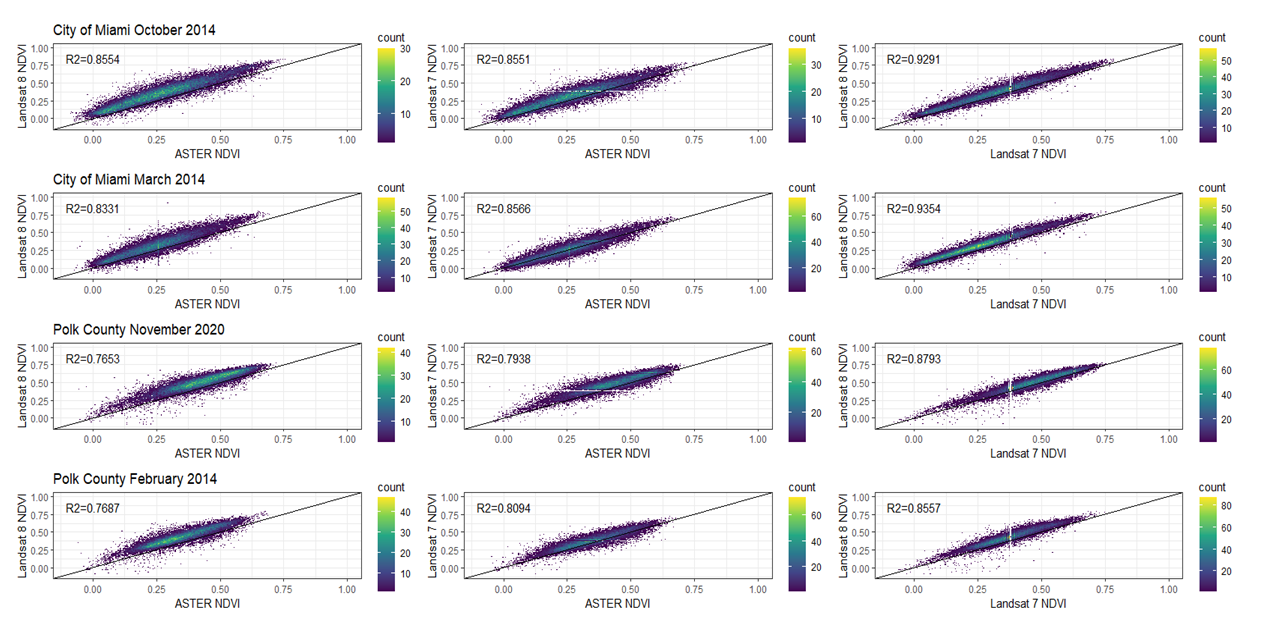 | Figure 2. Scatterplots relating NDVI values between the ASTER and Landsat satellite sensors across the four different image sets. Each scatterplot includes the associated R2 value for that specific comparison |
3.1. Converting ASTER and Landsat 7 NDVIs to Landsat 8 NDVI
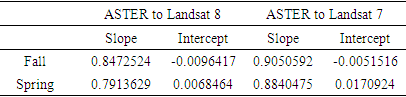
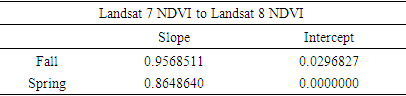
- The differences between the satellites appears to be sufficiently systematic and predictable, that it is possible to convert ASTER-derived NDVI to Landsat 8 or 7 derived NDVI using the averaged intercepts and coefficients found in Table 5. These coefficients represent near-perfect linear relationships. Although these intercepts and coefficients would only apply to the specific geographical areas included in the current study, they are similar to values seen in previous ASTER-Landsat comparison studies [10,13]. Lastly, intercepts and coefficients necessary to convert Landsat 7 NDVI values to Landsat 8 NDVI values are provided per season in Table 6.
|
|
4. Discussion
- A comparison of the scatterplots of ASTER with Landsat satellite sensor NDVI scores, produced R2 values consistently above 0.75 with p-values less than 0.001 across both locations and times of the year, indicating that Landsat and ASTER-derived NDVI values share considerable variance. By repeating these analyses separately by season and location, we demonstrated that the relationship between Landsat and ASTER NDVI varies more by season than location within urban subtropical settings. These findings suggest that studies comparing NDVI values from these different satellite sensors would require calculating separate intercepts and coefficients for each season.
4.1. Comparability Across Satellite Sensors
- Overall, the comparison between ASTER and the Landsat NDVI values within urban settings revealed that these different satellite sensors can be corrected to make their values comparable. ASTER NDVI values were generally lower than both Landsat satellite sensors across both study areas. These differences have been noted in previous studies and has been attributed to the differences in red band wavelengths in ASTER compared to the Landsat satellite sensors. Also, the Landsat 8 and ASTER NDVI comparison R2 values were lower than the Landsat 7 and ASTER comparisons. This difference is likely because Landsat 8 has narrower spectral bands, improved calibration, higher 12-bit radiometric resolution, and more precise geometry than Landsat 7 [21]. These differences affect NDVI values as the narrowed spectral bands result in higher NIR values. Previous research that compared the NDVI values of these satellite sensors found that Landsat 8 NDVI values are generally higher than the associated Landsat 7 NDVI values in areas of lower vegetation cover [22]. This was found to be true within this study as well, as the average NDVI values of Landsat 8 were higher than those of Landsat 7, see Table 3. This study demonstrated that NDVI values in urban areas across ASTER, Landsat 7, and Landsat 8 satellite sensors are closely correlated and have relatively low intercept differences. The inclusion of Polk County revealed that differences in population density and thus availability of land for trees within built-up areas appear to have a similar magnitude of shared variance between NDVI values derived from ASTER and Landsat imagery. Although other research has also observed similar NDVI values between the satellite sensors in studies that included a range of population densities [12], this study is the first to focus specifically on urban areas. Finally, according to these results, direct comparisons of NDVI values from ASTER to Landsat 7 or Landsat 8 should include corrections for slope and intercept to ensure comparability across satellite sensors. Thus, future health/greenness studies that use Landsat based NDVI results can increase the comparability with ASTER-based NDVI results by deriving slope and intercept corrections to ensure comparability across ASTER and Landsat using the methods presented here.
4.2. Climatic Environments
- The coefficients used for conversion from ASTER to Landsat NDVI may not generalize for all locations in the subtropics. However, at least within subtropical urban areas, seasonality is likely more important than location, with different seasons requiring different correction coefficients. For each season, general linear models would need to be developed to establish the slope and intercept to compare across satellite sensors. As stated earlier, this study focused on subtropical urban settings. Examination of how these satellite sensors compare in other settings, such as temperate environments which rely on previous ASTER-Landsat NDVI comparisons, have been conducted in temperate locations in China. However, these studies did not specifically look at how NDVI across these satellite sensors compare in urban environments. Nevertheless, these studies also found that the NDVI values between the different satellite sensors were also strongly correlated [10,12,13,23].Despite a lack of an ASTER and Landsat comparison for urban areas in a temperate environment, the results of this study indicate that Landsat-derived NDVI is an adequate replacement for ASTER-derived NDVI, so long as the appropriate conversion equation is used. Landsat imagery has the advantage of a more extensive library of more frequent imagery to rely on, a greater degree of processing and extra informational layers that delineate areas of cloud cover and cloud shadows for each image. Studies that examine changes in greenness over longer stretches of time (20 years or more) will benefit from the extra level of processing that Landsat’s more frequent imagery provides.
4.3. Method for Conversion
- Lastly, this research outlines the methods required for potential future research that would need to compare NDVI values across ASTER and Landsat satellite sensors. Given the different corrective equations for Fall and Spring image sets, the coefficients are clearly season-specific. However, the method developed here is transferable across sites and therefore useful to other research comparing different geographic areas. This in of itself is an important finding and a significant caution to others who are utilizing multiple satellite sensor data sources within a single study.
4.4. Future Research
- Future research will investigate if the differences across satellite sensors by seasonality can be replicated in temperate urban environments, although it is reasonable to suspect that urban NDVI values between ASTER and Landsat satellite sensors are likely to remain strongly correlated in these locations. Future work will also expand the current research for other subtropical locations in different countries and continents, particularly in the Global South.Funding: This work was funded in part by grants R01HL148880 and RF1AG0743607 to Scott C. Brown and José Szapocznik at the University of Miami. Data Availability Statement: NDVI data created for this study will be uploaded on to Dryad Digital Repository upon publication of the manuscript.Acknowledgments: Not applicable.Conflicts of Interest: The authors declare no conflict of interest.