-
Paper Information
- Paper Submission
-
Journal Information
- About This Journal
- Editorial Board
- Current Issue
- Archive
- Author Guidelines
- Contact Us
American Journal of Geographic Information System
p-ISSN: 2163-1131 e-ISSN: 2163-114X
2022; 11(1): 9-22
doi:10.5923/j.ajgis.20221101.02
Received: Jun. 10, 2022; Accepted: Jul. 1, 2022; Published: Jul. 15, 2022

Mapping Land Use Land Cover Changes from 1990 to 2020 in River Kuja Basin, Kenya
 Abstract
 Reference
 Full-Text PDF
 Full-text HTML
Vincent Ogembo Obuya, Lorna Grace Okotto, Julius Manyalla, Joseph Okotto-Okotto
School of Spatial Planning & Natural Resource Management, Jaramogi Oginga Odinga University of Science and Technology, Bondo, Kenya
Correspondence to: Vincent Ogembo Obuya, School of Spatial Planning & Natural Resource Management, Jaramogi Oginga Odinga University of Science and Technology, Bondo, Kenya.
| Email: |  |
Copyright © 2022 The Author(s). Published by Scientific & Academic Publishing.
This work is licensed under the Creative Commons Attribution International License (CC BY).
http://creativecommons.org/licenses/by/4.0/

Land use land cover changes cause serious challenges to management of natural resources in river basins. This comes in form of depletion of water resources, land use conflicts, haphazard developments and is also a climate change driver. This study sought to investigate the Spatio-temporal changes of land use/cover in River Kuja basin. The objective was to map the changes on the land surface to generate data and information that could inform design of conservation and policy measures that can be used to conserve the water resources within the basin. The study used thirty years period with four (4) decadal satellite images of 1990, 2000, 2010 and 2020. The images were downloaded and pre-processed to 1G level as a GeoTIFF single band and eight (8) bit files. Ground truthing was done to verify actual ground features. Land use/cover changes were calculated as a percentage and translated to square kilometers and presented in a clear map showing variations over the decadal periods. The research hypothesized that there would be no significant Spatio-temporal changes in land use/cover types that can be attributed to the degradation of water resources between 1990 and 2020. The hypothesis was tested using Paired Sample t-test. The study showed land use change in the basin during the period under study. The null hypothesis was therefore rejected. Water bodies reduced from 41sq.km to 35sq.km, a decrease of 12.20%, forests decreased by 50.8%, shrubland decreased by 63.3%, bare land decreased by 34.3%, while agriculture increased by 231.2%, urban built-up areas increased by 223.6%, and grassland increased by 27.4%. The study indicates that the main causes of land use land cover changes in this basin include sugarcane production, population growth, infrastructural developments, climate change and land tenure insecurity. As such, there is a need to design conservation and policy measures to conserve the water resources within the basin.
Keywords: Land use Land cover, Land cover Classification, Satellite images, River Kuja Basin
Cite this paper: Vincent Ogembo Obuya, Lorna Grace Okotto, Julius Manyalla, Joseph Okotto-Okotto, Mapping Land Use Land Cover Changes from 1990 to 2020 in River Kuja Basin, Kenya, American Journal of Geographic Information System, Vol. 11 No. 1, 2022, pp. 9-22. doi: 10.5923/j.ajgis.20221101.02.
Article Outline
1. Introduction
- Land use primarily encompasses the economic and cultural uses including agriculture, residential, recreational, commercial, mining, industrial, social status activities at a given place or on a given piece of land. Land use in most cases is determined by ownership and as such public land use and private land uses are likely to be very different. However, there are instance where some public lands are used for private activities [1]. A good example is riparian lands which are in most cases used by members of the community hosting the lands for their private use such as farming, production of bricks or planting of trees. Land use determines the land cover. Land cover on the other hand deals with the observable biophysical cover on the surface of land. It does not only refer to vegetation that covers the land but also the soils, groundwater, surface water and biodiversity [2]. It is argued that land cover should be limited to vegetation and man-made features on the earth’s surface. That definition thus cuts out places consisting of bare rock or naked earth surface and a description of the land as opposed to land cover. Within the same lenses, water surface are arguably not land covers. Fundamentally, land cover should mean something that covers the surface of land, whether it is natural or man-made and therefore all farm crops, forests, shrubs, infrastructure such as roads, rails, dams, residential or commercial premises, pavements, airports/strips, stadiums, swimming pools and the likes are land covers albeit artificial [3]. The performance of ecosystem services is directly linked to the type and intensity of land use and land cover and associated management practices in a given area. In other words, what defines land cover depends on land uses and the management practices which goes into the land use [4]. This explains why changes in land use and land cover can alter the supply of ecosystem services and affect the well-being of both human beings and nature. Several factors define land cover namely anthropogenic activities (land use), geographical location, altitude and morphology [5]. With the constantly changing land use, there is a corresponding land cover change with the same magnitude. The cumulative effects of changes in land use and land cover translates to changes in the watershed function, river basin morphology and the cascading system; water and air quality, wastes generation, quality of the ecosystem, climate and human health in the long run [5]. Abella [6] deduced that it is imperative to underscore the fact that land cover cannot be understood in any dimension without delving into the concept of land use because land cover is a function of land use and so is the change in land use [7]. Any in interest in land cover must therefore trail land use.Land use planning and management is directly and strongly related to the characteristics of hydrologic circulation. The hydrological cycle on the hand is a determinant function in the characteristics of the cascading system of a river basin. Land Use/Land Cover (LULC) change is therefore one of the elements that directly impacts on the watershed hydrological cycle [8]. It is widely evident that anthropogenic activities cause LULC change and subsequently impose a huge impact on the hydrological processes and water resources in a river basin. Garg [9] studied “Human-induced land use land cover change and its impact on hydrology,” and established that the water supply and the hydrological cycle diminished as a result of LULC change that was worsened population pressure and development along river basins that was increasing rapidly [10].Tuffa [11] identified LULC changes and population pressure on natural resources as some of the most common problems in developing countries since their economic development mainly depends on agriculture. Ethiopia for instance has recorded, in increase in human activities leading to expansion of agricultural land, harvesting of timber, and urbanization over the past 40 years [12]. The study further observed that increased deforestation in southeast Ethiopia resulted in varied changes in land use and corresponding land cover, thereby affecting the local watershed hydrological cycle causing flood vulnerability of various sub watersheds within the region. According to [13] the changes in the natural vegetation and physical soil conditions are typically the prime cause of changes in the characteristics of rainfall-runoff of the local catchments, which consequently change the river cascading system [14]; [15]. Several studies show that the changes in vegetation cover, i.e., deforestation, lead to an increase in water yield and sedimentation but reduced capacities of water bodies within the basin. Literature identifies that land use alters the hydrodynamics of a river basin [16]. The changes in the land surface are attributed to anthropogenic factors. Therefore, integration of hydrodynamics modeling, Spatio-temporal analysis and socio-ecological factors is important in generating data and information that could be used to design conservation and policy measures to conserve the water resources within a basin. For the integration to yield results, land use classes must be mapped and the changes over a specified period of time computed. The changes, which must be related to the drivers, have not been studied within the study area especially in the aspect of planning and management of water resources in the basin. This study sought to assess the extent of land use land cover changes of River Kuja basin from 1990 to 2020. The study hypothesized that there would be no significant Spatio-temporal changes in land use/cover types that can be attributed to the degradation of water resources.
2. Literature Review
2.1. Land Use Land Cover Change
- Land use land cover change (LULC) is the temporal differences on land surface over a time period. Land use primarily encompasses the economic and cultural uses including agriculture, residential, recreational, commercial, mining, industrial, social status activities at a given place or on a given piece of land [17]. Land use in most cases is determined by ownership and as such public land use and private land uses are likely to be very different. However, there are instance where some public lands are used for private activities [18]. A good example is riparian lands which are in most cases used by members of the community hosting the lands for their private use such as farming, production of bricks or planting of trees. Land use determines the land cover. Land cover on the other hand deals with the observable biophysical cover on the surface of land. It does not only refer to vegetation that covers the land but also the soils, groundwater, surface water and biodiversity [19]. Mark [20] observed unusual increase in cropland within Shurugwi region in Midlands Province in Zimbabwe. Vast forested lands were converted to agricultural activities to provide food, charcoal for fuel, logs for constructing houses and animals’ pens, and other uses. Communal built-up settlements increased around Davangere City in India, a region with several water bodies. The drivers were mainly push for food security and scrub land [21]. [22] researched on land use changes in Kodaikanal Tamil Nadu. The study monitored the changes for a period of 40 years and concluded that built-up and agricultural areas increased with direct decrease in forested areas and water bodies.
2.2. Satellite Images on LULC
- Following accelerating land use and land cover changes, researchers strive to maintain an up-to-date objective and accurate LULC maps. All aspects of the land use and land cover changes are evaluated reliably through the use of remote sensing satellite data. [23], note that there are various techniques through which LULC can be characterized but remote sensing presents the most reliable, extensive and highly temporal and spatial resolution data. Remote sensing is presently the most accurate technology for examining different spectrally sensitive changes of the earth’s surface. The data acquired through GIS technology is equally imperative for sculpting other natural and cultural processes. Integrating remote sensing images with adjustable resolutions with the use of diverse descriptive models, has been used to acquire past, present and predict future land use and land cover patterns [24]. Satellite data in form or maps have been used over the years to assess LULC changes and the technology has been effective with regards to cost and time [25]. From the operational point of view satellite images taken by remote sensing has been successful in monitoring LULC changes [26]. The success is only based on comparing images of the same surface taken at different time. For any notable changes to be observed through satellite images, the timing should not be close. According to [27], best results have been obtained by comparing images of the same land area taken at least a decade apart.To improve the characterization and classification accuracy of land cover mapping, spectral indices are commonly used [28]; [29]. Some studies [30]; [31] have investigated the role played by landscape metrics in this discipline. Numerous other studies have, however, demonstrated a significant corves elation between LULC and landscape, and subsequently, between LULC and landscape metrics and the associated changes as well [32]; [33]. These studies investigated not only the degree of relationship of certain LULC and landscape metrics, but also the effects of the scales and classifications on the landscape metrics themselves. According to [34], landscape metric parameters established through satellite imaging are commonly used to indicate biodiversity, water quality and land cover changes over time. They provide a set of spatial tools for analyzing Landscapes and their arrangement and properties of their morphological and topographical features. These metrics, can provide information about the LULC over a long period of time. Furthermore, the landscape metrics of interest can provide quantitative values through which certain features can generally be described. Because of these properties, landscape Satellite images can provide additional information that improves LULC classification [35]. Satellite images are generated through integrating Geographic information system (GIS) and remote sensing technologies. According to [36], GIS and remote sensing can help with mapping spatial location and real-world features and visualizing the spatial relationship among the features. For instance, GIS can help to visualize where some types of natural resources are and how human respond to their occurrence within their reach (LULC). This can help with raising a red alert if the occurrence of such natural resources or the human response to their occurrence (e.g. Sand & Sand harvesting) is anything of an alarm eg (flash floods).. GIS and Remote Sensing can also help with mapping spatial location and real-world features and visualizing the spatial relationship among the features.
2.3. Drivers of Land Use Change
- Changes in LULC is a consequence of numerous factors interacting on the surface of the land. These factors either originate from human activity or natural forces. Among the human activities, the size and population growth plays a major role, but it is not the only triggering human cause of LULC changes [37]. The effects of population growth can be magnified or weakened by institutional factors and national and regional policies, as well as processes of globalization, all of which shape economic opportunities within a region. In West Africa, populations respond in multifaceted and interrelated ways that eventually affect land use and land cover patterns. For example, the progressive integration of West Africa into a global market economy has added pressure to expand foreign investment in the mining and timber industries of the Guinean forest countries, resulting into increased rate of forest loss [38]. This demonstrates that land uses are partially defined by demands informed by need for merchandise for international trade. Structural adjustment innovations have stimulated agricultural specialization toward several cash crops, such as cotton and peanuts in the Sahelian countries. These crops have been substituted with a more diverse mix of local grains and tubers. Moreover, increasing household income of the growing population affects consumption patterns, for example, there has been increasing demand for processed food such as meat, and dairy from the wealthy urban populations. Consequently, land use and exploitation of natural resources has been intensified to meet the growing demand [39].Natural factors also drive significant changes in LULC. Climate change is the most dynamic natural factor which affects land cover at decadal time scales. The elements of climate changes which induce LULC changes include recurrent and persistent drought conditions in Arid and Semi-Arid Lands (ASALSs) in many parts of the world including Sub-Saharan Africa [40]. Empirical evidence [41] shows that chronic and severe drought has directly changed the land cover by shrinking water bodies, desiccating soils, stressing the vegetation, and exposing bare soil and sandy substrate to intensive erosion. Indirectly, it has changed land use because people are not able to use the land for crop farming whether for commercial or subsistence purposes and neither for foraging by livestock. They are subsequently forced to find alternative ways of securing their livelihoods, which in turn leads to a change in the land use and land cover. The threat of drought to agriculture in the Sahel forced farmers and pastoralists to migrate from the drought affected areas toward more humid stretches of land, or into the urban centers to search for alternative livelihood. In other instances, the combined pressure of drought and population growth has stimulated investments in soil and water conservation, and in agricultural escalation in places like southern Niger and central Burkina Faso [42].Climate change has also led to torrential rainfall which often cause devastating effects such as landslides, and flash floods [43]. Flash floods on the other hand cause huge changes on the land cover and land use. Reports have been made of cases of permanent displacement of people due to rise in L. Victoria level or river draining their waters into the lake [44]. Consequently, some agricultural activities along the rivers and the lake basin are done amidst fear of floods. In conclusion, the literature reviewed here have shown that the characteristics of any river basin are a function of land use and land cover in the river basin, population growth and climate change. This study looking at mapping the temporal changes in LULC, is therefore key in providing information that can help in planning for conservation and management of the Kuja basin’s natural resources.
3. Methodology
3.1. Study Area
- The study was conducted in River Kuja basin in Kenya (figure 3.1). It is an extensive basin spanning from Kiabonyoru highlands in Nyamira County downwards to Lake Victoria. It lies within coordinates 0.65°S 43.97°E (34.883110 -0.996036 Decimal Degrees) and has a total length of 147 km. The basin is averagely 2,000m above the sea level but rises to 3,000m above the sea level at its source in Nyamira.
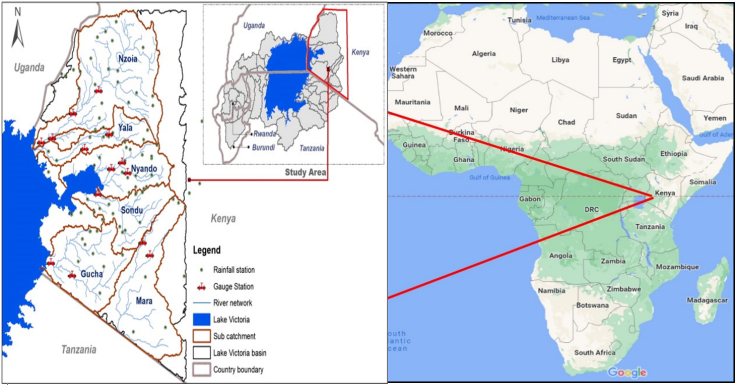 | Figure 3.1. Map of River Kuja Basin (Source: Gucha-Migori basin IWRM Plan) |
3.2. Methods
- Methods employed to achieve the desired objective of land use land cover mapping for river Kuja entailed a couple of sequential steps; Data acquisition, Data processing, Training Data collection, Image classification, Accuracy assessment and Change detection. The data used on Spatio-temporal changes on land use land cover included a thirty-year decadal satellite images 1990, 2000, 2010 and 2020, Digital Elevation Model (DEM) of resolution 30m x 30m, soils in the basin, field surveys data and basin shapefile. The study area was first delineated using DEM data and river shapefile. It was measured by acquiring remotely sensed satellite images of River Kuja basin and ground truthing processes. The images were captured over different times and compared while considering different temporal phenomena like water bodies, agriculture, forests, shrub land, urban areas and grassland. The different classes were analyzed and results presented and discussed.Thirty years with four (4) decadal satellite images of 1990, 2000, 2010 and 2020 were downloaded and pre-processed to 1G level as a GeoTIFF single band and eight (8) bit files. The images were sourced from www/http/landsat.usgs.gov. Full Scene digital Landsat Thematic Mapper (TM) and Landsat Enhanced Thematic Mapper/ Plus (ETM+) satellite images were processed and used. Hardcopy images for use in reconnaissance and ground truthing activities were processed, clipped to study area, enlarged and printed at the scale of 1:50,000 at the Department of Resource Surveys and Remote Sensing (DRSRS). In order to perform a multi-stage analysis to improve the accuracy, aerial photographs were obtained for specific sample sites from the Surveys of Kenya's photo-library in Nairobi. The year 1990 was chosen as the base year since the study used decadal approach of 30 years until 2020. This is because patterns of change in land and land use phenomena, though dynamic depending on the driving forces, often have slow progress and require such periods to detect major spatial and temporal changes.Reference data was collected from the field in order to understand and correlate the satellite image features with study area features. Using analogue image interpretation elements, hard copies of colored images were applied to identify observable patterns of land cover features. The elements used include tone, colour, texture, association and pattern. The identified points were geo-referenced, described either retrospectively or instantaneously, and used as training features. The training sites were selected randomly based on observable features and information like government reports and vegetation maps were also collected during the field reconnaissance.
3.2.1. Data Acquisition
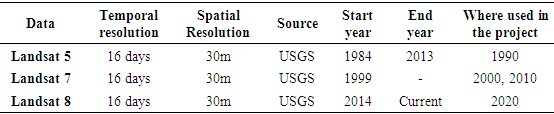
- Landsat data was selected and data was fetched through google earth engine application programming interface. This data is also available through Glovis and Earth explorer but google earth engine was preferred. This study was seeking to understand the changes of land cover in river Kuja basin in relation to its implications to water resources and this was done in four epochs; 1990, 2000, 2010 and 2020. Landsat has numerous sensors ranging from Landsat 1 through to Landsat 9 that was launched by NASA in late 2021 [46], table 3.1 shows the data used for this project. The respective datasets were acquired for the area of interest and were ready for processing.
|
3.2.2. Data Processing
- Data processing was done by leveraging the power of Google earth engine (GEE) cloud computing resources. This was to enable the user to have access to powerful online tools in the research area. Algorithms were developed to do the following;a. Cloud maskingBeing a river basin, river Kuja experiences moist conditions and rainfall during the rainy season. Given that the temporal resolution of Landsat instrument is relatively long (16 days) finding cloud free images was troublesome, therefore a cloud masking algorithm was applied on GEE to filter out images with clouds and only remain with images that are less cloudy (Figure 3.2). The algorithm returns images that could have clouds in low percentage hence the next step (Mosaicking) was used to stitch together images and create a cloud free image.
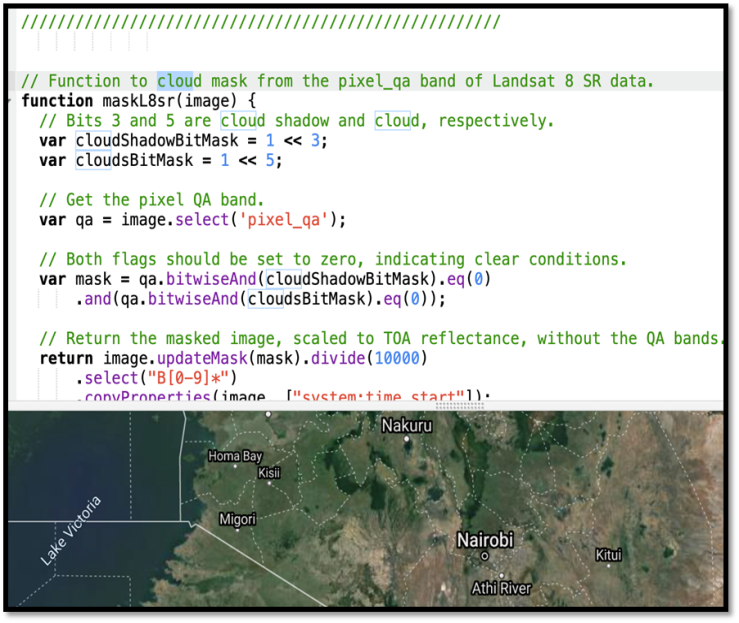 | Figure 3.2. Cloud Masking Process for River Kuja Basin |
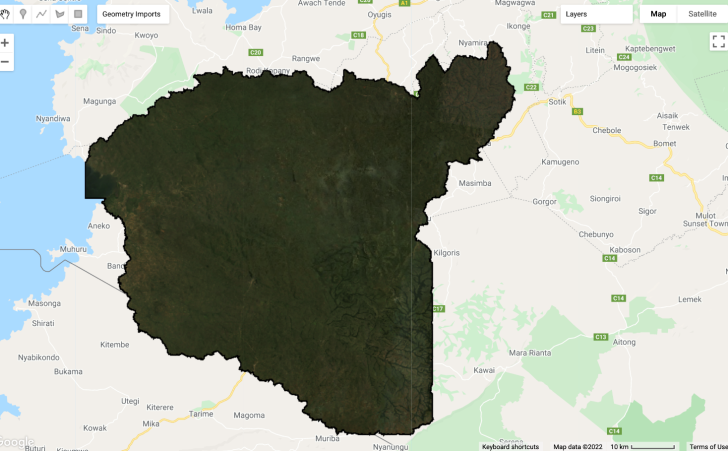 | Figure 3.3. Mosaicking Process during satellite image preparation |
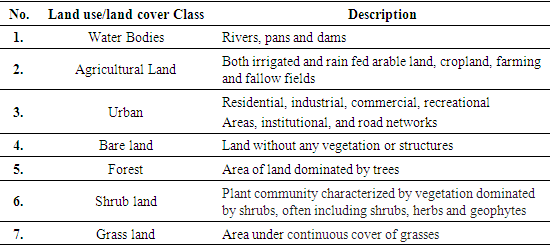
3.2.3. Land Use Classes
- The classes identified and used in the study are as tabulated in table 3.2.
|
3.2.4. Training Data Collection
- Training data were collected to give information to a machine learning module; the spectral signature of a specific land cover type. This was done through visual image interpretation approach. Polygons for different classes were collected in readiness for subsequent classification exercise (Figure 3.4).
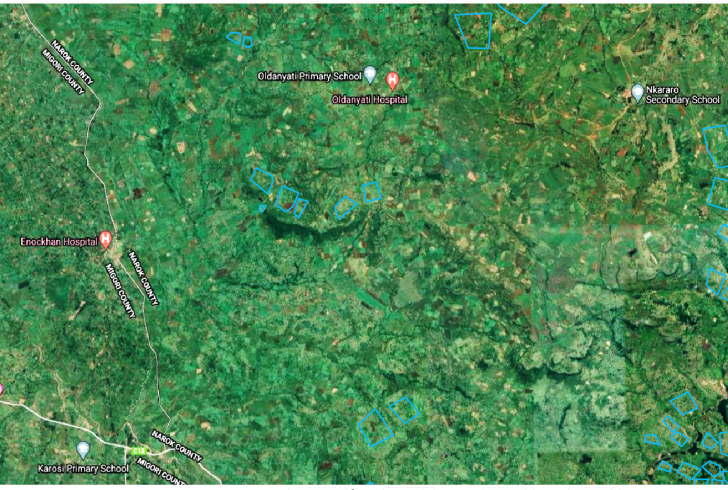 | Figure 3.4. Training data sites during the supervised classification process |
3.2.5. Image Classification
- Image classification was done through the use of Random Forest and maximum likelihood algorithms, the training data was split into training, testing and validation sets using the ratio of 70, 20 and 10 respectively. A set of indices were also computed to help in differentiation between classes and reduce the probability of getting mixed classes, the indices calculated included: normalized vegetation index, normalized wetness index, normalized multiband drought index, modified soil-adjusted vegetation index, Normalized difference snow index and enhanced vegetation index. The indices were added to the images as additional bands and were included during the classification process. The classification made sure that the bands with the highest correlation plots were used to develop image composite, that are then applied to collect the training datasets. Highly correlated bands, is interpreted as those having the same type of features, with minimal class to class confusion.
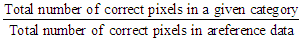
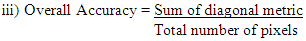
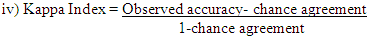
3.2.6. Accuracy Assessment
- This is a statistical test to evaluate the accuracy of a classification exercise, there are numerous modules for doing this, however, the most common and efficient method chosen for this exercise were the kappa coefficient, error matrix, producers and consumers accuracy assessment. The advantage of kappa coefficient error matrix is that it helps identify the type and nature of errors associated with classification process including their quantities. The following equations helped in computing the accuracy of the image’s classification;i) Producers Accuracy =
 ii) User’s Accuracy =
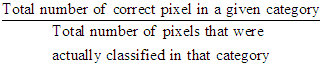
4. Results and Discussion
4.1. Image Classification for Land Use/Cover
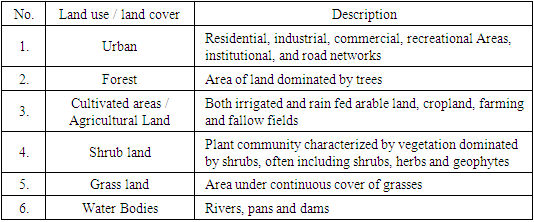
- Seven land use classes were identified and used to define classes during the land cover land use mapping process. The classes applied are in Table 4.1 below:
|
4.2. The Land Classification
- The results of land cover classification depended on the output of the major classes shown in table 4.1. However, the Landsat sensors in pre-1990 years, had high level of confusion with other land classes. As the years went by, the classification segmentation became better, contributed by the bettering of the sensors being produced for Landsat 5, and Landsat 8. The maps below show the output of the land classification done in a hybrid methodology. The hybrid method ensured a pre-image segmentation using machine learning technique (k means classification). After segmentation, the training sets were then collected while validating with both the segmented image and the classified images. The study being done in 4 epochs produced the following maps as presented in the sections below.
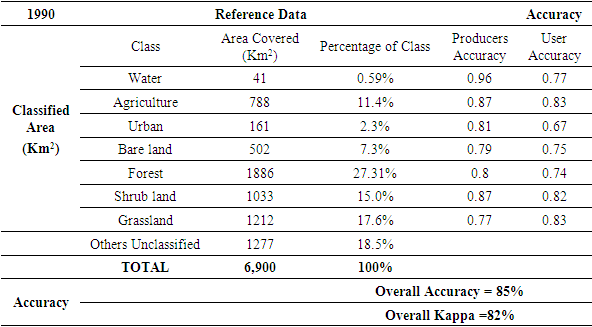
4.2.1. Land Cover/Use Distribution in 1990
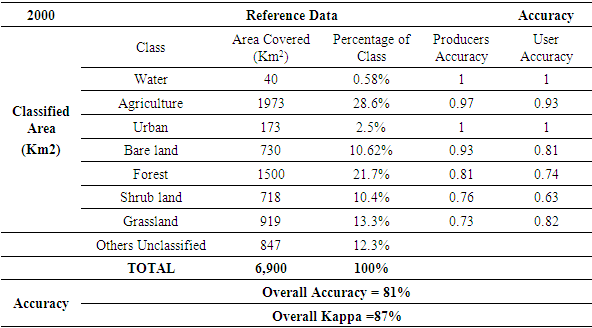
- The year 1990 was the baseline time for the decadal satellite images analysis process. The image showed that agriculture occupied 11.4% with an area of 788 sq.km while water 0.59% with an area of 41 sq.km. Forests covered the greatest area of River Kuja basin followed by grassland and shrub land (Table 4.2). The high forest cover was attributed to the fact that some areas within the basin had not been opened for agriculture and urbanization hence remained under indigenous forest cover. The overall vegetative cover in the basin added up to 4,920.39sq.km. This translated to 71.31% of the total basin area. Urban areas covered an area of 161sq.km which translates to 2.3% of the land. The urbanized area include residents, industrial spaces, commercial areas, road networks and road facilities. The overall Kappa accuracy analysis for the classification in 1990 was 82%. The matrix table below shows the land cover classes distribution of the basin with the level of both producers and users accuracy.
|
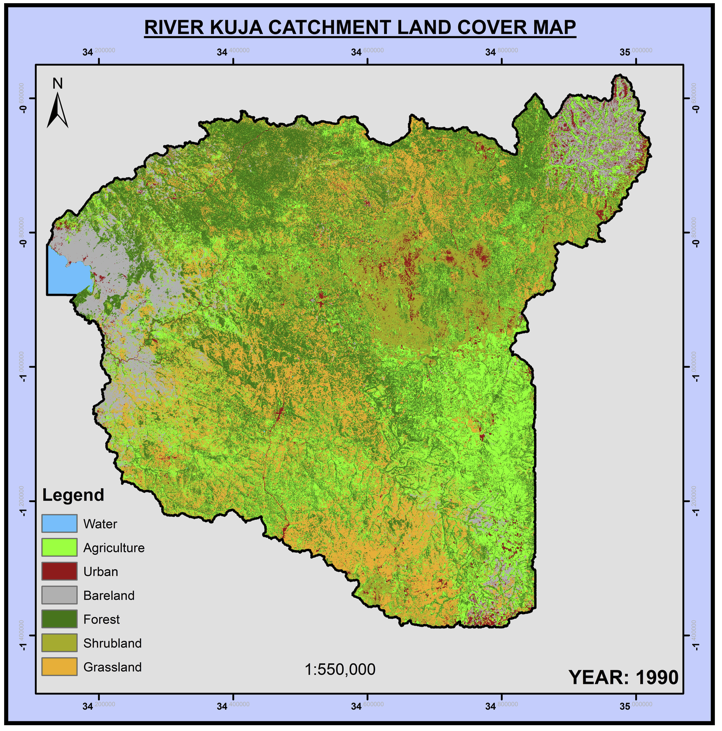 | Figure 4.1. Land use Image for the year 1990 |
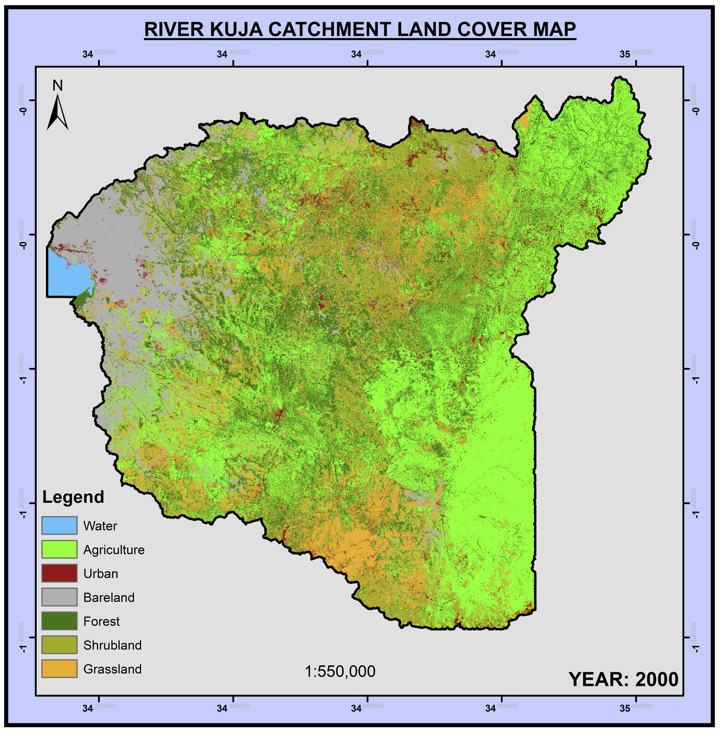 | Figure 4.2. Land use Image for the year 2000 |
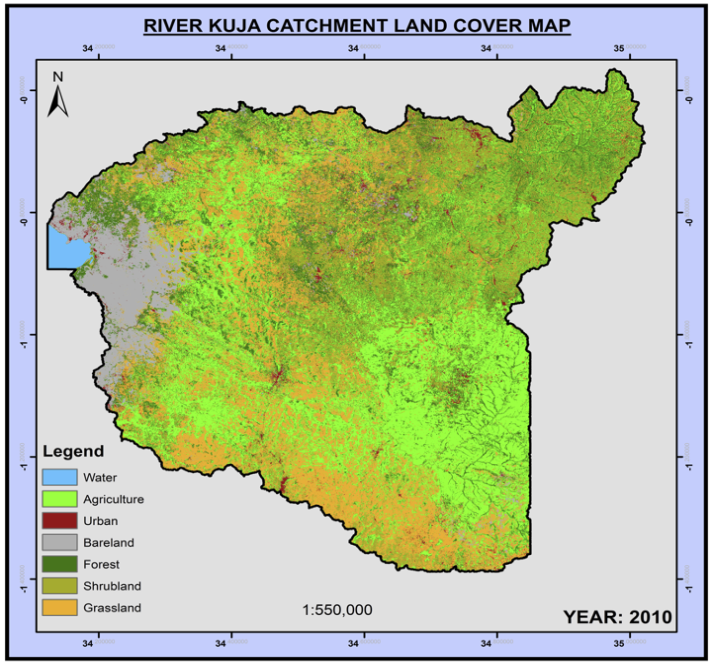 | Figure 4.3. Land use Image for the year 2010 |
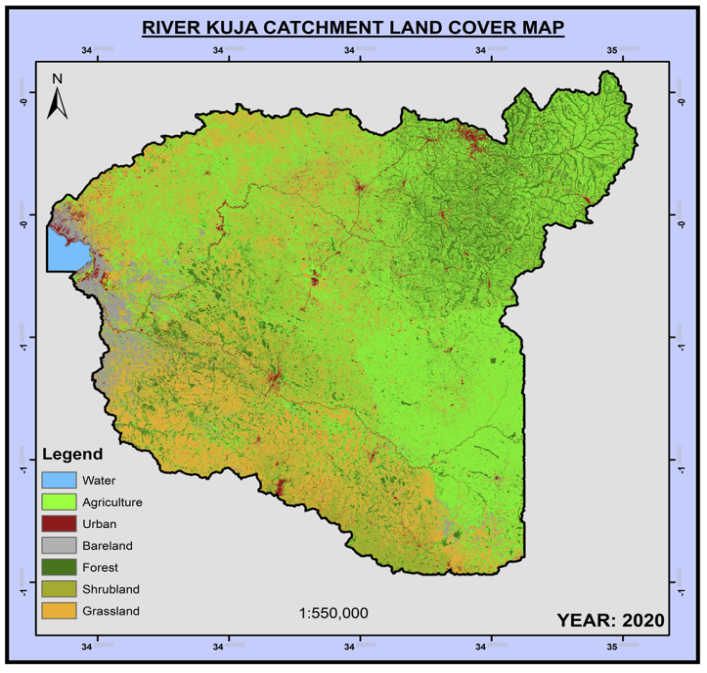 | Figure 4.4. Land use Image for the year 2020 |
4.2.2. Land Cover/Use Distribution in 2000
- The classes showed a spatial variability over the 10 years temporal time space as summarized in table 4.3. Water bodies reduced their area of coverage from 41sq.km in 1990 to 40sq.km in 2000. The 1.0 sq.km variation has possible great impact on the hydrology of the basin (find other studies that have indicated that that is true and refer). Agriculture sprang up 1973sq.km, more than double the area covered in a decade temporal space hence occupying 28.6% of the entire basin. Forests have reduced from 27.31% in 1990 to 21.7% in 2000. Urbanization also increased with a margin of 12sq.km. The overall Kappa accuracy analysis for the classification in 2000 was 87%.
|
4.2.3. Land Cover/Use Distribution in 2010
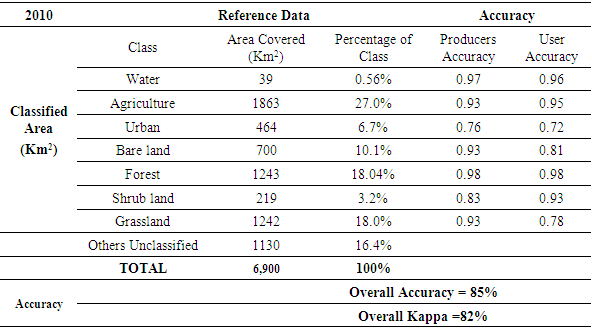
- In 2010, urbanization increased from 2.5% in 2000 to 6.7% of the basin area as shown in table 4.4. Forests have reduced to 1243sq.km. Shrub land constantly declined from 15% in 1990, to 10.4% in 2000 and 3.2% in 2010. The water bodies in the basin are reducing in surface coverage where in the two decades, there is a loss of 2sq.km. Bare land showed a mixed coverage over the period. The overall accuracy in the 2010 classification was 85% while overall Kappa accuracy analysis was at 82%.
|
4.2.4. Land Cover/Use Distribution in 2020
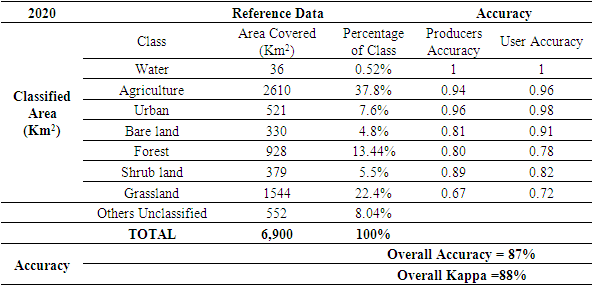
- In the last classification temporal space presented in table 4.5, water bodies reduced to 36sq.km while agriculture shot up to 2610sq.km occupying 37.8% of the entire River Kuja basin area. Urban area of coverage constantly increased to 521sq.km. Forests have also reduced significantly to 928sq.km translating to 13.44% basin coverage. The overall accuracy in the 2020 classification was 87% while overall Kappa accuracy analysis was at 88%.
|
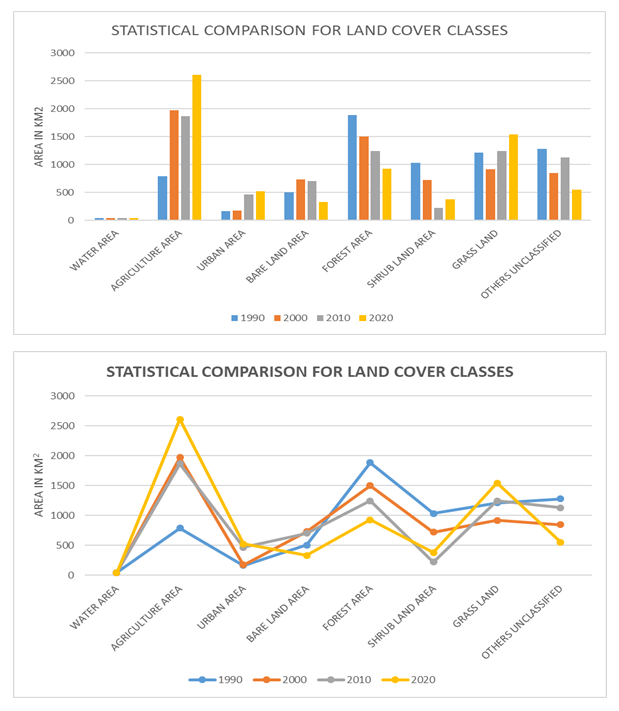 | Figure 4.5. Statistical comparison for land cover classes 1990 – 2020 |
4.3. Population Analysis in the Basin
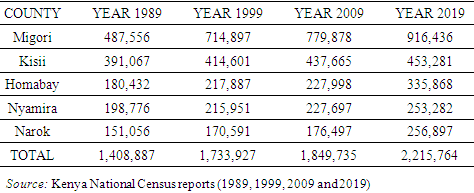
- Table 4.6 shows the population of the basin which includes portions of counties mapped under Kuja basin. Generally, the human population in the basin increased from 1,408,887 in 1989 to 2,215,764 in 2019 which is a difference of 806,877 translating to 57.3% increase with a compounded growth rate of 1.52%. Migori County contributed to a greater population size since River Kuja basin covers largely across the County. Narok County is the least covered by the basin hence the small population size. Migori County had a sharp population rise between 1989 and 1999 while Homabay and Narok Counties registered a sharp rise between 2009 and 2019.
|
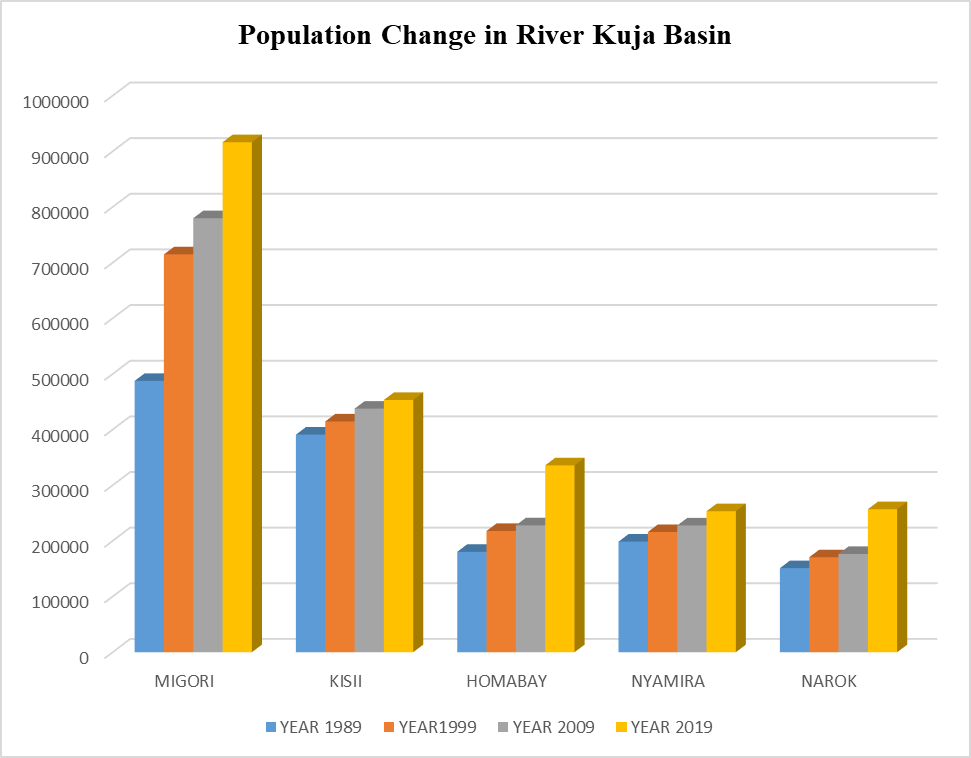 | Figure 4.6. Population dynamics of River Kuja Basin |
4.4. Change Detection Analysis
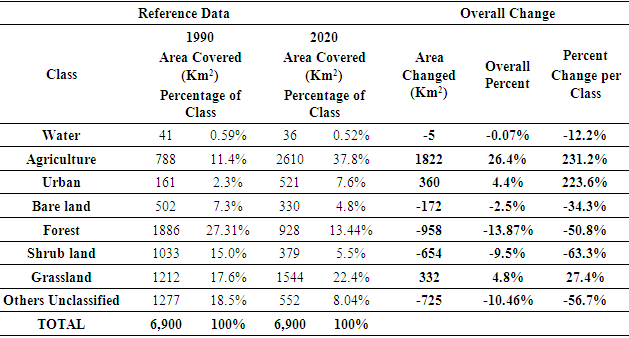
- Change detection was undertaken to establish areas that have undergone any form of shifts across the study period, this is a pixel wise comparison of classes and was done to have an overview of stable areas and those areas that have undergone any form of shifts. Given the resolution of the satellite imagery and the size of the catchment pixel wise analysis show significant shifts plausibly due the number of activities that are taking place in a catchment. These include water and wind transport of materials, natural and anthropogenic activities. The following maps indicate the changes for different epochs. The results show that the land uses have changed over the decadal period in which the study was conducted. Table 4.7 shows that agricultural area expanded exponentially from 788sq.km to 2610sq.km while forests have reduced from 1886sq.km to 928sq.km between 1990 and 2020. This translates to an agricultural percentage increase of 26.4% and reduction of forests by 13.87% respectively. Surface water retention reduced from 41sq.km to 36sq.km during the period under study. Urban generally increases towards 2020, however, due to high pixel confusion in 1990, the classification had a low accuracy, thus the high area for urban in 1990. As the thick vegetation such as forest reduces, the grassland areas increase while grassland generally increases. Shrub land areas have also reduced.
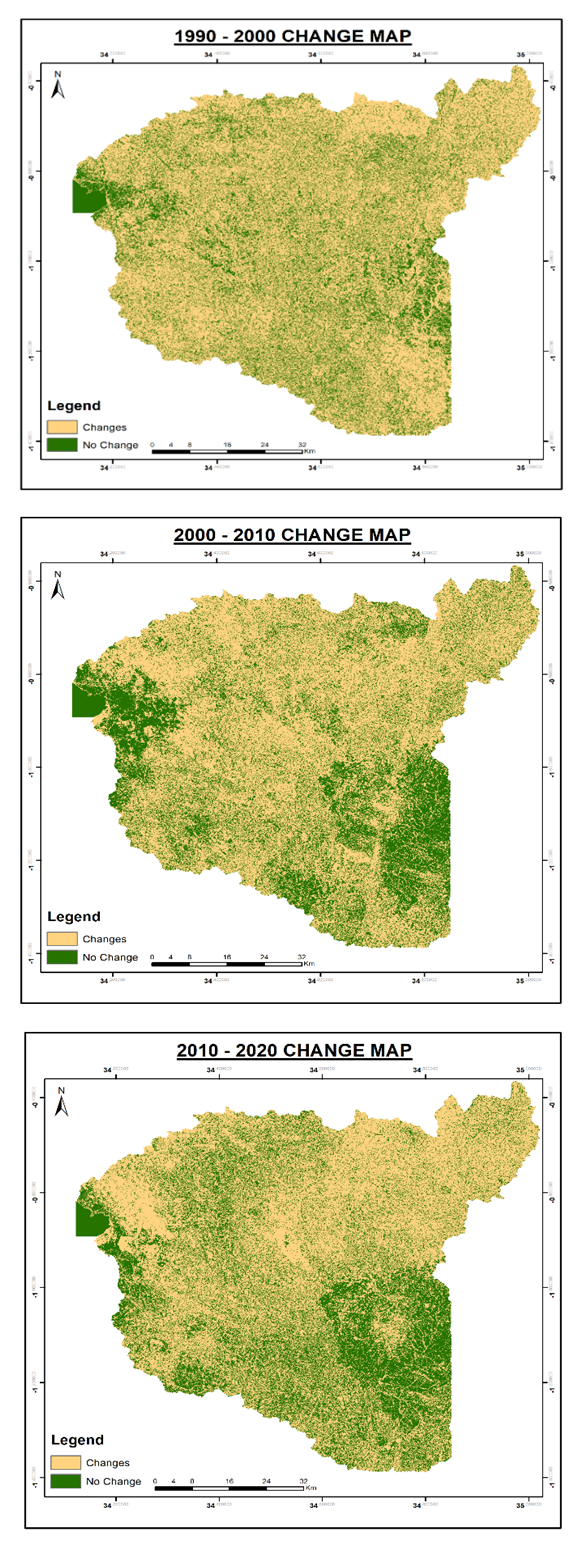 | Figure 4.7. Decadal Change detection of the basin 1990-2020 |
|
4.5. Discussions
- The findings as demonstrated in figure 4.8 show that the entire basin experienced overall land use land cover change over the past 30 years. More of forests, shrub land and bare land were converted to cultivated agriculture and infrastructural development. This has exposed the soil surface and reduced indigenous land cover hence resulting to hydrological alterations Recharge of water resources like rivers, springs, tributaries, natural ponds, natural dams etc. was affected During precipitation, excess surface runoff accumulates and flow downstream from tributaries into the river and finally into the lake without reduced resistance. Many water resources are therefore exposed to increased evaporation with low ground water recharge thus reduced water bodies’ capacity in the basin [50].
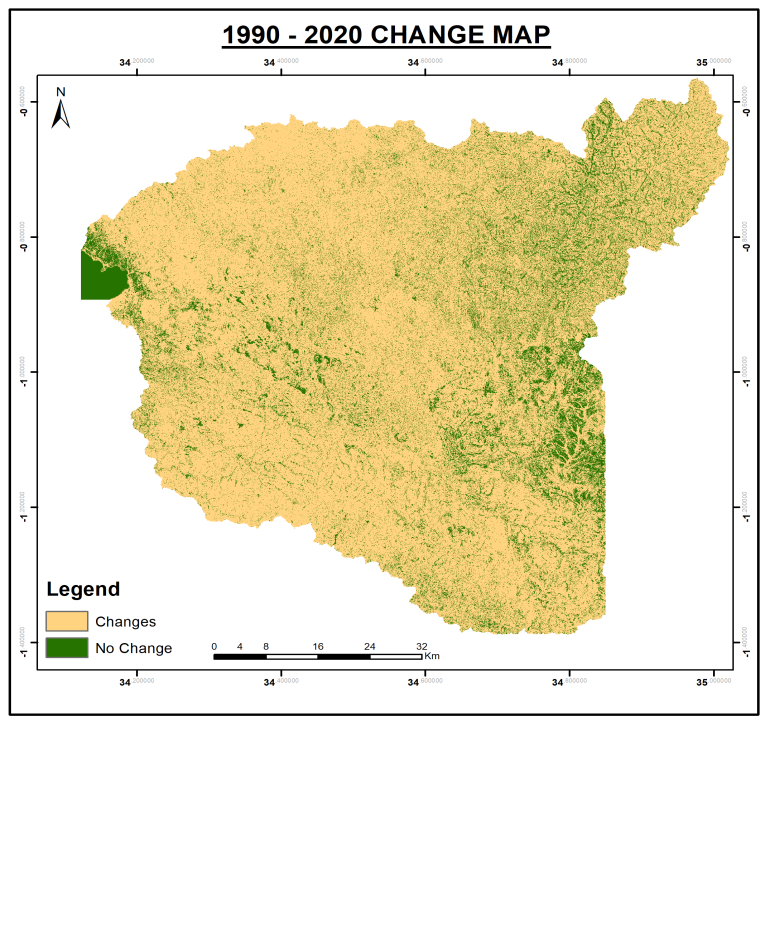 | Figure 4.8. Overall Change detection of the basin from 1990-2020 |
5. Conclusions
- In this study, the land use land cover change for River Kuja basin over the three decadal period was analyzed. The results showed that there were changes that were detected over the entire basin under study. The agricultural area expanded exponentially from 788sq.km to 2610sq.km while forests have reduced from 1886sq.km to 928sq.km between 1990 and 2020. This translates to an agricultural percentage increase of 26.4% and reduction of forests by 13.87% respectively. Surface water retention reduced from 41sq.km to 36sq.km during the period under study. Urban generally increases towards 2020, however, due to high pixel confusion in 1990, the classification had a low accuracy, thus the high area for urban in 1990. The satellite image analysis showed an overall percentage land use land cover change of 82%.The results revealed that forests, shrub land and grassland were converted to agriculture and constructed /built-up areas. This resulted in change in the hydrological and hydrogeological systems within the basin, soil degradation and other ecological effects. These changes has implications on the natural resources sustainability and management and the overall livelihood of the local communities. Water resources reduced by 5sq.km which has negative impacts on the increasing human population and the ecosystem at large.Therefore, in order to manage land use in the basin, there is need for improved land conservation and management practices, proper land use planning and management, integrated basin wide management plan, and full participation and capacity building of the local communities. In this study, the analysis of land use land cover using remote sensing and GIS approach provided useful information in the dynamics and patterns of land use. This is essential for planners and decision makers to help in planning for management and sustainable utilization of Kuja river basin resources.