-
Paper Information
- Paper Submission
-
Journal Information
- About This Journal
- Editorial Board
- Current Issue
- Archive
- Author Guidelines
- Contact Us
American Journal of Geographic Information System
p-ISSN: 2163-1131 e-ISSN: 2163-114X
2022; 11(1): 1-8
doi:10.5923/j.ajgis.20221101.01
Received: Mar. 15, 2022; Accepted: Apr. 8, 2022; Published: Apr. 15, 2022

Enhancing Vertical Accuracy of Global Digital Elevation Models for Coastal and Environmental Applications: A Case Study in Egypt
 Abstract
 Reference
 Full-Text PDF
 Full-text HTML
Gomaa M. Dawod1, Ahmed M. Amin2
1Geodesy Department, Survey Research Institute, National Water Research Center, Giza, Egypt
2GIS Department, Survey Research Institute, National Water Research Center, Giza, Egypt
Correspondence to: Gomaa M. Dawod, Geodesy Department, Survey Research Institute, National Water Research Center, Giza, Egypt.
| Email: |  |
Copyright © 2022 The Author(s). Published by Scientific & Academic Publishing.
This work is licensed under the Creative Commons Attribution International License (CC BY).
http://creativecommons.org/licenses/by/4.0/

A major source of Digital Elevation Models (DEM) is the open-source Global DEM (GDEM) developed and distributed free-of-charge and, thus, became accepted in a wide range of coastal end environmental applications worldwide. The vertical accuracy of such GDEMs should be investigated to determine their applicability for utilization in specific activities. Moreover, increasing the vertical accuracy of GDEMs should be carried out by the integration of local terrestrial geodetic datasets over a spatial region. The current study investigates the accuracy of three GDEM models over the Egyptian costs along the Mediterranean sea and tries to enhance such accuracy by adding terrestrial data through the utilization of two methods of spatial modelling within a Geographic Information Systems (GIS) environment. Based on the available datasets and attained results, it has been found that the regression modelling method results in enhancing the vertical accuracy of the investigated GDEMs by 15% and 4% while the krigging geostatistical method produced 24% and 16% improvements. Furthermore, it has been concluded that adding terrestrial local datasets to a global DEM could considerably increase its overall vertical accuracy. However, the number of added terrestrial points should be appropriate to the desired level of vertical accuracy and the area of study. Moreover, it has been concluded that the achieved vertical accuracy of the enhanced models, herein, could be suitable for small-scale mapping and overall management of coastal regions, but it might not be appropriate for accurate environmental studies such as Sea Level Rise (SLR) monitoring and risk assessment which requires a more accurate DEM.
Keywords: DEM, Global DEM, Vertical Accuracy, Coastal Management, GIS, Egypt
Cite this paper: Gomaa M. Dawod, Ahmed M. Amin, Enhancing Vertical Accuracy of Global Digital Elevation Models for Coastal and Environmental Applications: A Case Study in Egypt, American Journal of Geographic Information System, Vol. 11 No. 1, 2022, pp. 1-8. doi: 10.5923/j.ajgis.20221101.01.
Article Outline
1. Introduction
- A Digital Elevation Model (DEM) is a 3D digital illustration of the Earth’s topography. It can be developed in several ways based on the utilized input data. A DEM could be constructed by scanning and digitizing contour maps, by using terrestrial surveys of traditional spirit levelling or by Global Navigation Satellite Systems (GNSS) data. Also, a DEM could be generated from stereoscopic aerial photographs, stereoscopic satellite imageries, and Light Detection and Ranging (LiDAR) measurements. Recently, a DEM can be generated from data obtained by drones equipped with GNSS or LiDAR sensors. Another valuable source of DEM is the open-source Global Digital Elevation Models (GDEM) developed and provided free-of-charge organizations. That source became accepted in a wide range of applications worldwide due to its easy availability. GDEMs have been utilized in several types of civil and environmental applications such as designing water reservoirs [1], geoids modelling [2], topographic mapping [3], climate change assessment [4], coastal protection [5], flash flood assessment [6], and land subsidence monitoring [7]. The most-critical question dealing with GDEMs concerns their level of vertical accuracy. To judge such an accuracy level, several approaches have been proposed. Examples of such evaluation ways is the assessment utilizing a high-resolution high-accuracy local DEM [8], the utilization of Differential Global Positioning System (DGPS) terrestrial measurements [9], and the comparison with LiDAR-based elevation datasets [10].GDEMs accuracy level has been investigated in several spatial regions worldwide. For an instant, Dawod and Al-Khamdi [11] have investigated the accuracy of ten GDEMs in both Egypt and the Kingdom of Saudi Arabia (KSA) representing different topography patterns. They reported that such GDEM models produce standard deviations of height differences vary between ± 2.0 m and ± 6.7 m in flat regions, and from ± 4.7 m to ± 18.6 m in mountainous areas. Additionally, Rabah et al. [12] have investigated several GDEMs in Egypt and stated that the overall estimated accuracy range between ± 2.9 m and ± 8.7 m. In India, such accuracy levels range between ± 12.6 and ± 17.8 m [13]. Similarly, Ouerghi et al [14] concluded that the accuracy of some GDEMs in Tunisia vary from ± 7.6 m to ± 10.5 m. In addition, it has been concluded that GDEMs vertical accuracy in China depends on terrain complexity and equal 5 m approximately for plains, 10 m approximately for hills, and 20 m approximately for mountains [15]. Some approaches have been suggested to enhance the vertical accuracy of GDEMs. Rabah et al. [12] stated that some GDEMs utilized a particular Global Geopotential Model (GGM) to convert the originally measured ellipsoidal heights to Mean Sea Level (MSL)-based orthometric heights as the final published product of a GDEM, which is more applicable in civil and environmental applications worldwide. They suggest that replacing those geoidal undulation values with another more-precise GGM would increase the accuracy of a GDEM. Another proposed method considered the utilization of the krigging regression statistical tool to spatially model the GDEM errors [16]. Other researchers suggest filling the gap of a fine-resolution DEM by interpolating their corresponding values from a coarse-resolution one [17,18]. This paper aims to fulfill the following objectives:• Investigating the vertical accuracy of different resolution GDEMs over the 1000-kilometrs Egyptian coasts along the Mediterranean sea using accurate GNSS/Levelling datasets,• Studying different mathematical and statistical models for incorporating new data into GDEMs,• Performing GDEMs enhancement process within a GIS environment in an effortlessly and sensibly manner,• Analyzing the expected accuracy improvement of different GDEMs by adding a specific number of terrestrial data points,• Exploring the applicability of enhanced GDEMs for mapping, engineering and environmental applications.
2. Methodology
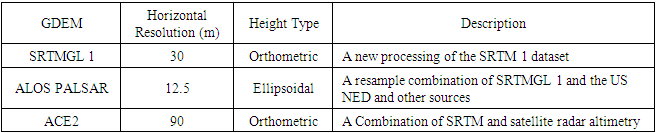
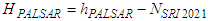
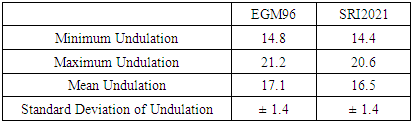
- Two mathematical and statistical techniques have been utilized, herein, to incorporate GNSS/Levelling datasets to the investigated GDEMS, mainly the first-order regression and the ordinary Kriging approaches. Due to their applicability and versatility, both models have been utilized extensively in various geomatics applications. For instance, the first-order regression has been applied to model and predict sea level changes [19]. Also, the Kriging interpolation has been utilized in geoid modelling and refinement [20].Three GDEM models with variable horizontal resolutions have been investigated herein. The first one is the Shuttle Radar Topography Mission (SRTM 1) model with a resolution of 1 arcsecond or approximately 30 m. SRTMGL1 v. 3 [21] has been utilized herein. (download from e.g. https://earthexplorer.usgs.gov/). The second model is the ALOS PALSAR model representing Phased Array type L-band Synthetic Aperture Radar (PALSAR) measurements obtained from the Advanced Land Observing Satellite (ALOS). Its spatial resolution is 12.5 m and could be downloaded from https://search.asf.alaska.edu/. ALOS PLASAR (simply PALSAR herein) has been developed by integrating the SRTMGL1 model with the US National Elevation Data (NED) and other datasets and was re-sampled to the 12-m resolution. The datum of the final PLASER is the World Geodetic System 1984 (WGS-84) ellipsoid with the utilization of the Earth Geopotential Model 1996 (EGM96) to convert MSL-based heights to the corresponding ellipsoidal heights [22]. The third GDEM is the Altimeter Corrected Elevations, Version 2 (ACE2 developed by synergistically merging the SRTM data set with Satellite Radar Altimetry within the region bounded by 60°N and 60°S. ACE2 was developed at resolutions of 3, 9 and 30 arc-seconds, and 5 arc-minutes [23]. The 3" ACE2, utilized herein (downloaded from https://sedac.ciesin.columbia.edu/data/set/dedc-ace-v2). Although ACE2 is a 90-m resolution model, it produced reasonable accuracy over 1100 GNSS/Levelling checkpoints over Egypt [2].
|
 | (1) |
 | (2) |
 | (3) |
 | (4) |
 | (5) |
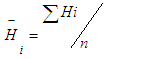
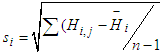
 represents the average height error for the ith DEM,si represents the standard deviation of height error for the
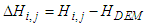
  DEM,The model producing the best vertical accuracy, in terms of the standard deviation of height differences, will be obtained. Then, its height errors over the control points will be spatially modeled by two approaches. First, the regression analysis statistical toll will be applied to model modelling differences (ΔH) as a function of Easting (Ei) and Northing (Ni) UTM coordinates:
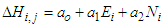 | (6) |
 | (7) |
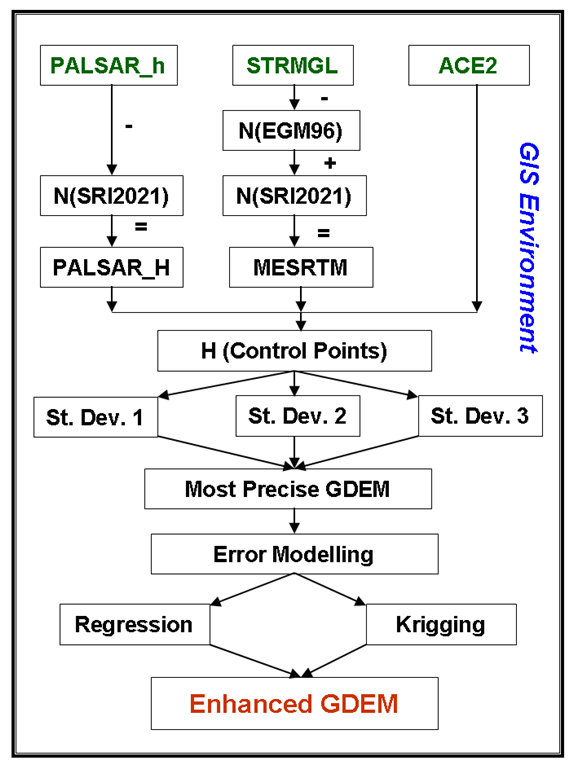 | Figure 1. Processing Steps |
3. Study Area and Available Data
- The study area occupies the Egyptian coasts over the Mediterranean sea from Sallum city at the east to Raffah city at the west (from 25.10 E to 34.20 E) with a variable width equals approximately 25 kilometers (from 30.70 N to 31.60 N). Its overall area equals almost 25,000 square kilometers (Fig. 2). A number of 199 precise-levelling Bench Marks (BM) have been established by the Survey Research Institute (SRI) of the National Water Research Center (NWRC) in the last few years as a part of the Spatial Data Infrastructure (SDI) for coastal and environmental applications. Such BM exist mainly (64%) in the Nile delta region between Alexandria and Port Said cities while there exist 19 BM in the Sinai peninsula and 53 BM in the west coast region. It is worth mentioning that the overall accuracy of both vertical and horizontal coordinates of such a precise geodetic network is less than five centimeters [24]. Twenty-five points (almost 13%) have been reserved as checkpoints to judge the enhanced models’ quality. It is worth mentioning that despite the minimal amount of available GNSS/Levelling data points, these datasets comprise the most-accurate geodetic data within the study area.
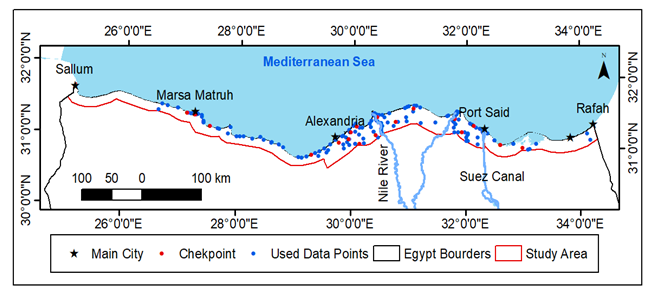 | Figure 2. The Study Area and Available Data |
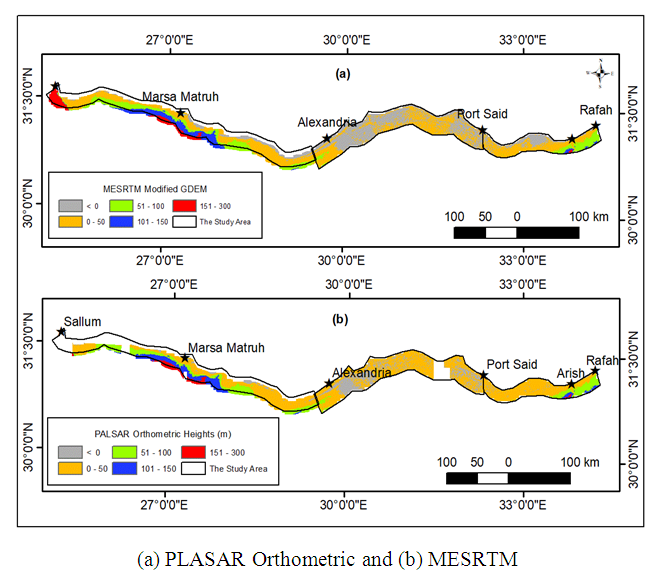
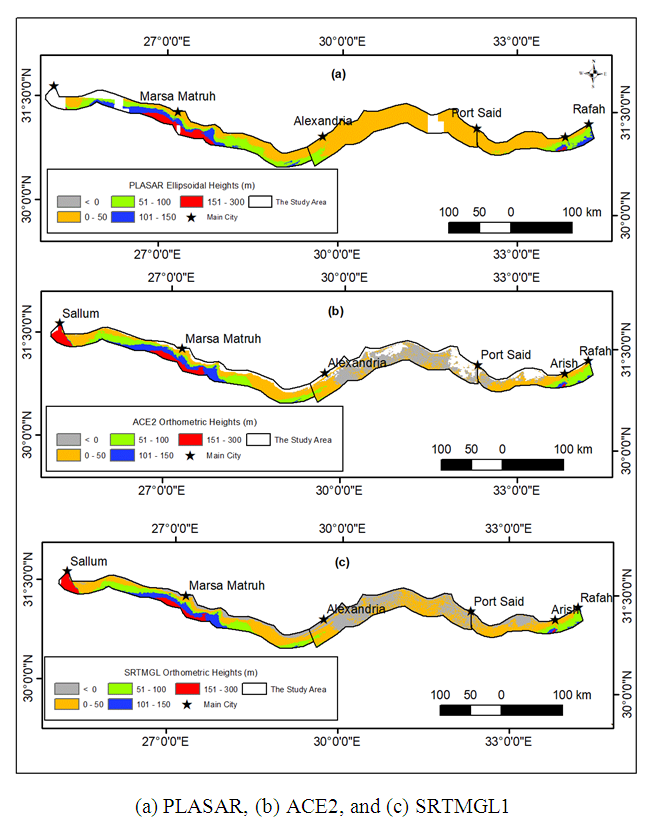 | Figure 3. The Utilized GDEM Models |
4. Results and Discussion
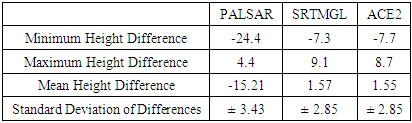
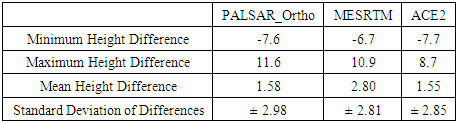
- The first step in the data processing stage has been performed to evaluate the vertical accuracy of the original three GDEMs over the available terrestrial precise network. The Arc GIS analysis tools have been carried out to interpolate the GDME-based height at each checkpoint from each GDEM and compare it to the corresponding known height to compute the mean error and standard deviation, using Equations 3 to 5, for all the three GDEMs. Table 2 presents the accomplished findings. It can be realized that, over the known 199 BM, the PALSAR model produced the worst vertical accuracy, in terms of the standard deviation of height differences, while the other two models produced the same level of accuracy. In addition, it can be noticed that the vertical accuracy of the GDEMs, over the Egyptian coasts, equals approximately ± 3 m as other researchers have pointed out in other countries.
|
|
 | Figure 4. The Modified GDEM Models |
|
 | (8) |
 | (9) |
 | (10) |
 | (11) |
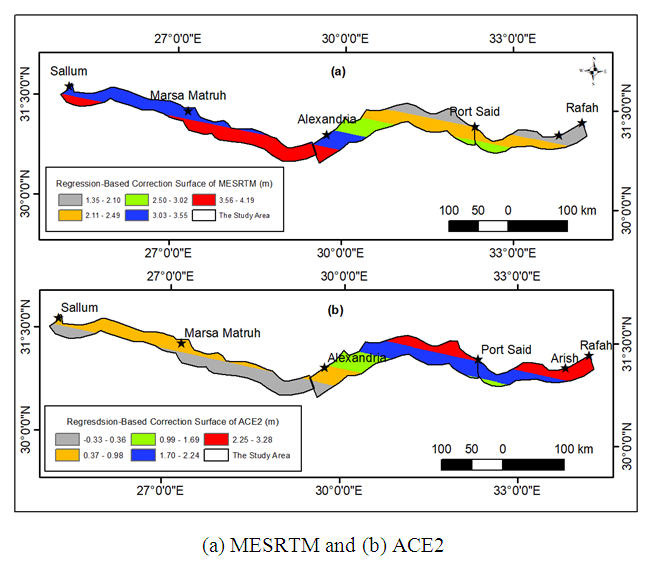 | Figure 5. The Regression-Based Correction Surfaces of the Enhanced GDEM Models |
|
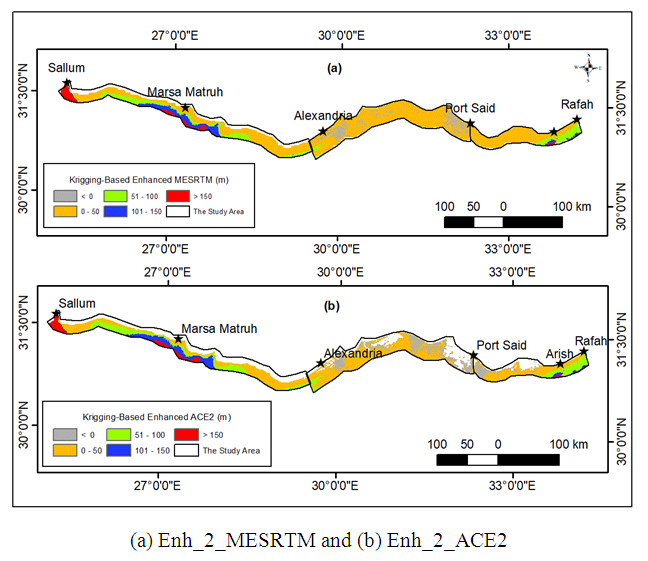 | Figure 6. The Krigging-Based Enhanced GDEM Models |
|
5. Conclusions
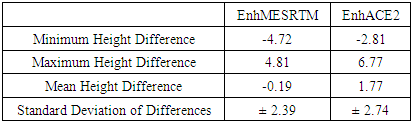
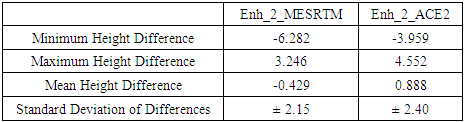
- Global Digital Elevation Models provide open-source free-of-charge accessible data to represent the topography of a spatial area. Such models have been developed and distributed worldwide and have been extensively applied in several coastal management and environmental applications. It is a matter of reality that each activity requires a certain level of vertical accuracy to meet its requirements and specifications. The current research investigates the vertical accuracy of different resolution GDEMs (namely PALSAR, SRTMGL 1, and ACE2) over the 1000-kilometrs Egyptian coasts along the Mediterranean sea using accurate GNSS/Levelling datasets. The vertical datum of those models has been first unified and a local geoid model has been utilized for height conversion. In addition, the study tries to enhance such accuracy levels by adding terrestrial precise datasets and utilizing both the regression and the krigging statistical methods to spatially model the GDEM-based height errors. Based on the available datasets, few conclusions have been drawn. Being judged over terrestrial precise BM, the vertical accuracy of the original GDEMs be ± 3.43 m for the PALSAR model and ± 2.85 m for both SRTMGL 1 and ACE2 models. Converting the PLASAR vertical datum from the WGS84 one to the MSL datum reduce its vertical accuracy to 2.98 m over the available ground points. Replacing the utilized geoid model used in height transformation of the SRTMGL 1 model, from the global EGM96 geoid to the local SRI2021 one, enhance its accuracy a little bit. Applying the regression modelling method results in enhancing the vertical accuracy of MESRTM and ACE2 by 15% and 4% respectively. On the other hand, the krigging geostatistical method produced 24% and 16% improvements for the MESRTM and the ACE2 respectively. Accordingly. It is concluded that the krigging geostatistical modelling is better than the regression method since it takes the spatial correlation between the data points. According to the accomplished findings, few significant concluding remarks could be summarized. First, the presented approach of adding terrestrial local BM datasets to a global DEM could considerably increase its overall vertical accuracy. Second, the number of added terrestrial points should be appropriate to the desired level of vertical accuracy and the area of study. For instance, 200 BM have been added in the current research study to decrease the overall accuracy of a particular GDEM from ± 2.85 m to ± 2.15 m over the current study area. Thus, it might be concluded that enhancing the accuracy of GDEMs to a sum-meter level may require collecting a huge number of BM, which is obviously expensive. Third, the achieved vertical accuracy of the enhanced models, herein, could be suitable for small-scale mapping, hydrological investigations, and overall management of coastal regions. However, it might not be appropriate for accurate environmental studies such as Sea Level Rise (SLR) monitoring and risk assessment which requires accurate DEM for representing the topography of a particular area.
Declaration of Interest Statement
- No potential interest was reported by the authors.No funding was allocated for this research.