-
Paper Information
- Paper Submission
-
Journal Information
- About This Journal
- Editorial Board
- Current Issue
- Archive
- Author Guidelines
- Contact Us
American Journal of Geographic Information System
p-ISSN: 2163-1131 e-ISSN: 2163-114X
2021; 10(1): 21-43
doi:10.5923/j.ajgis.20211001.02
Received: Apr. 5, 2021; Accepted: Jun. 25, 2021; Published: Jul. 15, 2021

Land Use Changes in Peri-urban Areas of Siaya Township Ward from 1987 to 2017
 Abstract
 Reference
 Full-Text PDF
 Full-text HTML
Charles Otieno Konyango, Patrick Odhiambo Hayombe, Fredrick Omondi Owino
Department of Spatial Planning, Jaramogi Oginga Odinga University of Science and Technology, Bondo, Kenya
Correspondence to: Charles Otieno Konyango, Department of Spatial Planning, Jaramogi Oginga Odinga University of Science and Technology, Bondo, Kenya.
| Email: |  |
Copyright © 2021 The Author(s). Published by Scientific & Academic Publishing.
This work is licensed under the Creative Commons Attribution International License (CC BY).
http://creativecommons.org/licenses/by/4.0/

Uncontrolled land use change carries serious spatial challenges to the stability of peri-urban areas in the form of land use conflicts, incompatible and incongruent land uses, haphazard developments and a disorganized land structure. The aim of this study was to investigate the spatial stability of peri-urban areas using the land use change concept. The objective was to assess the extent of land use changes in peri-urban areas of Siaya Township Ward between 1987 and 2017 and its impact on spatial stability. The research was guided by the Theory of Urban Expansion Urban Land Market Theory, and Plurality Theory. Data was collected and analysed using Geographic Information System (GIS) and Remote Sensing (RS) technologies for land use changes over time. Interviews were further conducted to provide an in depth understanding of the history and trends of spatial planning in the study area. The research hypothesized that there is no significant variance in land use change between 1987 and 2017. This was tested by use of Paired Sample t-test. The study found significant land use change in peri-urban areas between 1987-2017. Built up areas in Nyandiwa increased by 444.3%, Mulaha by 339.2%, and Karapul increased by 48.6% respectively between 1987 and 2017, showing rapid expansion of built-up areas for the period of 30 years. Test of hypothesis indicated a statistically significant difference between bare land – built-up areas (t = 3.237, p =.048); built-up areas – vegetation (t= -1.949, p = .146); and bare land – vegetation (t = -.691, p = .439). Thus, the null hypothesis was not satisfied at 95% confidence level. These changes have been characterized by spatial instability indicated in disorganized land use development, incompatible land uses, haphazard developments and lack of distinct spatial order. As such, there is need to strengthen institutional capacity of spatial planning authorities, formulate and enforce standards to manage peri-urban developments sustainably.
Keywords: Land Use Change, Geographic Information Systems, Remote Sensing, Siaya Township
Cite this paper: Charles Otieno Konyango, Patrick Odhiambo Hayombe, Fredrick Omondi Owino, Land Use Changes in Peri-urban Areas of Siaya Township Ward from 1987 to 2017, American Journal of Geographic Information System, Vol. 10 No. 1, 2021, pp. 21-43. doi: 10.5923/j.ajgis.20211001.02.
Article Outline
1. Introduction
- Land use change is described in terms of variations in form, size and functionality of a given land use category [33]. The two forms of land use changes that are differentiated by land conversion from one use to another, and a change that corresponds to modification of a structure or its functionality [82]. Further noted that the implications of land use change are largely classified as ecological and socio-economic [33].On the other hand, land use is described the sum of activities and contributions that people execute in a specified land form and includes both the sequence wherein land features are exploited and the intention for which land is used [69]. Land use change thus requires the conversion of land from one form to another to meet the urgent demands of society. Consequently, as population grows, land use would also shift to satisfy changing need [38]. Nevertheless, this transition brings with it new tensions between divergent uses, the needs of private land owners and the public interest. After the 1992 Earth Summit in Rio de Janeiro, most studies have turned their attention to environmental issues that have disrupted ecological systems. Land use change is a significant cause of global environmental degradation and one of the threats effecting the ecological system [66]. However, the effects of land use change have become a murky field for study and, more specifically, the implications of land use change on the spatial status of the land resulting from urbanization. The theories of land use change have centred mainly on the topology of land use from one form to another, why these changes occur, what causes them, and what are the processes of change? [69]. Conversely, these ideas are inadequate without taking into account the spatial character of the site as a result of the shift in land usage. Notably, most of the theories of land use change concentrate on the general theoretical context, and focus on the role of humans in environmental degradation [13]. This leaves out spatial change which is the domain of this research.Planning system plays a pivotal role in determining land use change, the location of new land uses, and providing a framework for policy makers to influence development [75]. As such, planning ensures that human settlement growth is undertaken in a spatially organized manner so as to achieve equity and enhance socio-economic development. The spatial aspects of land use change are as relevant as its ecological dimensions. Furthermore, planning is mainly concerned with the allocation of land use rights and the approval of development proposals, without tracking the effects of land use transitions [71]. These findings pointed to the need for a contemporary management system to direct transitions in land use towards spatial stability.Land use change in peri-urban areas is regarded as a diverse and complex process involving both natural and anthropogenic processes; and that in tracking and assessing these changes, GIS can be used evaluate potential trends and forecast potential growth patterns [20]. In Europe, the need to evaluate the effects of land use transition also intensified due to the implications of urban development [27]. Land use and land cover relations are useful in understanding the relationships between human activities and the environment [37]. Consequently, forecasting land use and land cover change and predicting the effects of that change depends on considering the historical, recent and prospective status of the land [39]. This assertion has a direct impact on this study as it explores the relationship between land use change and spatial change and considers that the potential spatial result of land use change can be measured, projected and managed with an optimal planning framework.Statutory spatial planning provides a way to manage land use changes and assign land use to areas that are best suitable to such a practice [32]. Conversely, given that spatial planning is primarily concerned with potential land change, it calls on developers and policy makers to implement those changes. The process of spatial planning thus implies striking a balance between, on the one hand, compatibility and sustainable development and, on the other hand, the general interest of the society [7]. As such, land use changes are a dynamic process affecting both human and natural processes. Changes in land use are accompanied by a restructuring of the peri-urban spatial form, resulting in an intermittent spatial pattern.In this research, it is argued that land use transition can be managed with sufficient planning and institutional frameworks. This includes an evaluation of the magnitude of land use changes over a given period of time and an overview of their consequences to the peri-urban areas. To this effect, the research utilizes RS and GIS techniques to detect and classify emerging land use changes and explore the structure and trends of land use and their effects. Land use change indicators therefore form essential parameters of investigation and analysis in this study. These indicators are defined in relationship to the geographic space; thus, spatial indicators define the location of geographic objects in the space, their causal linkages in terms of the organization, distribution and distance [59]. As such, they denote the position of the geographic object and their spatial autocorrelation [12]. For example, number of housing units in an area over a specific period and their land coverage. Previous studies have adopted Drivers, Pressure-State-Response model and argued that there will be indicators on the state of land use and indicators on the pressure of conversion of land surfaces; all these result in spatial transformation. This study borrows from these broad definitions [12]. Therefore, indicators are being referred to in terms of the quantitative aspects of land use and land artificialization of space.These indicators are analysed using GIS and RS combined with observations and ground truthing: land fragmentation; change in land use densities; artificialization of land; and change in land use categories and types. The analysis of these spatial indicators is to describe change over space and time. How these indicators drive land use change of peri-urban areas is examined. The objective is to demonstrate the state of land use together with changes in spatial organization over time. In this regard, the study does a land use analysis to establish: detailed land use change over time; extent of artificialized territory on varied dates; and rate of increase in (%), of surface area of artificialized territory by land use category between 1987 and 2017. From the study literature, land use change can be described as the quantitative change in structure and arrangement of land as a result of human activities due to population increase. The literature identifies that this change brings conflicts between competing interests of individual land users and the public common good. However, these conflicts have not been studied especially in the aspect of the management framework to mitigate negative impacts on land use and spatial structure.
2. Objectives and Hypothesis
- The study sought to assess the extent of land use changes in peri-urban areas of Siaya Township Ward from 1987 to 2017. Consequently, the corresponding null hypothesis was that there is no significant variance in land use change between the same study period.
3. Literature Review
3.1. Land Use Change Detection
- Change detection is a process for determining and evaluating temporal differentiation of land surface properties over a period. It aims to analyze land surface areas on digital images that depict change features of interest [6]. The fundamental standards in change detection include dynamics of landscape phenomena [61]. Common techniques mostly used in analysis of change detection are GIS and RS. RS has been used as a way of evaluating and categorizing land use changes [11]. The scholars examined the temporal dynamics of land change by studying the spatiotemporal characteristics of land surface and their seasonal changes [11]. Change detection is applicable in areas such as land use change, habitat degradation and urban expansion by space and time series analysis techniques such as GIS and RS [24].Change detection is useful in LULC changes, such as alteration of farming, change in vegetation cover, land fragmentation and desertification [6]. It has evolved as a substantial framework for regulating and monitoring ecosystems as well as urban growth, largely due to the provision of quantitative methods of analysing spatial distribution given phenomena [30]. RS and GIS are the most common methods for this quantification because of their accurate geo-referencing procedures mapping and change detection capabilities in both urban and rural landscapes. Digital techniques using multi-temporal satellite imagery helps in understanding landscape dynamics, and illustrates the spatio-temporal changing aspects of land use [43]. The technique of change detection has majorly been used for land cover detection but this study holds that the manner in which land is used not only affects land cover but also the landscape and spatial configuration of land. A previous study applied change detection in studying urban sprawl and its effects on farmland [79]. This was done using GIS and RS, where key factors studied included changes in population growth, urban land cover and use, land spatial structure and trends in Cairo. The spatial patterns of LULC change and the analysis of LULC trends were examined using the TerrSet software. The influencing factors of the LULC change from 2010 to 2018 were validated using logistic regression model (LRM). The findings demonstrated that LULC change and urban sprawl had a direct effect on farmland. In addition, the analysis found that urbanization and land price had the strongest regression coefficients, 0.660 and 0.292, respectively. As a result, the magnitude of urban sprawl in many areas was influenced by ecological processes and land conversion. this field, RS and GIS has demonstrated effectiveness for monitoring the trends of urban sprawl.Another study looked at the trend of land use changes in Bandar Abbas City, Iran as a function of urban growth by measuring changes in land use and urban sprawl utilizing aerial photos and satellite imagery overtime [17]. Results indicated that the urban landscapes had transformed irregularly due to population growth. Further, research revealed a decline in bareland relative to a rise in urban, farmland and vegetation. In comparison, the population growth was directly proportional to the rise in urban areas over this time. RS has emerged as an effective technique for measuring urbanization rates and trends, while the fundamental issue remains how to differentiate emerging urban land from bare land [72]. In order to resolve high spatial and temporal variability as well as diverse, multi-signature entities within settlements [72]. The central idea of the methodology is that land in urban areas has diverse spatiotemporal patterns both before and after transition, and that they contribute to distinct signatures in a variety of spectral regions. The method was helpful in modelling peri-urban settlements greater than 1800m.Other research examined the spatial-temporal progression of urban growth in Kigali, Rwanda between 1984 to 2015 utilizing Landsat data to determine the resulting ecological consequences using landscape metrics [62]. Based on the results of the study, landscape structure indices shown that, generally, the trend of land cover remained constant for farmland but shifted dramatically in built-up areas. Consequently, the degree of change in peri-urban areas is a global concern, especially on a spatial-temporal level, thus the need for sound management [22]. To this end, the implementation of an effective land use change detection methodology is of utmost priority. A recent research applied a GIS approach to undertake a comprehensive and precise assessment of peri-urban land use transition, to determine how much farmland had changed to other uses over a period of 5 years [22]. The study showed that 48 percent of farmland, had changed to other uses in 2008 and 2013.A study conducted in Gaborone dam catchment, Botswana, evaluated LULC from 1984–2015 using GIS and RS [58]. The research used Landsat images from 1984 to 2015. Image processing was conducted by means of Maximum Likelihood Classifier. Land use types included bareland, farmland, built-up areas, shrubland, trees and water bodies. Results revealed that shrubland and tree cover were the main LULC types during the study period, while shrubland and farmland dominated the area in 2015. The rate of transition was usually higher in the period 1995–2005 and 2005–2015. Built-up areas increased by 108.3% and 98.5% respectively, while bareland rose by 161.1% and 121.5% respectively. However, major declines in shrubland, 29.4% and tree cover, 71.3% were found in the total period. The findings indicated the need to constant monitoring of LULC changes in the area in order to promote conservation and preservation of natural resources. In another study, [65] investigated the spatial-temporal effects of land use change in Kisii town, Kenya. The study was conducted using the QGIS version 3.0.1 software by combining of three satellite imageries for the year 2005, 2010 and 2017. Findings indicated that built-up areas had the largest growth (275.73 percent) followed by forested areas (188.26 percent). Contrary, the transition areas posted the least decrease (81,89 percent) followed by grass/ farmland (-35.30 percent). In addition, [54] evaluated LULCC using GIS and RS in Kieni, Central Kenya. The research used Landsat imagery for the years 1987-2017. Land use was categorized into six classes: bareland, bushlands, farmland, forestland, grassland and water bodies. The findings revealed an increase of 314.86 percent, 160.45 percent and 73.18 percent in water bodies, farmland and bareland respectively. Further The study found a decline of 45.94 percent, 38.73 percent and 29.66 percent in forestland, bushland and grassland respectively. The study concluded that there were major LULC changes as farmland went up by one and a half times, while forestland declined by half.Other research used geospatial approaches to study LULCC in peri-urban areas of Ghana from 1986 to 2014 [8]. A combination of RS softwares such as ERDAS Imagine 13 and ArcMap 10.2, was used to analyze forest land cover changes. Findings showed that the study area had undergone a range of land use changes with significant forest loss, especially between 2002 and 2010. By the year 2010, forest cover had been degraded by 4,040 hectares, suggesting a change probability of 0.40 percent the future. There was a significant rise in built-up and bareland by 380 per cent over the period 1986-2002. The study concluded that ecological health required to be managed sustainably by the respective local authorities. As such, GIS technology has been established as a way of advancing perceptions and decision making through spatiotemporal analysis.According to [53], detection of changes includes, among other things, the estimation of the transformations and the extent it happens, the spatial pattern and the precise estimation of its effects. Other land use change detection approaches include; image acquisition, image registration, geometric correction and multi-temporal analysis, etc. Essentially, the option of a change detection and precision is a major challenge [53]. Another study examined the urbanization trend in Bandar Abbas city, concentrating on urban sprawl and land use change between 1956 and 2012 using aerial and satellite images [60]. The findings revealed that the urban area had changed from 403.77 hectares to 4959.59 hectares during the study period.In conclusion, review of literature has demonstrated that the use of GIS and RS methodologies in change detection can helps uncover land use changes overtime. It is observed that there exist other approaches for change detection that contribute to the subject area and knowledge. Most search on land use change centered on the assessment, visualization and analysis of land use conversion from one use to the other, for instance, from forest to farmland. The study literature has also confirmed that change detection techniques has been largely applied to analyze land surface and changes associated with biophysical properties on land. Its application on GIS and RS has been shifting from agricultural practices, rangelands and land degradation. Detection on landscape dynamics has, however, been limited to changing aspects of land use. This study advances the technique further to analyze land use changes in peri-urban areas and how this change relates to the spatial transformation of the peri-urban landscape. Since the central premise of this study is that uncontrolled land use change in the peri-urban areas generate new patterns and spatial structure characterized by spatial instability, this study complements LULC change detection by identifying changes in the state of land structure (fragmentations) from Landsat imageries at different time periods. The main categories of change analysed is the fragmentation of land through subdivisions hence increasing the number of plots per sub location. The rate of change in land structure is analysed as indicated by land fragmentation through land subdivisions over the study period of 1987 to 2017. The rate of change is defined as “the relative amount between changes in variables over a precise period [28].” It is premised that the study of peri-urban areas from a spatiotemporal perspective can predict their resulting impacts. Three peri-urban places were chosen for detailed analysis namely Karapul, Mulaha, and Nyandiwa that were the same used in LULC change detection. Analysis was done using Landsat (satellite) imageries on the rate of spatial change on the individual plots because of land subdivision over five successive year periods between 1987 and 2017. This analysis of change in land structure was done to determine trends in spatial transformation and then compare with change detection analysis using satellite images from the QGIS. The Average Rate of Spatial Change (ARSC) here is calculated based on the increase in the number of sub plots in the area by taking the arithmetic mean of the change rate over the periods in question [28]. Therefore, the rate of change based on the five-year periods is calculated in the following manner.
 The annual rate of change is then determined by:
3.2. Land Use Change in Peri-Urban Areas of Siaya
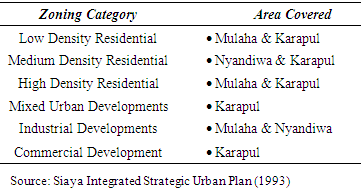
- In Kenya, it was the practice by the former local authorities to classify development applications for peri-urban areas as “isolated” plots and hence no standards were applied [42]. Therefore, land use change took place outside formal government control and did not follow prescribed urban planning processes. Peri–urban areas did not find formal recognition of their identity as a place and their roles in providing land resource for planned urban growth went un-recognized. However, urban growth occurred in the form of unplanned settlements characterised by inadequate infrastructure and services [44]. Unregulated developments give rise to horizontal expansion of urban structures. Emergent land use patterns, largely, indicated a mismatch with planning norms and standards [44]. As such, integrated urban planning and development should include peri-urban areas which are often isolated [44]. In Siaya Township Ward, the 1993 Integrated Urban Development Structure Plan documented unstable spatial form of the peri-urban places. This was partly due to capacity constraints, which limited Municipal government’s ability to effectively manage land use change and facilitate effective spatial organization; and the lack of funds to develop a land bank for urban development. The 1993 Structure Plan was the first comprehensive planning for Siaya. It planned for a growing township with a large portion of land being in the rural agricultural frontiers. The plan predicted a hexagonal growth pattern with highest growth taking place along the Karapul-Kirindo-Ngiya corridor, and the Mbaga-Komolo-Ndere growth corridor. The other growth corridors were Awelo-Nyandiwa corridor, and Mulaha-Boro growth corridor. This meant a projected urban growth by consuming the adjacent rural areas and bringing into the urban fabric an area with different spatial structure from the urban core, and which therefore would be largely affected by the land use change.The aim of the Siaya Integrated Urban Structure Plan 1993 was to create an urban balance and avoid large sub urban areas disconnected from the main urban core. It was also to allow for good zoning of land uses and incremental development [26]. The plan documented that the Siaya Municipal Council faced challenges in its attempt harmonize development activities of the rural areas brought under its jurisdiction by the gazettement of its boundaries. It identified that the extended rural areas of the Municipal boundaries required different planning responses and development control since the land tenure type had absolute control to the individual owner’s docket and was a major constraint to development control [26].The plan proposed a model aimed at optimal use of land within the then urban core, zoning the Municipal area into various broad land use classifications and indicating the overall pattern of land use expected in the Municipality within the plan period. The plan zoned 780 hectares of land for detailed area planning as a guide to development control, and did not cover the entire of the Municipality. However, detailed land use zoning plans were never prepared to give effect to the structure plan proposals. To facilitate development control, provide opportunity for detailed area plan and guide private developments to obtain congruent use of space, it was envisaged that the plan would be followed by comprehensive zoning regulations and action area plans. These were never achieved hence development proceeded in a free system with uncontrolled urban sprawl. The Siaya County Integrated Development Plan (2013 – 2018) recorded that its urban growth is marked by sprawl and unplanned urban expansion. It is an opportunistic urbanization eating up farmlands in the bordering rural areas as more urban type land uses (mainly residential and commercial) are taking up land space that was initially agricultural [16]. The plan recommends a county spatial planning framework to take into consideration the emerging land use structure and further proposed the preparation of advisory plans for all satellite market centres to mitigate the problem.From the analysis, it was evident that the land use planning of Siaya Township Ward’s peri-urban places has faced several challenges; one being that the land area is predominantly rural in character, and that land tenure is predominantly freehold. This scenario demands a unique set of planning responses for its land use change and development management processes that is not entirely within the control of current government instruments and development governance framework. Further, the freehold tenure type puts direct influence on land use change and the pattern of development on the individual owners. With the rising demand for housing developments, private developers continue to acquire and change use of land to housing and related development with little consideration of statutory planning requirements. The study also established that as opposed to the policy of peri-urban development is being considered as “isolated plots”, the peri-urban areas are an integral part of the urban growth process and needs an integrated approach to guide its land use change process.
3.3. Theoretical Framework
3.3.1. The Theory of Urban Expansion
- Urbanization of rural land is a complex phenomenon and that population growth is dependent on the extent of urban infringement [73]. Urban sprawl has an impact on the economy of rural area, as land in the urban areas is more valuable. This is the driving force land subdivision and conversions resulting into land use displacement [18]. As such, most urban areas development extends outward to the suburbs [73]. Therefore, the higher the likelihood of land use dominating, the less feasible for landowners to invest in farmlands [73]. This inclination to transform lands is even more, where land is used more for farming [51]. According to this research, the anticipation of urban infringement becomes a catalyst of land use transition in peri-urban areas. If the degree of anticipation decreases with the distance from the invasive city, so does the resulting degree of land use change before equilibrium is achieved where this anticipation stops.It also indicates that cities may possess a unique combination of various theories working together to influence the land use change and the emerging spatial structure [45]. When this is left on its own without policy and technical control, it is likely to lead to haphazard mixed developments and hence spatial instability [75]. There is need therefore for a framework that brings spatial balance; The theory therefore offers the closest single explanation to peri-urban land use change [73]. Consequently, metropolitan expansion would drive the outer fringe of urban areas into rural territory [29]. This development pattern cannot be stopped and its features and limits can therefore be difficult to define [29]. This theory has been endorsed by researchers who concluded that transition in peri-urban areas was irregular as land use was marked by increasing activities and populations [77].
3.3.2. Urban Land Market Theory
- The Urban Land Market Theory, was formulated as a way of understanding human actions in the suburban area and their resulting spatial configuration [4]. The emphasis was on residence and bid-rent for each household. The rental bid was described as the highest amount that a household was ready to pay for a unit of land at varied distances from the city center [84]. The theory premised on the Von Thünen model to account for suburban differences in land usage. As such, each form of land use had a unique bid rent which sets the highest amount of land use yield for a given area. Land uses negotiate for locations based on their bid rent rate and their connectivity to the city centre [41]. Every residence seeks to occupy as much space while complying with their access needs. As land is affordable in the urban fringe, residences with less need for proximity to the city center are situated on the outskirts [19]. As in Von Thunen's, this theory suggests a monocentric, systematic and standardized urban area with a CBD where individuals work and shop. There is a relationship of distance decay between land rent and distance from the CBD [35]. The longer a family stays from the city centre, the more it spends on transport and less on housing. In the basis of these hypotheses, the rent declines with distance from the CBD in order to cover travel costs [56]. The theory differentiates between two phases of residential location where households choose locations based on bid rent and the prevailing market. Most strategic locations go to the best bidder, and the cycle proceeds until the last affording user is found on the outskirts of the city [34].The Theory of Alonso thus gives a fixed synopsis of the use of urban land. Its relevance to this study lies in its explicit account of the overall housing and the manner in which land is distributed to different competitive uses [23]. Although this theory can be used to evaluate urban form, it faces a range of assumptions that hinder its utility in estimating land use patterns in peri-urban areas [76]. Alonso’s monocentric city assumption and accessibility to the centre is not sufficient in itself to explain the urban spatial structure. There are a number of other factors which account for the dynamics of land use change; the existence of more than one centre in metropolitan areas, issues of traffic congestion, imperfect markets and technological change. There is also an emergence of new generation home-owners who will buy land on the outskirts of urban areas to build their residential homes.In spatial structure, the most valued land is found near cities and goes to the highest bidder until the last user is found on the edge of the cities. However, this theory did not consider land use in peri-urban areas and though rents will decrease with distance from the market, emerging developments such as new infrastructure soon destabilize the market. to this extent, the theory is limited in explaining land use change and spatial transformation of peri-urban areas.
3.3.3. Plurality Theory
- Pluralism refers to a system of organization where different groups keep their identities while existing and interacting with other groups rather than just one group dictating how things go [37]. The Plurality Theory as applied in this study are adopted from the works of Von Gierke (1844-1921) which gave an impetus to the idea of groups associations and corporations as legal entities with a life of their own and independent of government. The Theory has been applied mainly in studies on land tenure and land management. However, the application of the theory remained at the level of articulating between the different structures by which land is accessed and regulated. In particular, they focused on the interaction and overlap between customary systems and conventional structures [40]. This study anchors on this theory, and seeks to project it beyond the construct of land tenure and land access to examine plurality in the context of land use change and spatial transformation of peri-urban areas. It projects the argument that in peri urban lands, the formal land use change management is inefficient and unsustainable. Though the governing regulations and institutional arrangements appear absolute, they are weak on development control and enforcement, and are incapable of delivering a controlled land use change and stable spatial transformation. The informal land use change systems however, appear disjointed but they dominate the peri-urban areas and are capable of adapting quickly to new circumstances and pressure. These informal systems are however unpredictable, haphazard and leads to spatial incongruence, land conflicts and disorganized peri-urban space [63]. Plurality in this study therefore expresses itself in two distinct systems; the formal, which emphasizes land as a resource whose organization and use should be guided by predetermined tenets for common good, and the informal which looks at land as a commodity whose transformation, should bring immediate personal gains [1]. The peri-urban land use change therefore moves along the commodity-resource continuum to determine the character of the resultant spatial transformation [16]. Therefore, it is proposed in this study that plurality of land use management systems in peri-urban areas is intimately connected to its spatial transformation characterized by haphazard spaces, land use conflicts, incongruence, and land use incompatibility. This study therefore examines the peri-urban land use change dynamics through the major change pressure points in the informal and formal governmental systems.
|
4. Methodology
4.1. Study Area
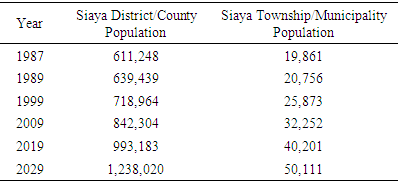
- The study was conducted in Siaya Township Ward of Siaya County in Kenya. The Ward is situated near the equator at Latitude 0,0600 (03'36.000"N) and Longitude 34,2861 (3417'9.960"E, GPS Coordinates), with an average altitude of 1224 m above sea level and an annual rainfall of between 1,170mm and 1,450mm and average temperature of about 24°C. Currently the urban core area sits on 3.6Km2 within the central part of Alego and covers in different proportions; parts of Nyandiwa, Karapul, Mulaha sub- locations. The population of Siaya township has been increasing over the years and is projected at 50,111 persons by the year 2029.
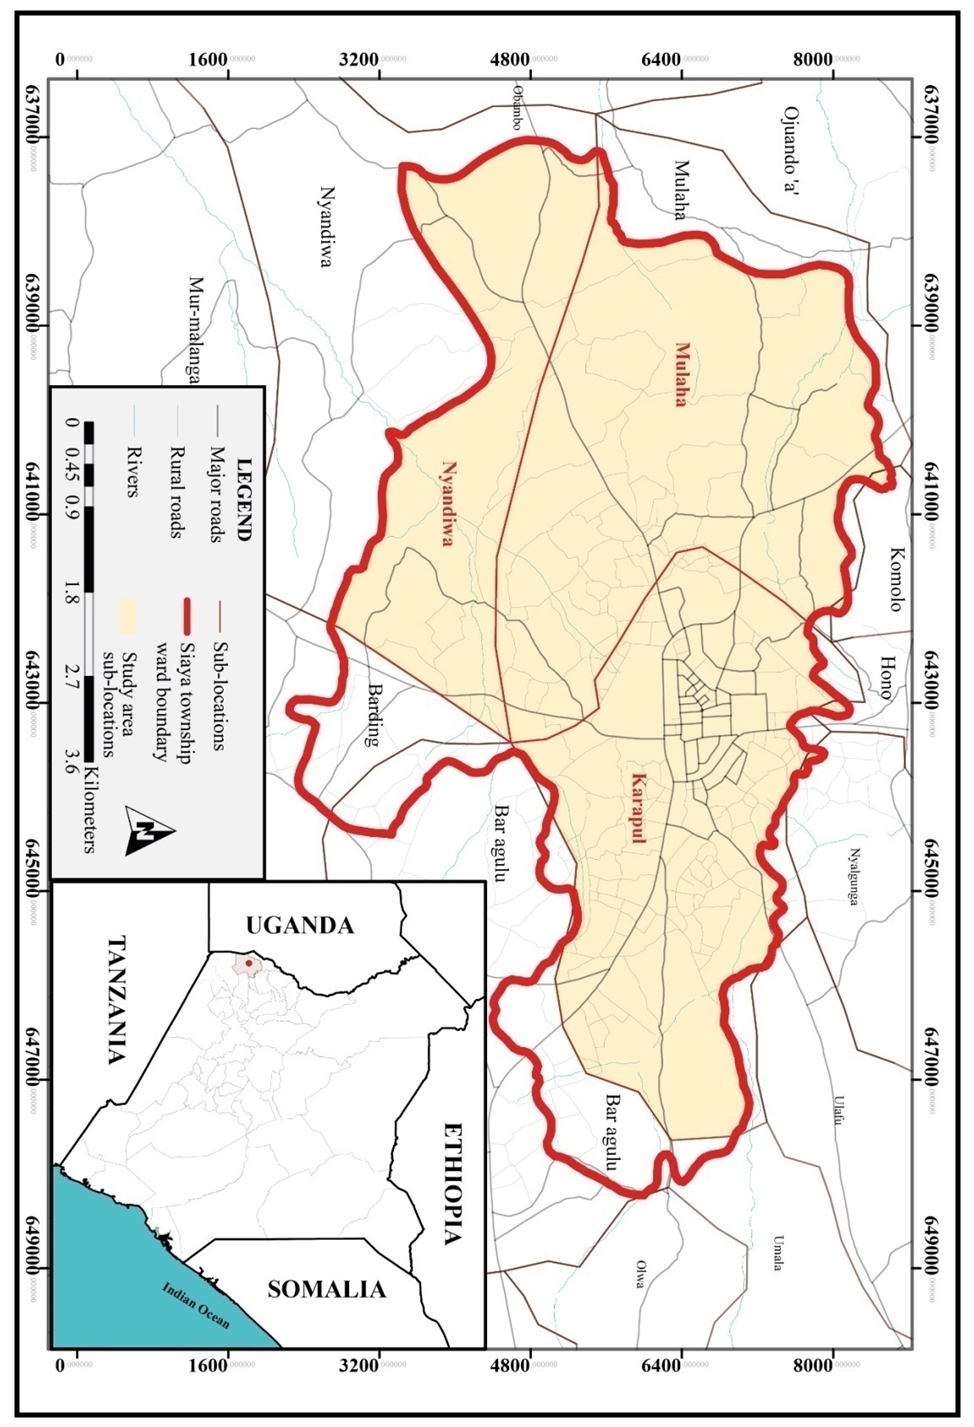 | Figure 1. Location of Siaya Township Ward |
4.2. Research Design
- This research adopted a cross-sectional survey research design and sought to explain land use change and its implications on spatial stability of peri-urban areas. A cross-section survey captures data to draw predictions about a research problem within a given period [2] and may be replicated regularly [47]. It also allows respondents to explain and document the status of variables and also enables use of both qualitative and quantitative data [68]. This research design also includes questions about what, when and how an occurrence happens [27]. From this perspective, the study investigated processes and related issues on peri-urban land use change in Siaya Township Ward using GIS and RS techniques for the period of 30 years (1987-2017).
4.3. Sampled Study Areas
- The study area was designated for change detection as it was susceptible to land use change as a result of ineffective planning. A survey of all peri-urban areas was undertaken and initial site analyses carried out by way of assessments to determine the spatial character of the area. The area was characterised with land fragmentation, land use conflicts, incongruent land uses, and haphazard developments among others. The spatial choice was determined by (1) areas where land use change has completely transformed the peri-urban spatial character as representing one category, (2) areas currently witnessing the advent of land use change and has not fully transformed. The justification for this choice was the search for an understanding of the complexity of land use change in peri-urban areas, and the need for analysing both the physical scales and also the system of land use change management. The site analysis resulted in maps and descriptions of the current situation of each location. The following aspects were analysed: (a) Physical environment; which looked at density of the built-up areas and how they are arranged in relation to each other; types of settlements, if they are permanent or temporary and in what condition are the buildings. The types of land use and the spatial conditions at the sites and the general trend of development. (b) Available infrastructure; which included existing roads, and their relation to the built-up area; and finally, (c) Land structure; which included the level of land fragmentation.Based on the reconnaissance, the study adopted a case selection approach and covered the following sampled peri-urban areas within Siaya Township Ward. Karapul in first category, Mulaha, and Nyandiwa in the second category. The objective of case selection was to obtain an appraisal and in-depth analysis of land use change characteristics and spatial transformation of the peri-urban areas in order to answer the study questions and accomplish the specific study objectives [75]. Selection was purposive and preceded by reconnaissance exercise involving the identification of the study location and categorization into spatial units according to state and extent of land use change. The other criteria applied included history of land use change and spatial characteristics was used to gather the data for spatial characteristics. 1. Nyandiwa and Mulaha: the sub locations were chosen to represent the category where land use change had recently begun and spatial change has not fully transformed the area. Nyandiwa abuts the town in a southwest orientation and is dissected into two by the Siaya Yimbo road D249. The study area covers two land registration sections, of Nyandiwa namely sections one and two. There is currently massive subdivision of initial agricultural land in the hinterland of existing market centers such as Awelo and Ombwede. Mulaha section adjoins the town area to the northeast side and depicts a generally residential character with isolated commercial and light industrial developments. Single storey residential houses mixed with rural type housing and isolated industrial uses, mainly posho mills.2. Karapul: Karapul represents one of the areas where land use change has completely transformed the spatial structure of the area. Karapul Ramba section 1 is relatively the most fragmented peri-urban area of Siaya Town. It adjoins Siaya Town to the northeast.
4.4. Methods of Data Collection
4.4.1. Remote Sensing
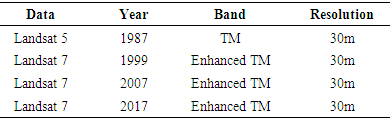
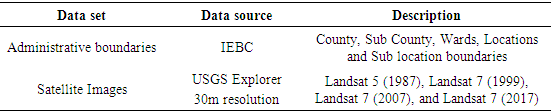
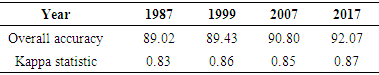
- The study utilized remote sensing data to describe, interpret and analyse patterns and processes that explain land use change of peri-urban areas. Remote sensing data is described as one that describes the spatial location of objects and borders on Earth [80]. Data in this research included Landsat satellite imageries and administrative boundaries of Siaya Township Ward. Landsat images for four periods, 1987, 1999, 2007 and 2017 were used, and consisted of multispectral data acquired by Landsat satellite for the months of December. Landsat data has been used because it is open and free access and promotes emerging technologies particularly those focused on large data sets, both in temporal and spatial [85]. The parameters of the satellite data collected for the study are as indicated.
|
|
4.4.2. Focus Group Discussions and Interviews
- A conventional requirement for focus group study is that there should be at least two groups for each social stratum in the sample [68]. This was based on small groups of not more than eight (8) people each and participants discussed land use change processes in a context where people were allowed to agree or disagree with each other. Land owners, land agents, physical planners and surveyors were interviewed. The study explored a range of opinions and contexts in terms of beliefs, experiences and practices on land use change and the process of management of land use change. Key land agents were interviewed following a snowball approach, starting at focused group discussions where key actors were identified. Interviews were semi structured to allow for other topics emerging during the course of the questioning. County Officials interviewed included: County Director of Physical Planning, County Director of Survey, County Lands Officer, County Works Officer, and Chief Officer Lands. Land Sector Professionals included five Physical Planners in Private practice and seventeen surveyors including a one licensed surveyor.
4.5. Methods of Data Analysis
- The study objective sought to assess the extent of land use changes in peri-urban areas of Siaya Township Ward from 1987 to 2017 and was analysed in the following stages: A. Content Analysis: This is a research technique used in making inferences by identifying information about the history of Siaya Township. The method involves observation and narration of phenomena with the intent to describe manifest content of communication [39]. The method was used to provide insights about the origin, past attempts of spatial planning and development control in Siaya town overtime. Information was presented inform of themes and maps. B. Spatial Analysis: This method is used to support decisions and reveal patterns through an interaction with Geographical Information Systems to transform and manipulate data to produce meaningful information [71]. In this research, this method was used to analyse the first objective, “to assess the extent of land use changes in peri-urban areas of Siaya from 1987 to 2017”. QGIS software, version 2.14.19 was used for spatial analysis. The software was chosen over other competing softwares since it is a free software and doesn’t require licensing to install [14]. Further, it contains remote sensing plugins such as the semi-automated image classification. Spatial analysis therefore entailed the following processes:i. Clipping of areas covering the years 1987, 1999, 2007 and 2017 using the vectorized boundary of Siaya township and identification of Regions of Interest (ROI) for the images covering the years 1987, 1999, 2007 and 2017.ii. Establishing a band set and specifying wavelength using semi-automated image classification. This was followed by a pre-processing analysis including pan sharpening of Landsat 7 imageries to achieve a 15m resolution. As well, the Landsat 5 imagery was projected using the Landsat imagery for 2017 to achieve a 15m resolution.iii. Running classification using maximum likelihood algorithm to derive land use for the 1987, 1999, 2007 and 2017, and further determining percentage change per land use class for each year.iv. Cross tabulation analysis to determine the quantitative conversions from each category and their corresponding land size for the year on pixel-to-pixel basis. C. Land Use Classification Scheme for Siaya Township Ward: To analyze the changes in Land Use Land Cover for Siaya Township for the period 1987 to 2017, the study focused on supervised classification for the land cover land use structure and composition (table 4).
|
5. Results and Discussions
5.1. Land Use Changes Over Time
- Change in land use may literally refer to the transition of a piece of land use from one function to another. For instance, land can be transformed from farmland to pastureland or from woodland to housing estates. the temporal land use transition is a vital component in the process of urban growth, and its comprehension and efficient management is essential to achieving sustainability.
5.1.1. Origin and Development of Siaya Town
- Originally, the place where Siaya Town stands today was called Bar-Siany Kochieng Adhege, meaning the flat swampy place of Ochieng Adhege. It was either the result of a typographical error or mispronunciation that resulted in the name Siaya rather than Siany. The location was at the convergence of four major clans, namely Jo-Kakan, Jo-Karapul, Jo-Hono and Jo-Kaluo. Being at the confluence of the three Clans, Bar-Siany became popular for sporting activities, mainly Ajua (Chess), Nyangore, (traditional dance), and Olengo (traditional wrestling) as well as trade which was located at Ka-Ahindi Ododa, currently known as Ahindi garden in the centre of the CBD.Ahindi Ododa of the Jo-Karapul Clan started the trading activities about the beginning of the First World War and the location was at the site presently occupied by the County Administration Offices. The Church Missionary Society (CMS) had by 1906 established a school (Mulaha primary) and later in 1914, a health centre (Current Siaya MTC), thereby enhancing the status of the trading center. In 1937, the greater Alego was divided into East and West and Mr. Ahenda appointed Chief of East Alego, and Amoth Owira remained Chief of West Alego. Chief Ahenda established his administration at Bar-Siany. This together with the sporting and trading activities at Ahindi greatly enhanced the importance of Bar-Siany, which gradually begun to curve its niche as a commercial entity. At independence in 1963, Bar-Siany had established itself strongly as a major administrative and commercial centre and being administered by the African District Council (ADC) of Kisumu. In 1969, Kisumu District Council was split into two and Bar-Siany became a district administrative unit, though for sometimes the administrative functions were carried out from Ukwala town due to lack of adequate infrastructure at Bar-Siany.
5.1.2. Physical Growth and Expansion
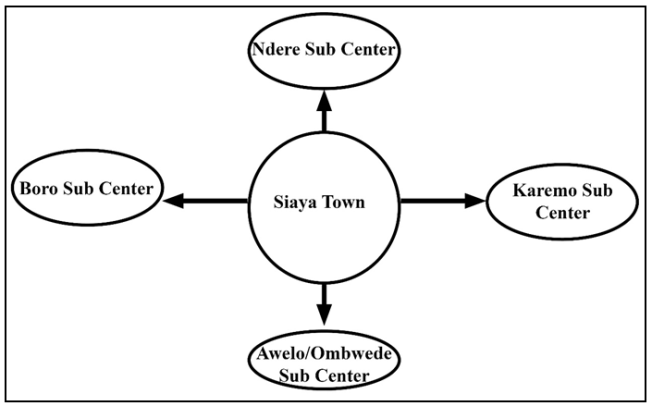
- The study of Siaya Township is pegged on 1987, being the year that it was upgraded from Urban Council to a Town Council with a defined boundary of 3.69 Km2 [26]. Its peri-urban areas covered the whole of Karapul section, Nyandiwa registration section, and Mulaha registration section, parts of Bar Agulu and Barding registration sections. Large parts of the region remained rural in character, and there were no land use plans to guide the expansion or the structure of the subsequent developments. The Township was again upgraded to Municipal status in 1995, but peri-urban places remained without a zoning plan after this upgrade. The first land use plan for Siaya was prepared in 1971 and covered mainly the public land area which included the areas covered by the then Siaya health centre, Ahindi garden trading market, the administration, law court and public servant’s residential area; the police station and core commercial area. The township area however, continued to grow, extended beyond the public land areas into the abutting freehold lands in the peri-urban areas, and continued to grow to cover 16.2 Km2 of rural peri-urban lands. This absence of a broad spatial planning framework necessitated the preparation of Siaya Integrated Urban Structure Plan (IUSP) initiated by the Siaya Town Council in 1993, to guide growth from the period 1993 to 2013. The plan was completed and adopted in 1996 by the then District Development Committee (DDC) and the Siaya Municipal Council Works, Housing and Town Planning Committee (SMC/MTG/2/3/96) and approved by the full council resolution (SMC/SMC/96/3/10). The Minister for Lands as was required under the Physical Planning Act Cap 286 however never approved the plan. The plan provided a framework for future management of growth of Siaya Township Ward with the objective of achieving a coherent system of human settlements. Whereas the plan indicated the expected land use patterns and the manner in which both the public, leasehold and freehold lands should be used, it did not provide a framework for development control and prescriptive standards to guide land use change. The plan shows various categories of land uses in broad zones and earmarked various sites for public purposes in freehold lands. The plan was not followed by stepped down zoning plans or action area plans that should have guided the manner of land use change and character of expected developments for the freehold lands, nor did it provide for the mechanism of acquiring and vesting the places earmarked for public purpose in private lands. The IUSP (1993) set the growth strategy for Siaya in a four directional linear mode radiating from the town center towards Karemo on the East, Ndere on the North, Boro to the South West and Awelo/Ombwede to the West as indicated in figure 2.
 | Figure 2 |
5.1.3. Management of Physical Growth and Expansion of Siaya Township Ward
- Analysis of the IUSP (1993; revised 2002) revealed that it was an urban containment model that aimed to confine urban development within the boundaries of the identified growth nodes. The study established that the IUSP remained the principal land use reference frame for decision-making by the authorities on whether to grant development approval. However, developments continued to occur in an informal manner without tangible guidance or control mechanism.
|
 | Figure 3. Siaya Town Physical Development Plan of 1971 |
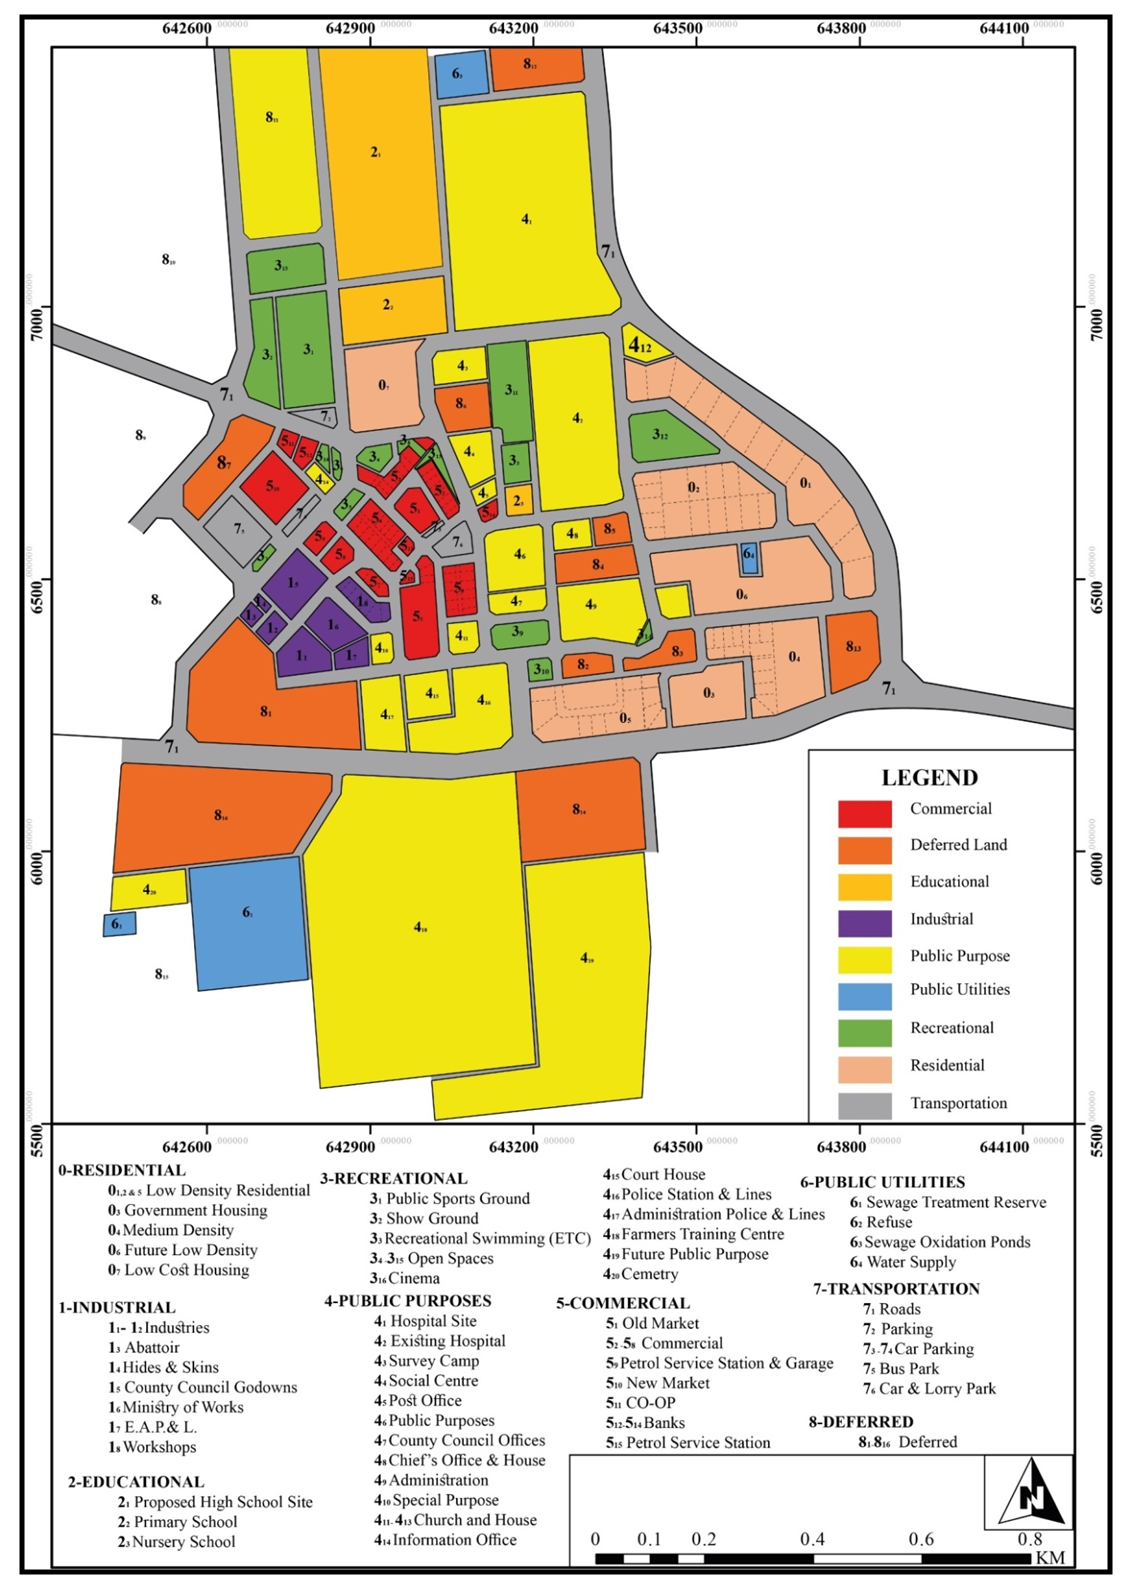
 | Figure 4. The ISUP 1993 Revised 2002 |
5.1.4. GIS and RS Analysis of Land Use Change of Peri-Urban Areas
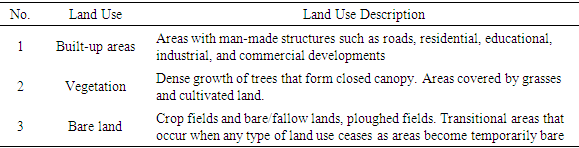
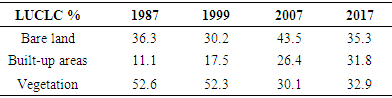
- This study utilized GIS and RS applications to distinguish the extent of land use changes occurring in peri-urban areas of Siaya Township Ward over 30 years’ time period. According to [70], change detection from remotely sensed images is helpful for assessing landscape changes; however, the results may not be as precise as those obtained from field monitoring especially for small or local based landscapes. Change detection technique was used to identify, map, and analyze spatial landscape patterns through thematic change detection workflow in Quantum Geographical Information System (QGIS) for the different times for the selected peri-urban areas.Topographic map analysis was used to spatially position field samples and data collected in the field. Using field-collected data and those derived from satellite images, it was possible to clearly identify the nature of the change that has taken place between the specific sampling dates. The land cover maps obtained from classifying the Landsat imagery for 1987 to 2017 were used as input in to QGIS change detection work flow to quantify areas of change and extract landscape spatial patterns. The study involved identifying and delineating different land use categories and analysis of pattern of change from 1987 to 2017 to determine the general patterns of landscapes and spatialactivity in the different peri-urban zones through spatial mapping and comparison of the land use changes.The utilization of remotely sensed data offers precise, timely and comprehensive knowledge for the detection and estimation of changes in land cover overtime [28]. The patterns of change were computed and the resulting land use maps generated through supervised classification. Landsat images were processed and analyzed for changes in land use and land cover for the years 1987, 1999, 2007 and 2017. Land cover was classified into three classifications, including bareland, vegetation and built-up areas, as shown in Figure 5. The figure indicates the progression of land cover of the three classifications from 1987 to 2017. By coding the various classification periods, change maps for each year were processed to indicate a complete matrix of change. From this classification results for the various periods, change maps were produced to show a complete matrix of change as shown in table 6 which provides a summary of results in percentages.
|
|
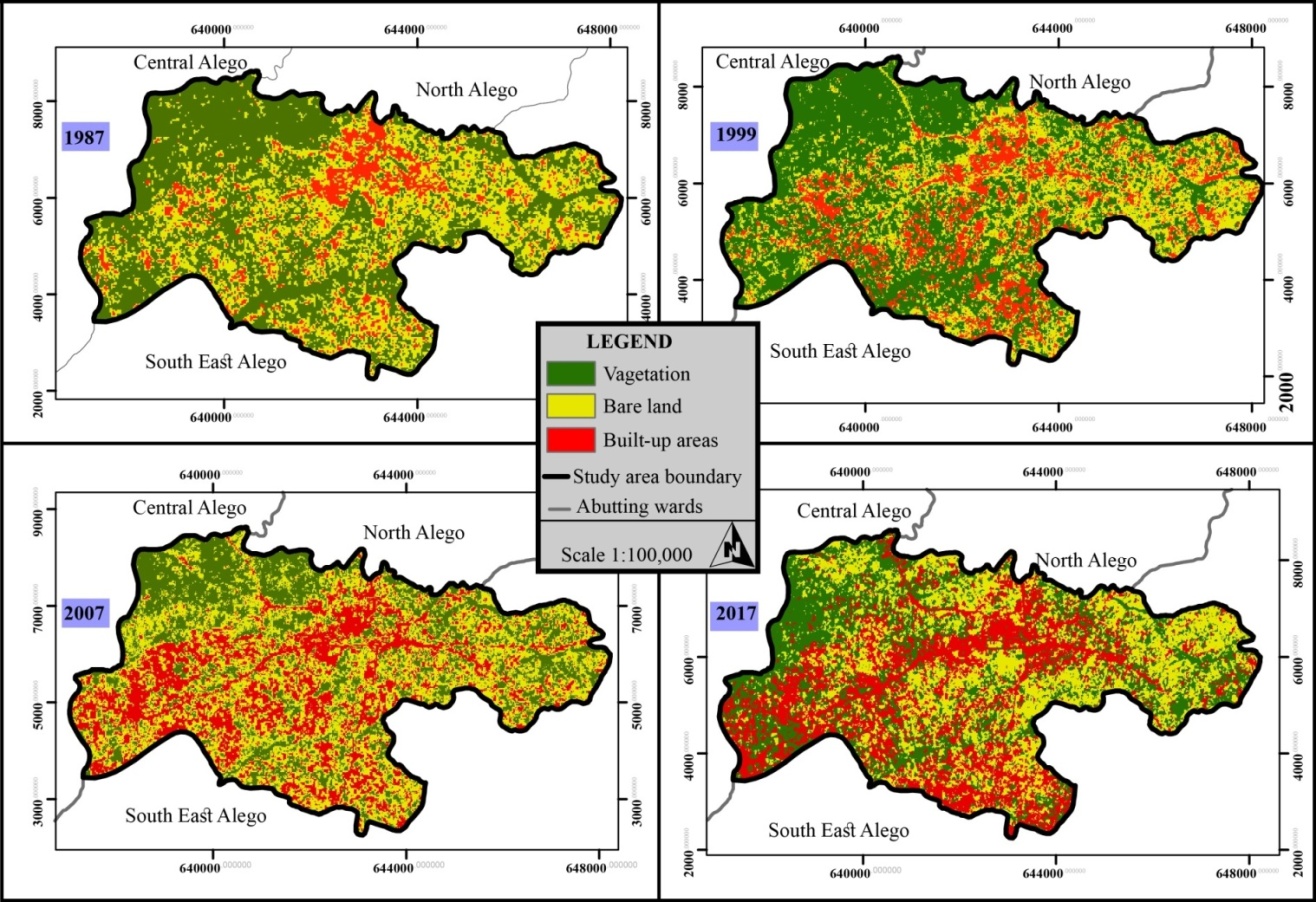 | Figure 5. Land Use/ Land Cover Maps for the period 1987 to 2017 (Source: Field survey data) |
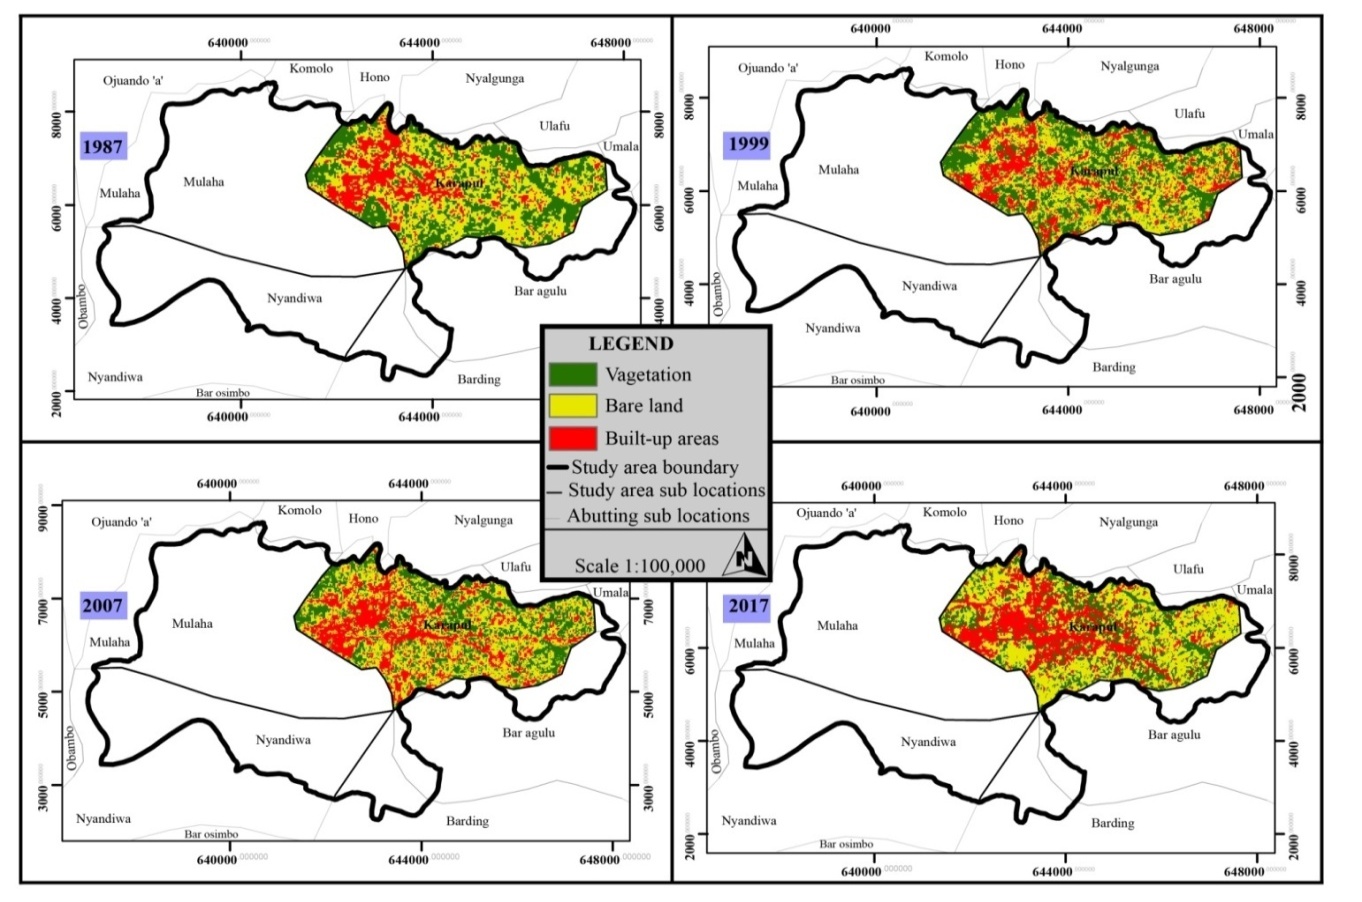 | Figure 6. Karapul Land Use/ Land Cover Maps for the period 1987 to 2017 (Source: Field survey data) |
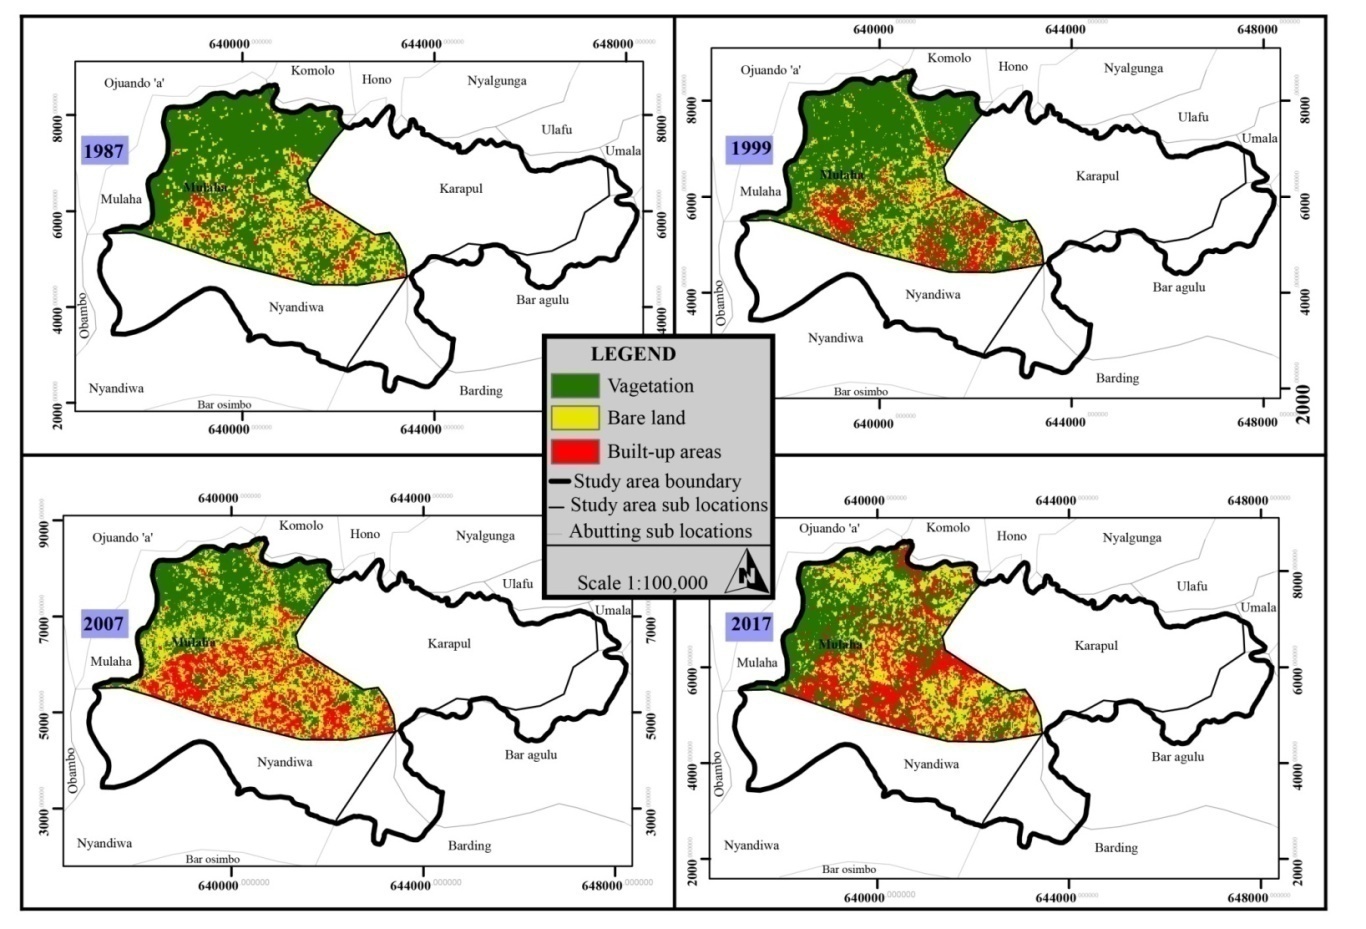 | Figure 7. Mulaha Land Use/ Land Cover Maps for the period 1987 to 2017 |
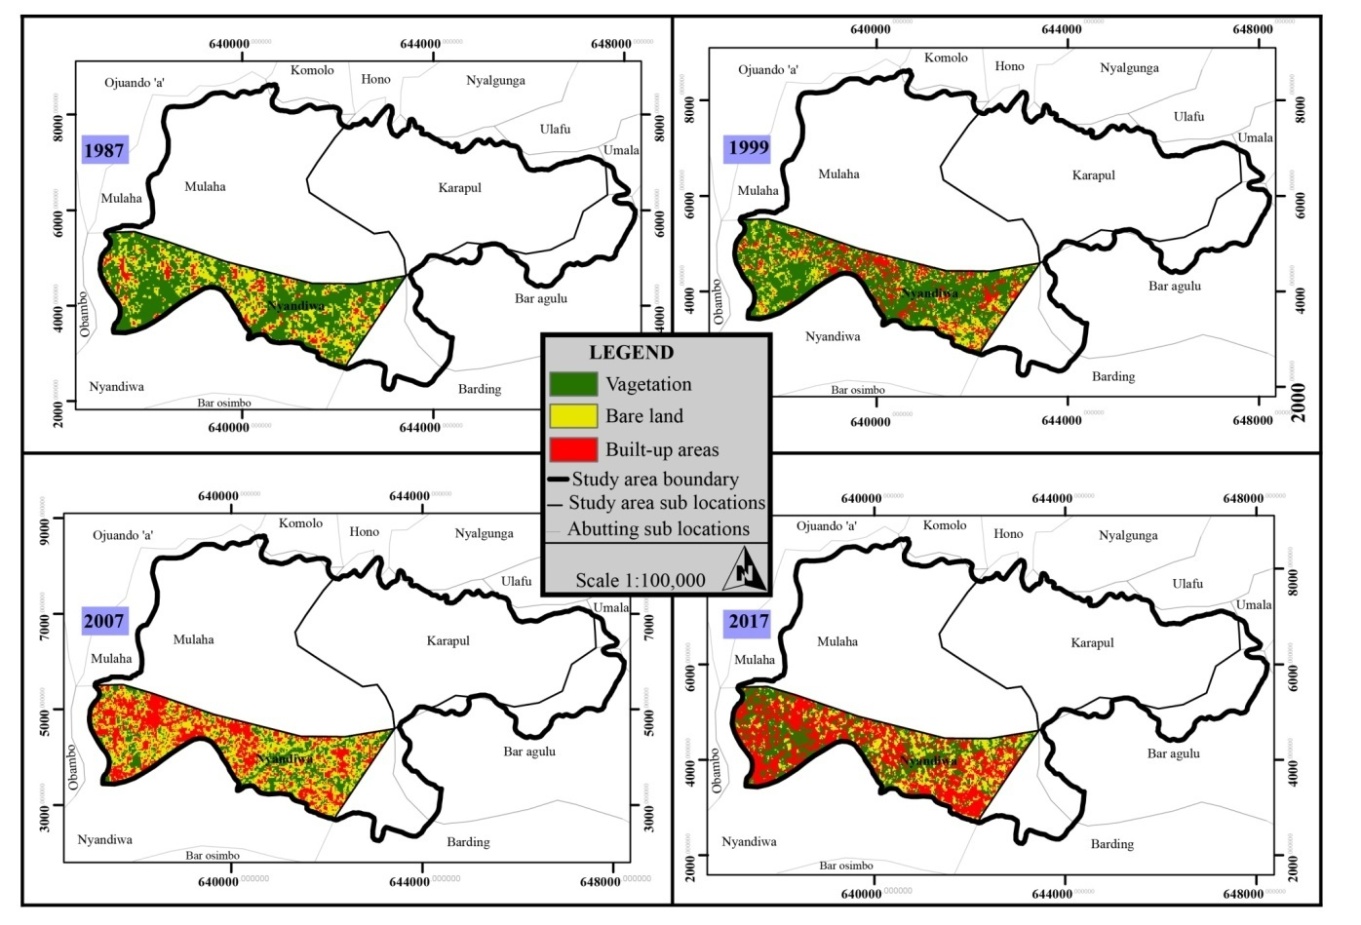 | Figure 8. Nyandiwa Land Use/ Land Cover Maps for the period 1987 to 2017 |
5.1.5. Test of the Hypothesis
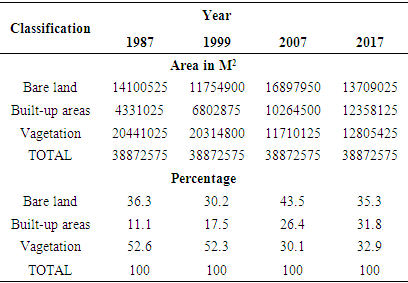
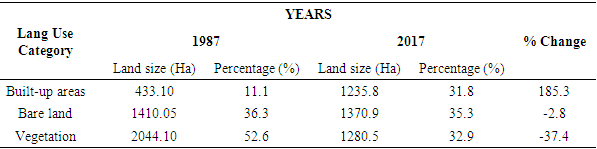
- The main objective of this study was to assess the state of land use changes in peri-urban areas of Siaya Township Ward from 1987 to 2017. The corresponding hypothesis therefore, was that there is no statistically significant change in land use classes during the study period 1987 to 2017. The Independent variables for change detection include built-up areas, vegetation and bare land. The study used percentage change analysis on each land use class for the hypothesis testing. The comparative results for the period of 30 years are indicated in Table 8. To compare the land cover percentage, change in each class for the period of 30 years (1987-2017), the results indicate significant increase in built up areas and decline in bare land and vegetation. To establish the changes, land sizes in each classification for the year 2017 were divided by the land sizes per category for the year 1987 multiplied by one hundred (100) and the result deducted by one hundred (100). Results indicated that built-up areas had increased by 185.3% and a decline in vegetation and bare land by about 37.4% and 2.8% respectively from 1987 to 2017. During the study period, significant change in built up areas and bare surfaces (433125m2 to 12358125m2) built up areas and commensurate reduction in vegetation land (20441025m2 to 12805425m2) was analysed. This revealed rapid urban development depicting an urban sprawl phenomenon. In addition, bare surfaces also reduced from 14100525m2 to 13709025m2 (Table 8).
|
|
|
|
5.2. Discussion of Results
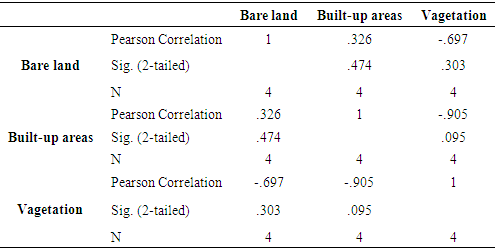
- The study sought to establish land use changes in Siaya Township Ward for the period of 30 years (1987-2017). Land uses were classified as bare land, vegetation and built-up areas. The findings of the study indicate significant land use changes between 1987-2017. Built up areas in Nyandiwa, Mulaha and Karapul increased by 444.3%, 339.2%, and 48.6% respectively. This indicates that rapid expansion of built-up areas within Siaya Township occurred in the peri-urban areas namely Nyandiwa and Karapul for the period of 30 years. Change in urban and peri-urban landscapes is attributed to certain changes in land use and land cover [81]. Rapid urbanization, population growth, and increase in human activities competing against scarce land are among the many drivers of LULCC in Kenya [54]. A study by [65] established a strong correlation coefficient (R) between population growth and increase in built up areas, r = .970, p = .000, which was not only highly positive, but also equally statistically significant. This therefore implies that population growth is directly proportional to the expansion of built-up areas. Vegetation cover indicated a significant decline for the same period. For instance, vegetation in Karapul declined by 28.7%, 44.9% in Nyandiwa and 38.9% in Mulaha. Relatively, Peri-urban areas (Nyandiwa and Mulaha) constituted highest vegetation loss. This finding is in agreement with [8] who in their study found that much loss of vegetation was as a result of increasing human developments such as residential, industrial and commercial uses rather than for agriculture. In Siaya township, it is evident from the results that plant biodiversity conservation is facing competition from other human needs such as housing, transportation, industrial and agricultural development. Conversion of vegetation cover to urban land uses raises impermeable areas and thus decreases infiltration into underlying soils [50], accelerates storm runoff, which contributes to elevated levels of contamination and flooding, and result in an increase in surface temperature due to urban heat islands [59].On the other hand, bare land increased significantly in Mulaha (19.6%) and Karapul (1.9%). However, it declined significantly by 33.0% in Nyandiwa during the same period. Comparatively, Nyandiwa has had higher land conversions resulting into high percentages of increase in built up areas and decline in vegetation and bare land. This finding agrees with a research that found that increase in built up areas result into a decline in both bare land and vegetation [3]. This disagrees with the notion that built-up areas often infringe upon bare land unlike vegetated areas [58]. The rise in the bareland observed in Mulaha and Karapul poses significant environmental risks, such as erosion and leaching of nutrients in the locality and contamination of groundwater, streams and rivers [50].Comparative results for the entire Siaya township ward indicated that built-up areas had increased by 185.3% and a decline in vegetation and bare land by about 37.4% and 2.8% respectively from 1987 to 2017. This significant changes in the three classifications studied disagreed with the findings of a research conducted in Kigali for the period 1984-2015 which established that land cover pattern remained stable for vegetation and highly changed in built-up areas [62]. However, it agrees with the findings of a research conducted in Kisii town that built up areas recorded the highest expansion in Kisii town for the period 2005-2017 [65]. Consequently, changes in peri - urban areas respond to pressures that are primarily related to the increasing population [31]. As changes in land use trends, sizes and intensities escalates, vegetation cover in Siaya Township Ward will be strained.
6. Summary of Findings
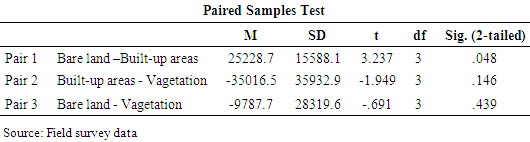
- Reviewed literature revealed that increasing urban growth has an implication on the peri-urban areas in terms of emerging patterns of land use and expanded urban sprawl. This is so as the modern world continually urbanizes, with drastic population growth in developing countries [57]. This and subsequent demand for urban land will be as a result of rural agricultural land conversions at the periphery of the existing built-up area into urban places [78]. This is because urban growth in Africa is mainly horizontal and spatially disaggregated. Past studies on land use change pay attention to methodological aspects of change rather than impacts of the process. Furthermore, the scientific concern with land use change has been complicated by the fact that its object and process is itself subject to change [64]. Sustainable land use systems planning and management requires a wider understanding of the spatial extent and detailed human-ecosystem interactions [31]. The study established that land use change in peri-urban areas of Siaya Township Ward has been unprecedented for the three decades without planning and development control. Three peri-urban places were chosen for detailed analysis namely Karapul, Mulaha, and Nyandiwa. Analysis was done using PIDs on the rate of spatial change on individual plots as a result of land subdivision over five successive year periods between 1987 and 2017. This analysis of change conforms with the results of GIS and RS change detection between 1987 and 2017. The study revealed a negative change in vegetation classes with a corresponding positive change in built up areas. The built-up areas in Nyandiwa, Mulaha and Karapul increased by 444.3%, 339.2%, and 48.6% respectively. This indicates that rapid expansion of built-up areas within Siaya Township occurred in the peri-urban areas namely Nyandiwa and Karapul for the period of 30 years. Vegetation cover posted a significant decline for the same period. For instance, vegetation in Karapul declined by 28.7%, 44.9% in Nyandiwa and 38.9% in Mulaha. Comparative results for the entire Siaya Township Ward indicated that built-up areas had increased by 185.3% and a decline in vegetation and bare land by about 37.4% and 2.8% respectively from 1987 to 2017. This fact underpins the element of human settlement as the main driver of land use change phenomenon in peri-urban places and it is the main reason why the land near and around the main urban area is the most affected. With the current increase in population, the rates, extents and intensities of land use changes may also continue to experience continued increase. Further, test of hypothesis was done using paired sample t-test. The test found a statistically significant difference between bare land – built-up areas (t = 3.237, p =.048); built-up areas – vegetation (t= -1.949, p = .146); and bare land – vegetation (t = -.691, p = .439). The null hypothesis was therefore rejected at 95% confidence level.
7. Conclusions
- The concludes that there have been significant changes in land use during the study period (1987-2017), and that this change has been characterized by spatial instability indicated in disorganized land use development, incompatible land uses, haphazard developments and lack of distinct spatial order.