Mohd Faiz 1, Alia Yusuf 2, Victor Saikhom 3, Samreen Fatima 1, Ziaur Rehman Ansari 1
1Interdisciplinary Department of Remote Sensing & GIS Applications, A.M.U., Aligarh
2Geology Section, Women’s College, Aligarh Muslim University, Aligarh, U.P., India
3North Eastern Space Application Centre, Deptt. of Space, Govt of India, Umaim, Meghalaya
Correspondence to: Ziaur Rehman Ansari , Interdisciplinary Department of Remote Sensing & GIS Applications, A.M.U., Aligarh.
| Email: |  |
Copyright © 2020 The Author(s). Published by Scientific & Academic Publishing.
This work is licensed under the Creative Commons Attribution International License (CC BY).
http://creativecommons.org/licenses/by/4.0/

Abstract
As carbon based fossil fuels are becoming rapidly scarce, renewable energy sources are coming to the forefront of policy discussions around the globe. As a result, the State of Meghalaya has implemented aggressive goals to achieve energy independence by 2030. Renewable electricity generation using solar photovoltaic technologies plays an important role in providing electricity in Remote area. This study utilizes geographic information systems (GIS) and unmanned aerial vehicle (UAV) data with statistical analysis to identify how much solar irradiance exists for rooftops in residential complex. This study helps to quantify the magnitude of possible solar photovoltaic (PV) potential for Solar World SW260 monocrystalline panels on residential rooftops within the study area. Three main areas were addressed in the execution of this research: (1) modeling of buildings, (2) identify potential rooftops for solar radiation, and (3) calculating the amount of energy generated from incoming solar radiation. High resolution UAV data and Esri’s solar modeling tools are used to calculate incoming solar radiation on a sample set of digitized rooftops. Sample set rooftops were analysed using a photogrammetric techniques by generating 3D model of buildings to identify the rooftop area, facing, shape and elevation. The multipatch file of study area is sample set of rooftop which was applied to ArcGIS analyst tool to calculate total PV potential. The total study area statistical analysis findings estimate photovoltaic electric energy generation for rooftops is approximately 16 kwh perday, which is 26% of total energy demand of residential complex. This is approximately 26 percent of the total electricity the utility provided to the entire residential complex for the use of low energy consumption devices.
Keywords:
UAV, PV, GIS, Photogrammetric Techniques, Monocrystalline, Solar Radiation
Cite this paper: Mohd Faiz , Alia Yusuf , Victor Saikhom , Samreen Fatima , Ziaur Rehman Ansari , Solar Potential Estimation by Reconstructing 3D Model of Buildings- A Case Study of Residential Complex NESAC, Meghalaya, India, American Journal of Geographic Information System, Vol. 9 No. 3, 2020, pp. 75-82. doi: 10.5923/j.ajgis.20200903.01.
1. Introduction
Around the world, anxiety is ascend over conventional carbon based energy production. The issues at hand are countless and include increasing the concentration of carbon dioxide in atmosphere due to the emission of greenhouse gases, using energy production techniques for to secure environment, rapid change in energy prices, and depleting carbon based fuel reserves to name a few (Nguyen and Pearce 2010; Choi et al. 2011). As a result, countries are facing a lot of problems to diversify energy sources and bringing renewable generation to lead the policy discussion. The main sources of world’s energy generation are the fossil fuels (gas, oil and coal) and nuclear power plants. Due to the usage of fossil fuels, greenhouse gases (CFC, CH4, O3, but mainly CO2) emits into the atmosphere. From the nuclear power plant, carbon is released in a small amount (90 grams equivalent of carbon dioxide per kilowatt hour) [1]. But the radioactive waste remains active over thousand years which is a potential source of environmental pollution. Global warming as well as the environmental pollution is, in our times, the greatest environmental threat to human being. On the other hand, there is an alarming energy crisis world-wide as fossil fuel reserves. Decrease and the ageing power plants are going to close in near future. From the aspect of global warming and shortage of natural gas, scientists and engineers are looking for clean, renewable energies. Solar energy is the one of the best options. Because the earth receives 3.8 YJ [1YJ = 1024 J] of energy which is 6000 times greater than the worlds consumption [2]. The solar energy sector in India has seen an exponential growth during the last five years and we expect it to grow in the same way for the next decade or so with various national and regional pro-solar policies in place. A large number of initiatives under the umbrella of JNNSM are boosting the solar PV sector in particular. The Government of India has announced a revised target of 175 GW of solar PV by 2022 out of which 40 GW has to be accomplished through decentralised grid connected rooftop systems. [3] A substantial amount of these rooftops systems are expected to come up in various urban and semi-urban centres of the country. It therefore becomes very important to estimate. As of October 2017, Meghalaya had a total installed power generation capacity of 558.32 MW, comprising 353.03 MW from state utilities and 205.28 MW from central utilities, the total installed power generation capacity, 387.19 MW was contributed by hydropower, 140.09 MW by thermal power and 31.04 MW by renewable power. During 2015-16, 315 KW SPV power plants of different capacities were being installed across government buildings as well as rooftops in the state. Work on manufacturing of 10 KW wind solar hybrid system in the government college at Tura has also been taken up during 2015-16. As per the budget 2017-18, Meghalaya New and Renewable Energy Development Agency (MNREDA) are implementing projects to popularize renewable technologies such as solar, wind, biogas, biomass, etc. Under the solar component of new and renewable energy, 1067 KW of solar power plants have been installed in the State so far. The Government is setting up two Solar Parks of 10 MW each in the East Jaintia Hills and the West Jaintia Hills District. The space application plays an important role in this study, as the information is gathered in the form of photographs taken by UAV and satellite data. This data gives the knowledge about the features present in study area. Different features have different reflectance and absorption property which demarcates the amount of solar energy gets reflects and absorbed by the surface. Photovoltaic (PV) or Solar cells convert sunlight directly into electricity. PV systems can be integrated in the building skin, i.e. roofs and facades (Gutschner et al., 2002) [4]. The electricity generated by the PV systems installed on the rooftops of residential, commercial, institutional and industrial buildings can be fed into power grid at regulated feed-in tariffs (referred as Grid-connected Rooftop Solar Installation), or can be used by building for self-consumption. In this context, Ministry of New and Renewable Energy (MNRE) initiated a programme on “Development of Solar Cities” and identified cities to become ‘Renewable Energy Cities’ or ‘Solar Cities’, aiming to meet a minimum 10% of their projected demand of conventional energy at the end of five years, through a combination of augmentation in supply from renewable energy sources and energy efficiency measures like smart street lighting etc. [5]. Furthermore, in order to mitigate the ever increasing challenges of resource constrained urbanization in India. 'Smart Energy' is considered one of the pillars of Smart Cities, wherein solar energy can contribute significantly towards reducing dependence on non-renewable energy. However, it remains obscure that how much of the solar energy resource exists over these buildings, which can be tapped for meeting their energy demand. Photovoltaic (PV) is the renewable energy technology with the highest potential in the urban context; it is versatile and does not produce any noise or pollution. Photovoltaic is ready for introduction into urban areas in several applications like multi-functional building elements, energy supply systems for public information boards, traffic control, telecommunications systems and other infrastructures. [6]The aim of the study is to know how much solar power the residential complex could get from its buildings to promote the development of solar power. For doing this, the first step is to reconstruct the 3d model of all buildings by using Bentley Micro-station to have a general idea about their roof types, elevation and to know the roofs where it is more suitable to install PV cells. From that point, another study on the quantity of solar power that could be obtained from those more suitable buildings were performed using a different tool.
2. Study Area
The Residential complex of North Eastern Space Application Centre at RiBhoi, Meghalaya, 800 meters away from the Head Office was chosen for this study (Figure 1). The Residential Complex is centered at 25°40'12.25"N, 91°54'43.78"E and measures 25,191 m². The Residential Complex is it consist of C, D, E type of quarters (depending on the grade and facilities) each have four flats, Director’s House, Guest House, Badminton Court and Departmental Store. Each building has Gable type rooftop facing towards North East and its opposite direction. The climate in Residential complex is warm and temperate. In winter, there is much less rainfall in Residential Complex than in summer. This climate is considered to be Cwa according to the Köppen-Geiger climate classification. The average annual temperature in Residential Complex is 20°C. Precipitation here averages 4169 mm. July is the warmest month of the year. The temperature in July averages 23.9°C. January has the lowest average temperature of the year with 13.5°C. The driest month is December, with 7 mm of rain, with an average of 1051 mm, the most precipitation falls in June.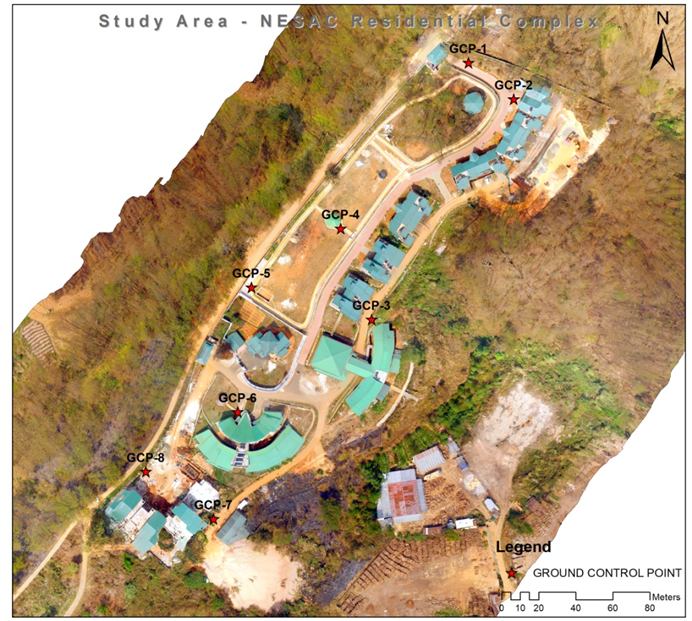 | Figure 1. Study area with Ground Control Points |
3. Data and Tools Used
While the data analyzing was carried out using Geoinformatics technology for a period of 12 months, both primary and survey data were used along with some tools and software including PIX4D MAPPER, ERDAS IMAGINE, PHOTOMOD UAS, BENTLEY MICROSTATION, ArcGIS.Primary data used in the study include remote sensing satellite data. Data available from January, 2018 to December, 2018. Based on the availability of satellite images, the time period for analysing the optimal rooftops for solar radiations using geospatial techniques is 12 months, i.e., January – December of 2108. Satellite images of LANDSAT 8 (Level 1) [7] and UAV images were used. Remote sensing data used are satellite data and UAV data between January - December of 2018 downloaded from USGS Earth explorer. Image data has been collected from with the help of ZENMUSE X3 cameras (focal length= 3.71mm) mounted on UAV (Hexaxcopter) at 60 m height. Images are taken in three strips with 70% frontlap and 40% sidelap overlapping. The study area was separated into 32images. Point cloud data is generated from these images. It is a type of vector data in which spatial location is explicitly stored in each point (Chen 2007) [8]. A high density point cloud therefore has a much larger file size than imagery with the same resolution (Chen 2007).The point data obtained for this study with the help of DGPS is ground points. This ground control point is used in data processing for georeferenced the study area. For this study, 8 GCP’S were collected from different locations to create the block bundle adjustment. With the help of BBA proceed to generation of Digital Surface Model that contain the elevation information for the built environment and vegetation on the ground.All the three (PIX4D MAPPER, ERDAS IMAGINE, PHOTOMOD UAS) software has been used in the whole study for data processing, DSM/DEM generation, Orthorectification and Orthomosaic. Pix4d is more users friendly then other two. Pix4d has simple steps; user can process data easily and automatically by clicking the magic button “START”. Pix4d have apability to generate point cloud, Orthorectification, orthomosaic and DSM without ground control point but accuracy is low. Pix4d has limitation for 3d digitization. ERDAS IMAGINE and PHOTOMOD UAS required skilled user for data processing because, it doesn’t contain simple steps like pix4d. They didn’t provide capability to generate DSM/DEMor orthorectification/orthomosaic without ground control points and exterior orientations. If GCP’s is not present in PHOTOMOD UAS at the time of aerial triangulation procedure, it provides the possibility to adjust a block in free model, which allows proceeding to block adjustment [9]. Both of them have advantage of 3D digitization. ERDAS EMAGINE is little bit simple then the PHOTOMOD UAS and have inbuilt AUTOCAD software Microstation Bentley helps in generating 3D models. ArcGIS software is used to find out the Land Surface Temperature of the study area in different months. Spatial analyst tool is used to calculate the solar radiations on the rooftops.
4. Methodology
This involves various steps which are shown in the flowchart (Figure 2) and discussed below: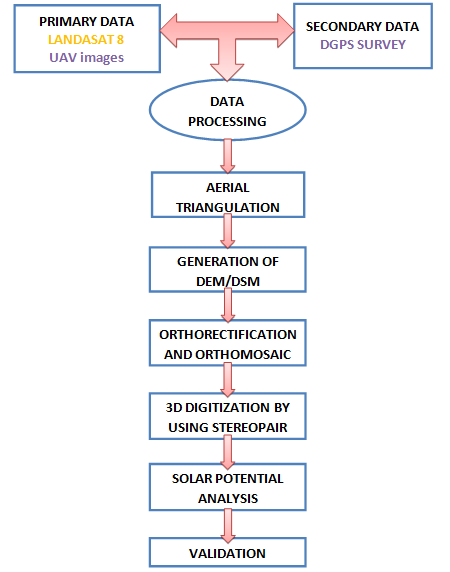 | Figure 2. Flowchart of Methodology |
4.1. Data Processing
The very first step is of Data processing which was done using the Pix4D software as it has the capability to provide information about the camera as the time of data processing. Only images and GCPs provide as input which gives information of keypoints extraction and matching, camera model optimization i.e., calibration of focal length and exterior orientation of camera, and geolocation information which create Automatic Tie Points. these are the basis of next processing steps including Point Cloud, Mesh, DSM and Orthomosaic.
4.2. Aerial Triangulation
Next step is of aerial triangulation which is done to refine the Exterior Orientation parameters computed through direct geo-referencing for each imagery which will help to achieve the desired accuracy while generating DEM. For this highly automated aero triangulation approach that minimizes the manual intervention and increases accuracy towards higher side was followed.
4.3. DEM/DSM
A digital elevation model or DEM is a representation of the terrain (bare-earth) with elevations at regularly spaced intervals. A digital surface model (DSM) also contains elevations at regularly spaced intervals; however, the elevations represent the first reflected surface detected by the sensor. These first returns may be reflected by bare ground or by surface features such as trees and structures. The automatically extracted and calculated mass points are used as a basis for constructing a DSM. DSMs are constructed differently depending on the specified DSMoutput type. The use of LPS software of Leica Geosystems to extract DSM from aerial photography includes (ERDAS, 2015) [10].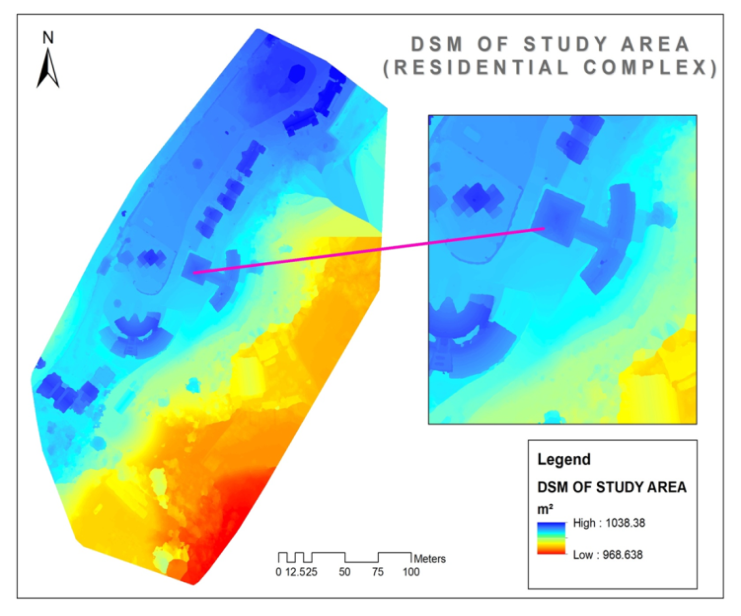 | Figure 3. DSM of Study area |
4.4. Orthorectification and Orthomosaic
Orthorectification is the geometric transformation of an image in which image displacements due to sensor orientation and terrain are corrected to the projection of a map coordinate system. The accuracy of an orthorectified image and its assigned georeferencing information is dependent on DEM and the quality of the sensor model. Orthorectification is the process of reducing geometric errors inherent within photography and imagery. The orthorectification process takes the raw digital imagery and applies a DEM and triangulation results to create an orthorectified image. Once an orthorectified image is created, each pixel within the image possesses geometric reliability. Thus, measurements taken off an orthorectified image represent the corresponding measurements as if they were taken on the Earth’s surface [11]. It is done using ERDAS Imagine software.
4.5. 3D Digitization by Using Stereopair
The reconstruction of 3D object can be described as taking as input a pair of 2D stereo photos and producing as output a scene of 3D points constructed using those photos. Digitization of roof tops from stereopair in ERDAS IMAGINE (Imagine Photogrammetry) is done with the help of 3D goggle. ERDAS IMAGINE has inbuilt AutoCAD software Bentley Microstation. As the digitization is start on stereopair photographs imprints roofs has been created on procart600 (Bentley Microstation). PRO600 CART enables 3D feature collection and editing on features. All the digitize rooftops are shown in the PROCART600 having different elevation from the ground. It has a capability of getting elevation of building rooftop from the ground. Height of buildings can be defining manually as well as automatically. Manually at the time of rooftop digitization or automatically with help of PROCART600 editing library. After the 3D structure has been created editing library and give smooth solidification to structure for 3D view.
4.6. Solar Potential Analysis
Solar potential analysis was performed on the 3D model that has been generated from the stereopair images of study area. 3Dmodel of buildings are in colloda format that has been converted into multipatch format using 3d analyst tool in ArcGIS. For solar radiation analysis raster file are required, so the multipatch file converted into raster file by conversion tool. Raster file used as input in solar analyst tool for the solar radiation process. The main input for the tool is a raster file of 3D model to determine a number of conditions for the remaining tool parameters the input parameters were selected to create the solar radiation surface for this study. The sky size sets the resolution of the viewshed, sky map and sun map; which determines the number of calculations that take place to estimate the direct radiation reaching each cell in the surface grid. The default is 200 x 200 cells but increasing skysize increases accuracy. Multiple trials were run to balance calculation time with desired accuracy of results. Unfortunately, processing time increased greatly with higher resolution values of 400 x 400 and above. Upon further research it was determined that, when testing their model performance Fu and Rich (1999) found highly similar results from both 200 x 200 and 400 x 400 viewshed resolutions, so the decision was made to utilize the default values for this input parameter. The calculation direction input sets how many directions are used when calculating the viewshed. Thirty-two (32) is the default and is considered sufficient for complex mountain topography (Fu and Rich 1999). The azimuth and zenith divisions relate to how many divisions are used to create the sky map. The default, 8 was selected for each. The time period for which the insolation is calculated can be set to within one day, multiple days, specific days or across the whole year (Esri 2013a) [12]. For this case, the maximum range of one year was chosen, the values of other parameters are chosen as of default. The total amount of radiation calculated for a particular location or area is given as global radiation. The calculation of direct, diffuse and global insolation is repeated for each feature location or every location on the topographic surface, producing insolation maps for an entire geographic area. Following equations are used for the calculations: a- Global Radiation CalculationGlobal radiation (Globaltot) is calculated as the sum of direct (Dirtot) and diffuse (Diftot) radiation of all sun map and sky map sectors, respectively.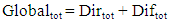 | (1) |
b- Direct Solar RadiationTotal direct insolation (Dirtot) for a given location is the sum of the direct insolation (Dirθ,α) from all sun map sectors: | (2) |
The direct insolation from the sun map sector (Dirθ,α) with a centroid at zenith angle (θ) and azimuth angle (α) is calculated using the following equation: | (3) |
Where: • SConst — the solar flux outside the atmosphere at the mean earth-sun distance, known as solar constant. The solar constant used in the analysis is 1367 W/m2. This is consistent with the World Radiation Centre (WRC) solar constant. • β — The transmissivity of the atmosphere (averaged over all wavelengths) for the shortest path (in the direction of the zenith). • m(θ) — The relative optical path length, measured as a proportion relative to the zenith path length (see equation 3 below). • SunDurθ,α — The time duration represented by the sky sector. For most sectors, it is equal to the day interval (for example, a month) multiplied by the hour interval (for example, a half hour). For partial sectors (near the horizon), the duration is calculated using spherical geometry. • SunGapθ,α — The gap fraction for the sun map sector. • AngInθ,α — The angle of incidence between the centroid of the sky sector and the axis normal to the surface (see equation 4 below).Relative optical length, m(θ), is determined by the solar zenith angle and elevation above sea level. For zenith angles less than 80°, it can be calculated using the following equation: | (4) |
Where: • θ — The solar zenith angle. • Elev — The elevation above sea level in meters.The effect of surface orientation is taken into account by multiplying by the cosine of the angle of incidence. Angle of incidence (AngInSkyθ,α) between the intercepting surface and a given sky sector with a centroid at zenith angle and azimuth angle is calculated using the following equation: | (5) |
Where: • Gz — the surface zenith angle. Note that for zenith angles greater than 80°, refraction is important.• Ga — the surface azimuth angle.c- Diffuse Radiation CalculationFor each sky sector, the diffuse radiation at its centroid (Dif) is calculated, integrated over the time interval, and corrected by the gap fraction and angle of incidence using the following equation: | (6) |
Where: • Rglb — the global normal radiation (see equation 6 below). • Pdif — the proportion of global normal radiation flux that is diffused. Typically it is approximately 0.2 for very clear sky conditions and 0.7 for very cloudy sky conditions. • Dur — the time interval for analysis. • SkyGapθ,α — The gap fraction (proportion of visible sky) for the sky sector. • Weightθ,α — The proportion of diffuse radiation originating in a given sky sector relative to all sectors (see equations 7 and 8 below). • AngInθ,α — The angle of incidence between the centroid of the sky sector and the intercepting surface.The global normal radiation (Rglb) can be calculated by summing the direct radiation from every sector (including obstructed sectors) without correction for angle of incidence, then correcting for proportion of direct radiation, which equals 1-Pdif: | (7) |
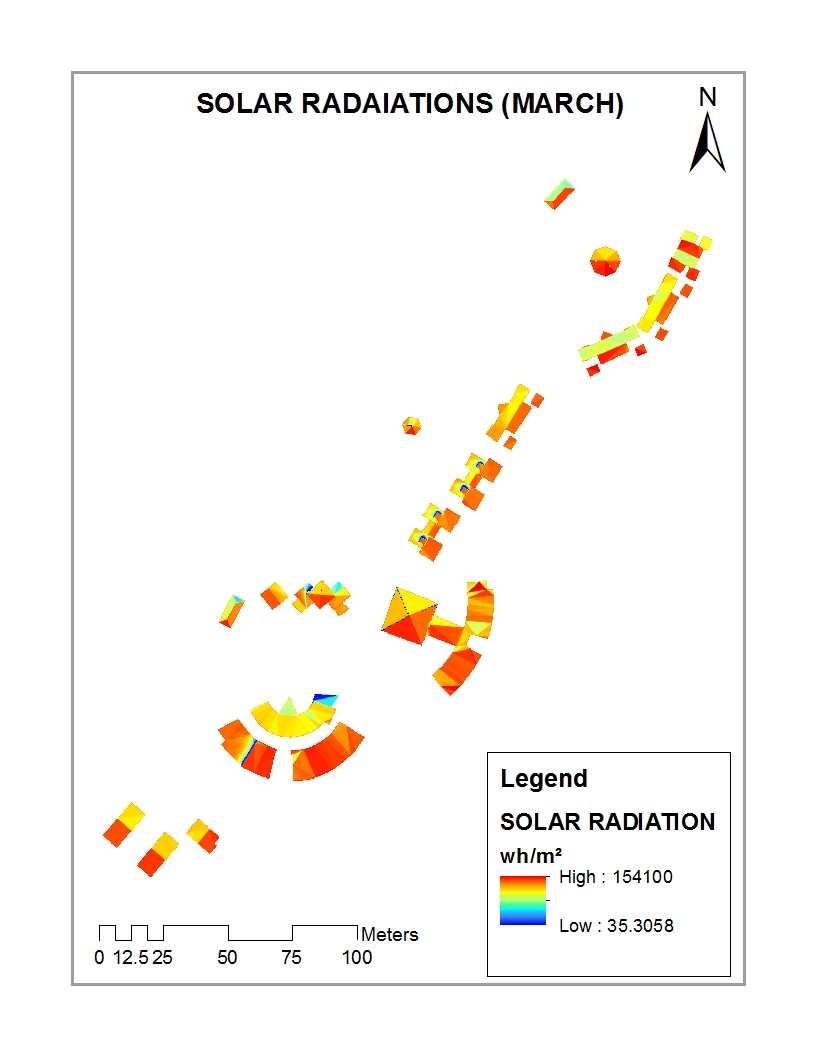 | Figure 4. Solar Radiation for March, 2018 |
For the uniform sky diffuse model, Weightθ,α is calculated as follows: | (8) |
Where: § θ1 and θ2 — The bounding zenith angles of the sky sector. § Divazi — The number of azimuthal divisions in the sky map.For the standard overcast sky model, Weightθ,α is calculated as follows: | (9) |
Total diffuse solar radiation for the location (Diftot) is calculated as the sum of the diffuse solar radiation (Dif) from all the sky map sectors: | (10) |
4.7. Validation
After finding out the potential rooftops for solar radiation by solar analyst tool, each building has different solar radiation value. Correlation of the solar radiation on rooftops to the solar radiation on LST of study area has been done. LST has calculated for all 12 months and then solar analysis is done on them.LST ∞ Solar Energy Absorption ∞ Solar RadiationThe Land Surface Temperature (LST) is the radiative skin temperature of the land surface, as measured in the direction of the remote sensor. It is estimated Top-of-Atmosphere brightness temperatures from the infrared spectral channels of a constellation of geostationary satellites. Its estimation further depends on the albedo, the vegetation cover and the soil moisture. LST is a mixture of vegetation and bare soil temperatures. Because both respond rapidly to changes in incoming solar radiation due to cloud cover and aerosol load modifications and diurnal variation of illumination, the LST displays quick variations too. In turn, the LST influences the partition of energy between ground and the vegetation, and determines the surface air temperature [13].a- Formula Used to Calculate LSTStep 1: Calculate Temperature-of-Atmosphere | (11) |
Where:ML = RADIANCE_MULT_BAND_10 = 3.3420E-04 RADIANCE_MULT_BAND_11 = 3.3420E-04DN = Digital NumberAL = RADIANCE_ADD_BAND_10 = 0.10000 RADIANCE_ADD_BAND_11 = 0.10000Step 2: Calculate Brightness Temperature | (12) |
Where:K1_CONSTANT_BAND_10 = 774.8853 K2_CONSTANT_BAND_10 = 1321.0789K1_CONSTANT_BAND_11 = 480.8883K2_CONSTANT_BAND_11 = 1201.1442TOA = Temperature-of-AtmosphereTo convert the temperature from K to °C subtracts 273.15 from BT.Step 3: Calculate Proportion of Vegetation | (13) |
 | (14) |
Where:In LANDSAT 8NIR BAND = BAND 5RED BAND = BAND 4Step 4: Calculate Emissivity | (15) |
Where:Pv = Portion of vegetationStep 5: Calculate Land Surface Temperature | (16) |
Where:BT = Brightness TemperatureW = Wavelength, B10 = 10.8 µmB11 = 12 µmP = h*(C/S) = 1.48388/10-²mk = 148388 µm kh = Plank’s constant = 6.626*10-34 JSS = Boltzmann Constant = 1.38*10-23 JKC = velocity of Light = 2.998*105 m/sAfter the LST has been calculated (Figure 5), then proceeds to solar radiation analysis on different months LST to correlate with the study area solar radiations. (Figure 6) shows solar radiation on Land Surface Temperature at study area from (124875 to 126513) wh/m².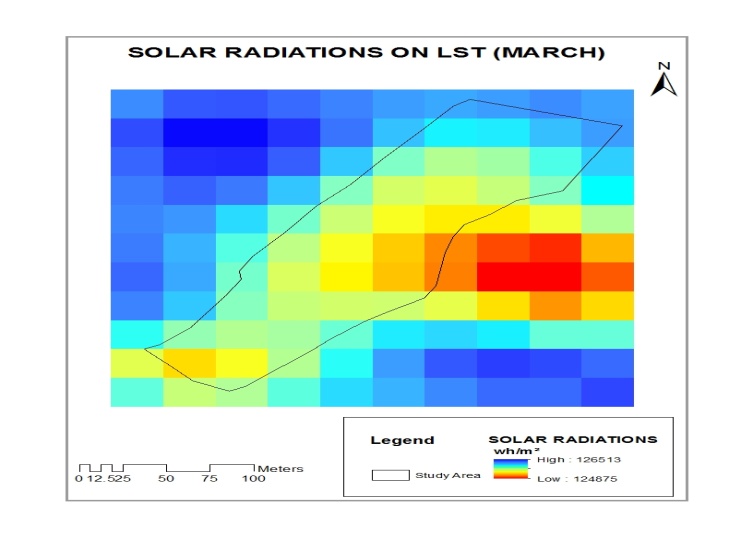 | Figure 5. Solar Radiation on LST, March 2018 |
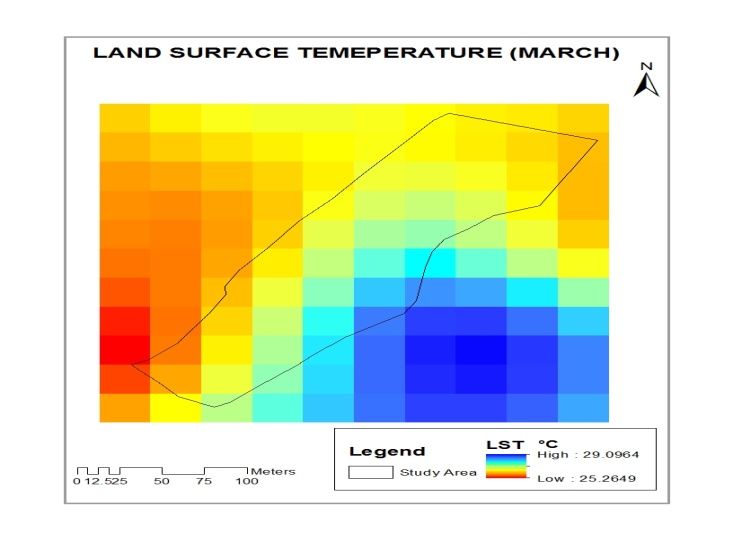 | Figure 6. Land Surface Temperature, March 2018 |
5. Results and Conclusions
Roofs facing towards the North East, South East direction having highly potential for solar radiations. July is the peak month for solar radiation and average temperature 24°C. From April to October months maximum solar radiations occur. Total calculated roof area is 3332m² out of which 40% roofs are potential for solar radiation i.e.; 1132m². Annually 1793.4617 kWh/m² solar energy strikes on the top of roofs. Average daily 4.985 kWh/m² solar energy strikes on the top of roofs. By using thE formula E = A * r * H * PR amount of energy generated can be calculated. Where:E = Energy (kWh) A = Total Solar Panel Area (m²) r = Solar Panel Yield (%) H = Annual Average Irradiation on Tilted Panels (shadings not included)* PR = Performance Ratio, Coefficient for losses (range between 0.9 and 0.5, default value = 0.75)E = 268518 kWh/annuallyE = 0.55 kWh/m²/dayAs per the Meghalaya electricity department, 2kWh energy required for a house. Total energy demand in Residential complex is approx. 60 kWh per day. Energy generated per day is 0.55 kWh/m². Potential roof area is used to install solar panel of size 1.68 m². 675 solar panels are used over the potential roofs to generate 16 kWh/day, which is fulfil the 26% energy demand of residential complex.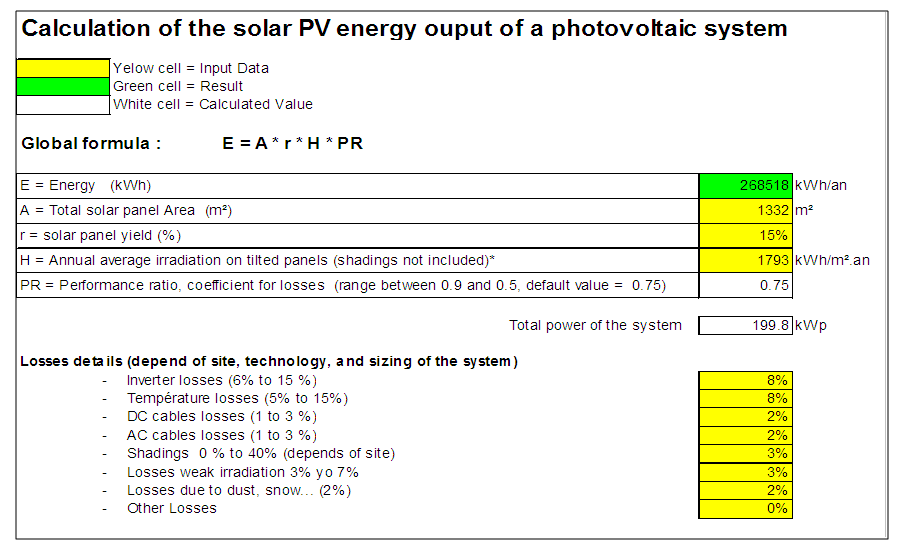 | Figure 7. Calculation of Solar SV Energy output |
This work provides a high level overview of energy generation from solar energy in the study area and proposes an Understanding towards the use of renewable energy. These include high-resolution incoming solar radiation data and total rooftop area. The work highlights the potential for future analysis using UAV data to automate rooftop inventories and describe solar radiation data on rooftops. Based on the total study area solar analyst findings Potential roofs. The estimated photovoltaic electric energy generation potential for rooftops is approximately 268518 kWh annually. This would be approximately 26% of the total electricity the utility provided to the entire Residential Complex NESAC. While it is not possible to calculate exact installed capacity for the proposed energy generation, an estimate based on calculated rooftop area for different months. Every month have varying solar energy due to the shine hours in days. As March to June are advent summer months have high solar radiation. July to September is the months consist of heavy rainfall in this period moderate solar radiation occurs. In this period some days have heavy rainfall and some have no rainfall. Days with heavy rainfall have low solar radiations and days with no rainfall have high solar radiations. October to Feb is cold months having low temperature of -2°C. In this period have very low solar radiation occurs. 5 months have very high & high solar radiation occurs, 3 months have moderate solar radiation occurs and remaining 4 months have very low solar radiation occurs. 3D model has been generated to find out the height of the roof for examine the shadow effect.Total calculated roof area is 3332m² out of which only 40% i.e., 1333m² is potential for solar radiation as per calculations. Energy generated from these roofs is approx. 268518 kWh annually. This amount of space could potentially hold up to 440 Solar World SW260 PV panels (each panel is 1.68 m²).
ACKNOWLEDGEMENTS
Authors are thankful to the director of NESAC, Meghalaya for providing the data and all the infrastructure required for the study. Authors also acknowledges Mr. Victor Saikhomand for his support. Special thanks to USGS for the satellite data.
References
| [1] | http://wiki.answers.com/Q/Do_nuclear_power_plants_cause_any_type_of_pollution |
| [2] | http://en.wikipedia.org/wiki/World_energy_resources_and_consumption |
| [3] | POLIS, “Identification and mobilization of solar potentials via local strategies Guideline based on the experiences of pilot actions.,” 2012. [Online]. Available: https://ec.europa.eu/energy/intelligent/projects/sites/iee-projects/files/projects/documents/. |
| [4] | Gutschner, M., Nowak, S., Ruoss, D., Toggweiler, P., Schoen, T., 2002. Potential for building integrated photovoltaics. Report No. IEA-PVPS T7-4. International Energy Agency. |
| [5] | MNRE, 2014. State wise Estimated Solar Power Potential in the Country. No. 22/02/2014-15/Solar-R&D (Misc.). Ministry of New & Renewable Energy (MNRE), Government of India, New Delhi from www.mnre.gov.in. |
| [6] | http://web2.etaflorence.it/cms/uploads/ETA/pubblicazioni/brochures_online/Solar_EC_Guide_01.pdf. [Accessed 26 02 2016]. |
| [7] | www.usgs/ earthexplore/landsat8 |
| [8] | Chen, Q. 2007. Airborne lidar data processing and information extraction. Photographic Engineering and Remote Sensing 73: 109-112. |
| [9] | User Manual Processing of UAS data, Version 6.3, RACURS. |
| [10] | Abdelkader El Garouania AbdallaAlobeidb SaidEl Garouanic, Digital surface model based on aerial image stereo pairs for 3D building, International Journal of Sustainable Built Environment, Volume 3, Issue 1, June 2014, Pages 119-126. |
| [11] | Willneff, J. and Poon, J. (2006) "Georeferencing from Orthorectified and Non-Orthorectified High-Resolution Satellite Imagery". The 13th Australasian Remote Sensing and Photogrammetry Conference, 20 – 24 November, National Convention Centre, Canberra, Australia. |
| [12] | http://proceedings.esri.com/library/userconf/proc99/proceed/papers/pap867/p867.htm (last accessed 22 December 2012). Esri. 2013a. ArcGIS Help 10.1. Area Solar Radiation (Spatial Analyst). http://resources.arcgis.com/en/help/main/10.1/index.html#//009z000000t5000000 (last accessed 31 October 2013). |
| [13] | https://land.copernicus.eu/global |

 Abstract
 Reference
 Full-Text PDF
 Full-text HTML