Ahuchaogu Emmanuel U.1, Ojinnaka O. C.2, A. C. Chukwuocha1, Baywood C. N.1, Njoku R. E.1
1Department of Surveying and Geo-Informatics Federal University of Technology, Owerri, Nigeria
2Department of Geo-informatics, and Surveying, University of Nigeria, Enugu Campus
Correspondence to: Ahuchaogu Emmanuel U., Department of Surveying and Geo-Informatics Federal University of Technology, Owerri, Nigeria.
| Email: |  |
Copyright © 2020 The Author(s). Published by Scientific & Academic Publishing.
This work is licensed under the Creative Commons Attribution International License (CC BY).
http://creativecommons.org/licenses/by/4.0/

Abstract
In Delta state, series of environmental hazards abound.. These include flood, erosion, sea level rise oil spillage etc and no attempt has been made to critically investigate the topographical settings which is the key tool for planning for mitigation. Mapping and visualization of topographic variable is the bedrock for protection, management and meaningful development of the physical environment. Based on this, sophisticated method that produces accurate result must be adopted to ensure that the right decision is made during planning. This study demonstrates how geospatial technique (Remote sensing and GIS) can be used for mapping and analysis of topographical settings of Delta State. Data used includes 3arc seconds (90m) resolution DEM created by SRTM, Landsat image with resolution 30m, 2012 flood remote sensing satellite imagery captured by moderate resolution imaging spectroradiometer (MODIS) and administrative map of the study area. These datasets of the study region were entered into various GIS software for manipulation and extraction of terrain features. Progressively, vital topographic features were digitally extracted and these were used to build a GIS-assisted topographical database consisting of such Physical features as the stream network, sub-catchment maps of the region, Contour, 3-D models, DTM, slope, profile line connecting different relief regions, land use/land cover map and Aspect of the study area. In addition, investigation of the relationship between the landscape and flooded areas was also made. These digital derivatives are essential for the understanding of the regions topography for further planning and decision making.
Keywords:
Topography, Geospatial Techniques, Mapping, DEM, GIS
Cite this paper: Ahuchaogu Emmanuel U., Ojinnaka O. C., A. C. Chukwuocha, Baywood C. N., Njoku R. E., GIS Based Assessment and Analysis of Land Scape and Terrain Variables in Delta State, American Journal of Geographic Information System, Vol. 9 No. 2, 2020, pp. 64-73. doi: 10.5923/j.ajgis.20200902.03.
1. Introduction
Technology involving the integration of geographical information system (GIS) and remote sensing technique is design in such a way that multi-dimensional data can be entered, manipulated, checked, analyzed and displayed as data referenced to the earth. Geospatial techniques have become an integrated, well developed and reliable approach in topographic analysis. Accurate topographical maps are the foundation for planning for any development, flood, erosion and other environmental hazard control. It is also, a reliable tool for management and control of resources of any country. It is needed to enable us familiarize ourselves with the terrain on which development takes place. The need for topographic maps, generally, cuts across all aspects of National affairs (Ufuah 2003). Based on this, sophisticated method that produces reliable result must be adopted for topographical modeling to ensure that the right decision is made during planning. Topographical analysis facilitates understanding of drainage pattern, river morphology, watershed pattern, surface roughness assessment, land use etc. The aim of topographic modeling and analysis is to provide detail or in-depth understanding of the arrangement of the earthly features and landscape patterns (Calogero Schillaci 2015). In the past environmental analyst relied heavily on analogue methods for modeling and analysis of topography and this approach can no longer satisfy the contemporary planning needs. In Nigeria, 1:50,000 scale map which has not been revised after its maiden edition in 1946 was adopted in 1962 as the official base map and launched in the first National Development Plan between 1962-1968 as the national topographical map (Okpala-Okaka, (1991). Therefore it is apparent that decisions taken with such information lack spatial fidelity. As technology advances, so does the ability to predict and model real world phenomenon. The GIS enables the pedologists geologists, geographers and landscape researchers to investigate the spatial pattern and determine the correlation between human activity and physical environment (Capizzi et al 2016). Spatial information pattern assessment is one of the fundamental characters of GIS for visualization (Mushonga et al 2017). GIS is the state of art technology beginning with automated modeling of landscape captured by cameras, digitizers, and scanners (Ajami et al 2016). The use of earth observation system (EOS) technology and GIS platform is currently gaining popularity over conventional ground techniques (Gallant, 2011). Digital Elevation Model (DEM) and satellite imageries are fundamental pieces of information needed to understand and manage the environment. Its manipulation in GIS environment enables qualitative and quantitative information’s that facilitates understanding of our environments to be derived. DEMs have become important sources of topographical data for many scientific and engineering applications such as hydrological and geological studies, infrastructure planning and environmental management (Yu and Ge, 2010). Where local topographical data is unavailable, incomplete or out-dated, DEMs from remotely sensed data can be the main source of information. Digital Elevation Models (DEMs) provide a convenient and representative interpretation of the Earth’s surface and are generally considered to be dataset for a variety of terrain and spatial analyses (Jonathan T. et al 2017). The Shuttle Radar Topography Mission (SRTM) used in this study is a digital topographic database on nearly global scale. It was co-sponsored by the National Aeronautics and Space Administration (NASA) and the National Geospatial-Intelligence Agency (NGA) (Dowding 2004). The need for global coverage with a medium scale DEM (1-3 arc second, or 30-100 m post spacing) led to the Shuttle Radar Topography Mission in the year 2000 and subsequently the release of ASTER GDEM in 2009. SRTM is limited to latitudes from N60° to S56° and was collected in two weeks. It can be considered as an instantaneous snapshot of earth's topography. The limitations are presence of offsets where canopy exists (Nwilo 2017). The original SRTM elevations were calculated relative to the WGS84 ellipsoid and then the EGM96 geoid separation values were added to convert to heights relative to the geoid for all the released products. The elevation models derived from the SRTM data are used in Geographic Information Systems. They can be downloaded freely over the Internet, and their file format is supported by several software developments. Remote sensing is the dynamic detection and recording of the earth’s surface using reflected or emitted electromagnetic energy. It provides an efficient approach to monitor and detect land cover changes. ‘Remote sensing data are primary sources extensively used for change detection in recent decades. This is due to its effective and timely manner of gathering data. The satellite data used in this research consist of MODIS imagery and Landsat TM. MODIS radiometer of the NASA’s terra satellite scans the earth with 36 spectral bands extending from the visible to the thermal infrared wave lengths (Running et al 1994). The first seven bands are designed basically for remote sensing to capture features on the earth surface at spatial resolutions of 250 meters for bands 1 and 2 and 500 meters for bands 3 to 7. The MODIS instrument is operating on both terra and aqua spacecraft. It views the entire earth surface every one to two days with a swath width of 2330 km Terra’s orbit around the earth is timed so that it passes from north to south across the equator in the morning, while aqua passes south to north over the equator in the after- noon. However, because of its numerous advantages, MODIS satellite image has become a reliable and popular data for disaster assessment and management. Landsat satellites use the Worldwide Reference System (WRS) of scenes divided up into paths and rows. The Worldwide Reference System (WRS) is a global notation system for Landsat data. It enables a user to inquire about satellite imagery over any portion of the world by specifying a nominal scene centre designated by PATH and ROW numbers. The WRS has proven valuable for the cataloguing, referencing, and day-to-day use of imagery transmitted from the Landsat sensors.
1.1. Aim and Objectives
The aim of this study is to demonstrate the potential of geospatial technique in the extraction and analysis of terrain features in delta state. The main objectives includes:i. To produce 2.5-D and 3-D topographical models of the study area.ii. To investigate the relationship between the landscape and river inundation.iii. To map the gradient of the topography.iv. To investigate the drainage network pattern in the study area.v. To understand the land use/land cover pattern of the study area.
1.2. Study Area
Delta state is one of the oil producing state in Nigeria located in the south-south geo-political zone in the region known as Niger Delta. It has a population of 4098391 comprising of 2074306 males and 2024085 females base on 20016 population census. The State presently cover a land mass of 17530km2 and is bounded in the North by Edo State, the east by Anambra state, south east by Bayelsa State. Geographically it is located beween latitude 5° 00’ and 6° 30’ and between longitude 5° 00’ and 7° 00’. Delta State is generally low lying area without remarkable hills and has a wide coastal belt interface with rivulets and streams which forms part of the Niger Delta.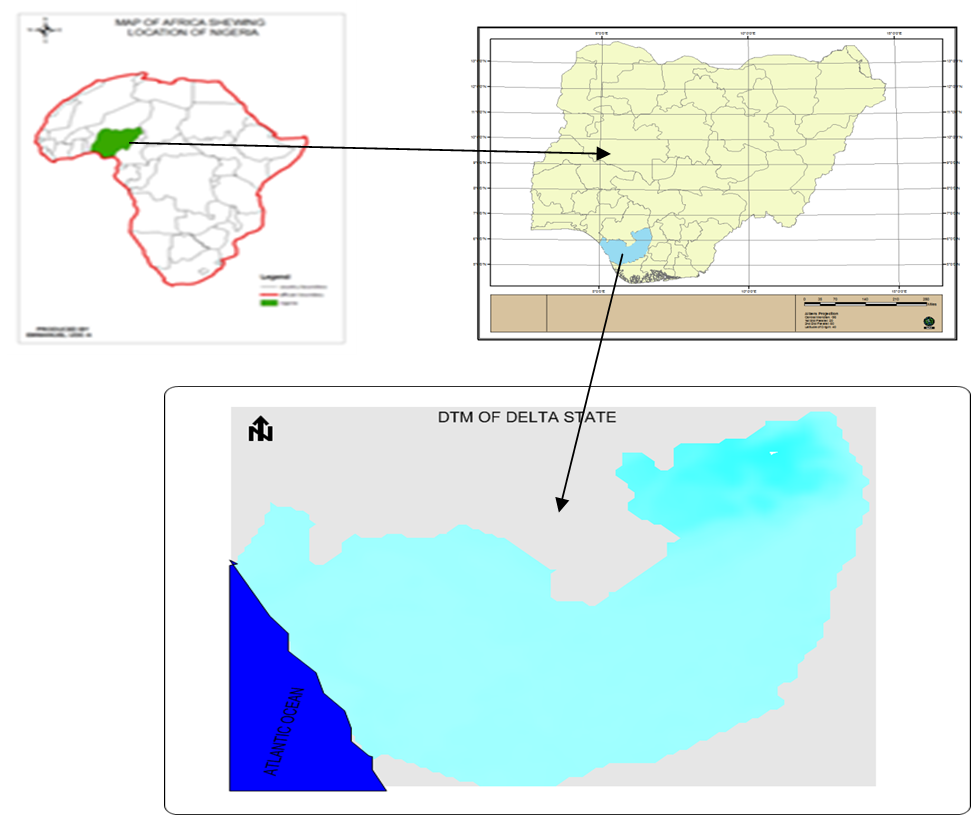 | Figure 1. Location Map of The Study Area |
2. Materials and Methods
In contemporary times the integration of remote sensing and GIS for spatial analysis has tremendously increase the reliability ascribed to cartographic output. For this reason, this paper utilized 3arc seconds (90m) resolution DEM created by SRTM. This was downloaded from USGS explorer. Other datasets includes Landsat image with resolution 30m, 2012 flood remote sensing satellite imageries captured by moderate resolution imaging spectroradiometer (MODIS) on NASAS terra satellite. These were downloaded from Global land cover facility, and USGS site respectively. Administrative map of the study area from which the administrative boundary was extracted was obtained from the federal ministry of land and surveys. Software used includes ArcGIS10.1, ERDAS Imagine, and Sufer11.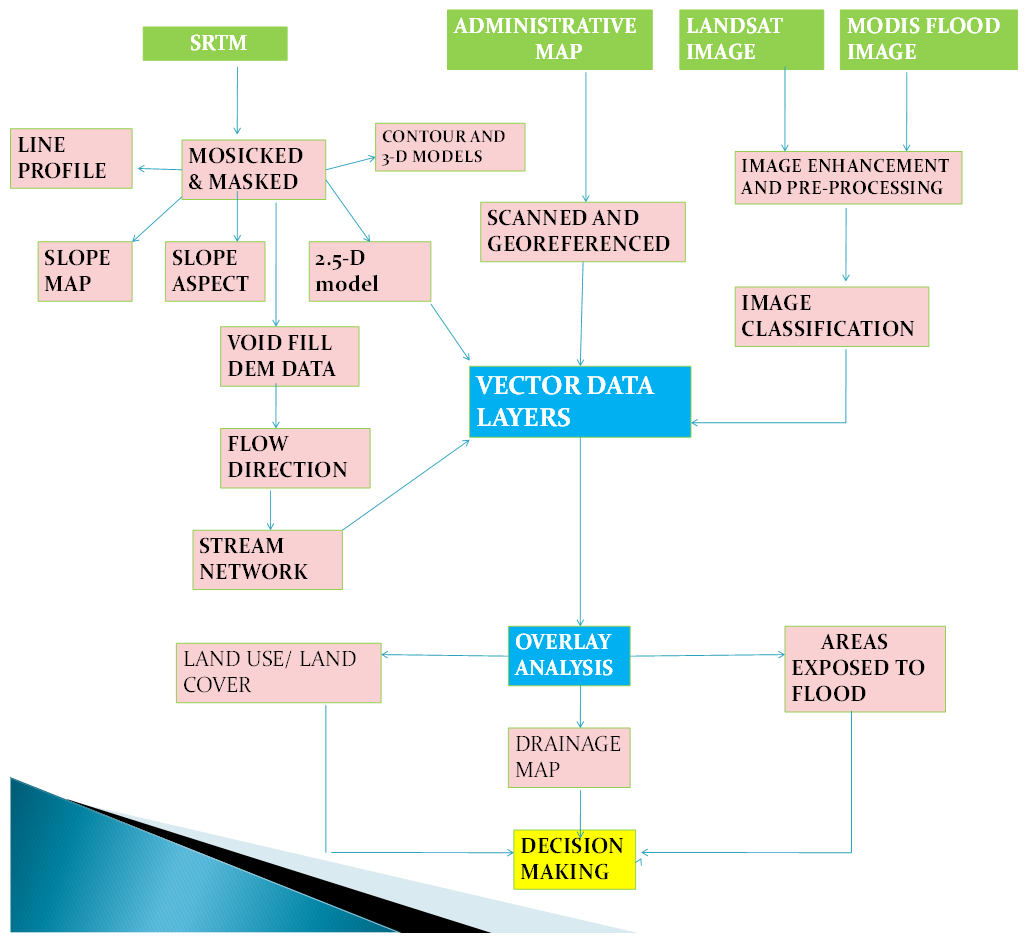 | Figure 2. Methodological flow chart of the study |
2.1. Terrain Analysis
Spatial information pattern assessment is one of the fundamental characters of GIS. Analysis using DEM requires the merging of SRTM tiles into a single raster entity (mosaicing). The SRTM tiles were added into the ArcGIS10.1 environment for processing. With the help of data management module within this environment, the DEM tiles were misaiced. The misaiced raster was subjected to void filling and subsequently, transformed from geographic coordinate system to projected coordinate system (i.e. from GCS-WGS1984 to WGS1984 World Mercator. Using the boundary shape file, the study area was clipped out to the actual boundary limit and shape. The clipped DEM was processed to contour map, Aspect map, slope map, and sub-catchment map. For the purpose of further investigation, the clipped raster was converted to XYZ point data and exported to surfer10 worksheet where a .dat file was created. The output (.dat file) was blanked and further processed to Wireframe (fig 3b), digital elevation model (fig 4) and 3-D model (fig 6) of the study area. Flood layer was extracted from MODIS image and overlaid on the elevation model. In addition elevation profile lines drawn along distinct relief areas were also produced (fig 8). The multiple terrain analysis was made for better understanding of the terrain.
2.2. Drainage Network Extraction
The elevation raster was used to delineate the drainage network of the study area while the largest river (River Niger ) was mapped from the Landsat imagery. The drainage map is the flow accumulation processed from void filled DEM (SRTM). A void is a cell that does not have associated drainage value. The fill sink extension of hydrological module in ArcGIS 10.1 was used to fill the void areas of the elevation raster (SRTM). Progressively, a Flow Direction Grid was created from the void filled DEM. The Flow Direction function takes a DEM grid and computes the corresponding flow direction grid. This grid holds values in its cells that indicate the direction of the steepest descent from that cell and it is created using flow direction tool. Progressively, the flow direction grid was further processed to flow accumulation grid using the flow accumulation extension. The flow accumulation tool calculates flows into each cell by identifying upstream cells that flow into each down slope cell. In other wards each flow accumulation cell’s value is determined by the number of upstreams cells flowing into it based on the landscape topography. The Flow Accumulation Grid was processed to create the drainage definition Grid. A threshold value that defines streams in the project area was set. This means that the grid cells that accumulate runoff from a set minimum number of cells are considered to be stream cells. The drainage network generated was digitized and overlaid with river Niger layer which was extracted from the landsat imagery (fig 11).
2.3. Land Use/Land Cover (LULC) Analysis
Remote sensing is the dynamic detection and recording of the earth’s surface using reflected or emitted electromagnetic energy. Landsat satellites use the Worldwide Reference System (WRS) of scenes divided up into paths and rows. According to NASA (2004), The Worldwide Reference System (WRS) is a global notation system for Landsat data. It enables a user to inquire about satellite imagery over any portion of the earth by specifying the PATH and ROW numbers. The WRS has proven valuable for the cataloguing, referencing, and day-to-day use of imagery transmitted from the Landsat sensors. The image tiles covering the study area were added to ERDAS Imagine window and mosaiced using the Mosaic Tool. The merged data was pre-processed and later classified using un-supervise classification algorithm. Ground truthing was embarked on in other to assign the proper LULC categories to the various classes. The classified image was exported to ArcGIS10.1 environment for vectorisation.
3. Results and Discussions
3.1. Results
Figure 3a is the contour map of the study area. Fig 3b is the wire frame of the study area. Fig 4 is the DEM of the study area. Fig 5 overlay analysis of flood layer, river layer on 2.5-D Model of the study area Fig 6 is 3-D Model of the study area. Fig 7 is the overlay analysis of flood layer (red) and 3-D model of the study area. Fig 8 is three elevation profile lines drawn along distinct relief areas. Fig 9 is Aspect map of the study area. Fig 10 is Slope map of the study area. Fig 11 is drainage map of the study area. Fig 12 is sub-catchment map of the study area. Fig 13 is Land use/land cover map of the study area. Fig 14 is chart revealing area of land occupied by land use/land cover categories in the study area.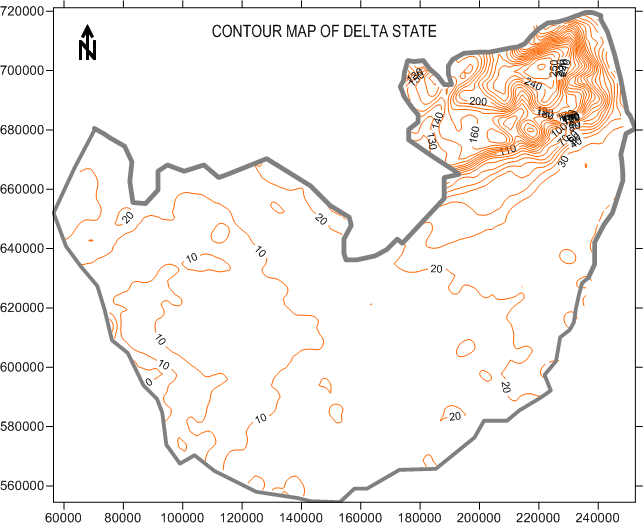 | Figure 3a. Contour map of the study area |
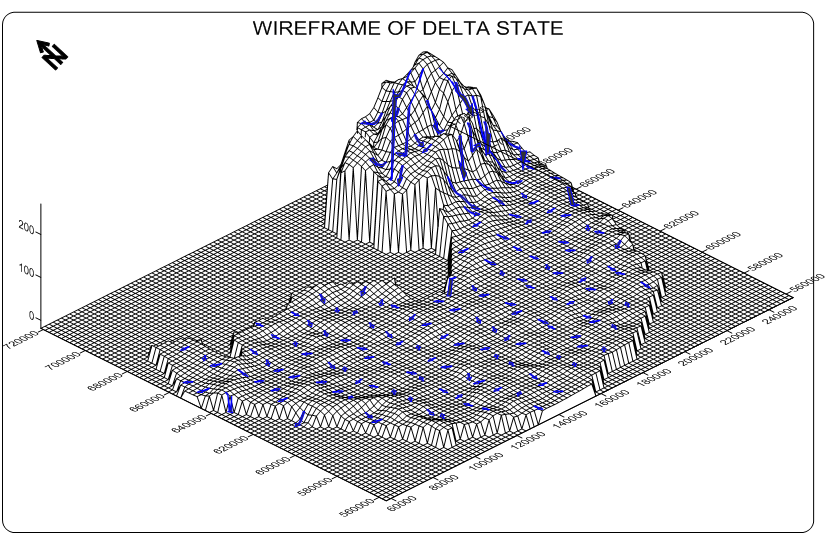 | Figure 3b. Over lay analysis of flow vectors and wire frame of the study area |
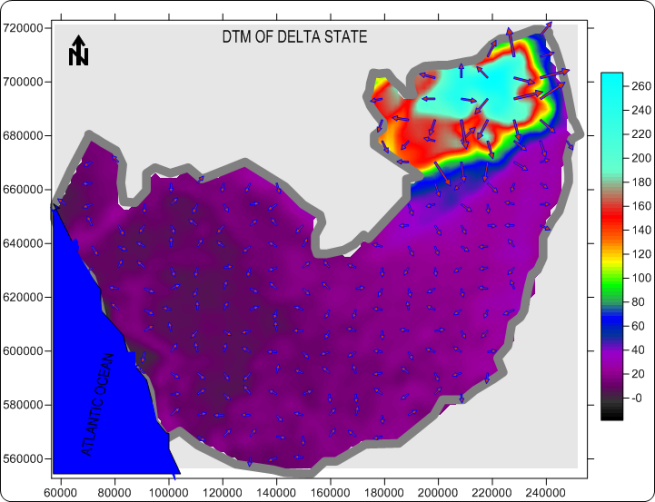 | Figure 4. DEM of the study area |
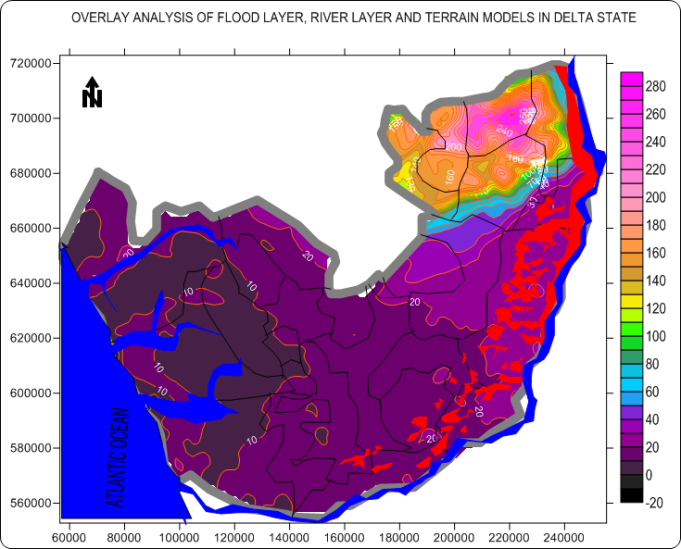 | Figure 5. Overlay analysis of flood layer, river layer on 2.5-D Model of the study area |
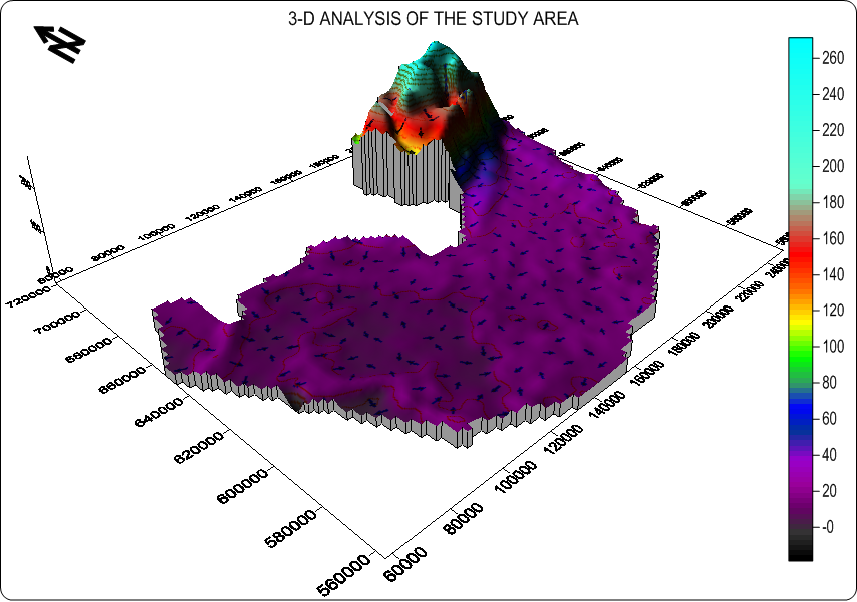 | Figure 6. 3-D Model of the study area |
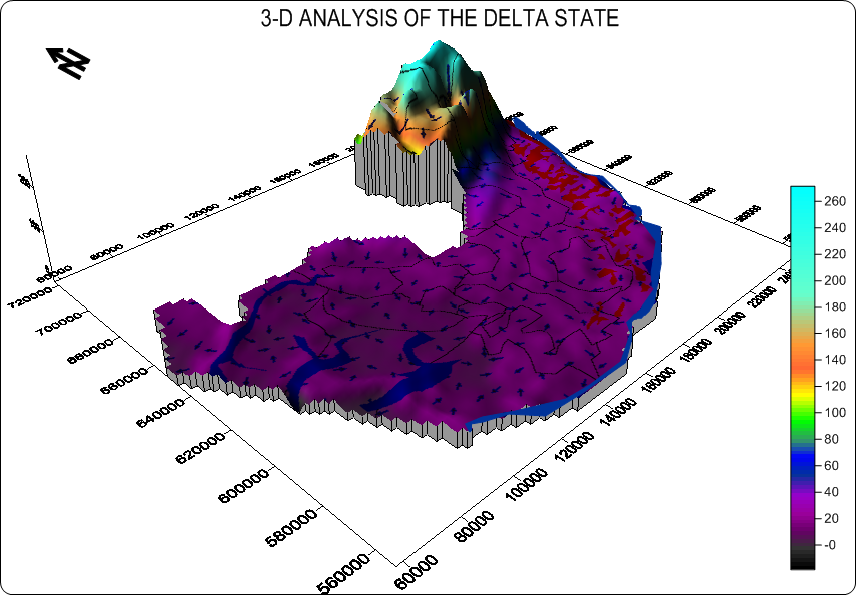 | Figure 7. Overlay analysis of flood layer, river layer on 3-D Model of the study area |
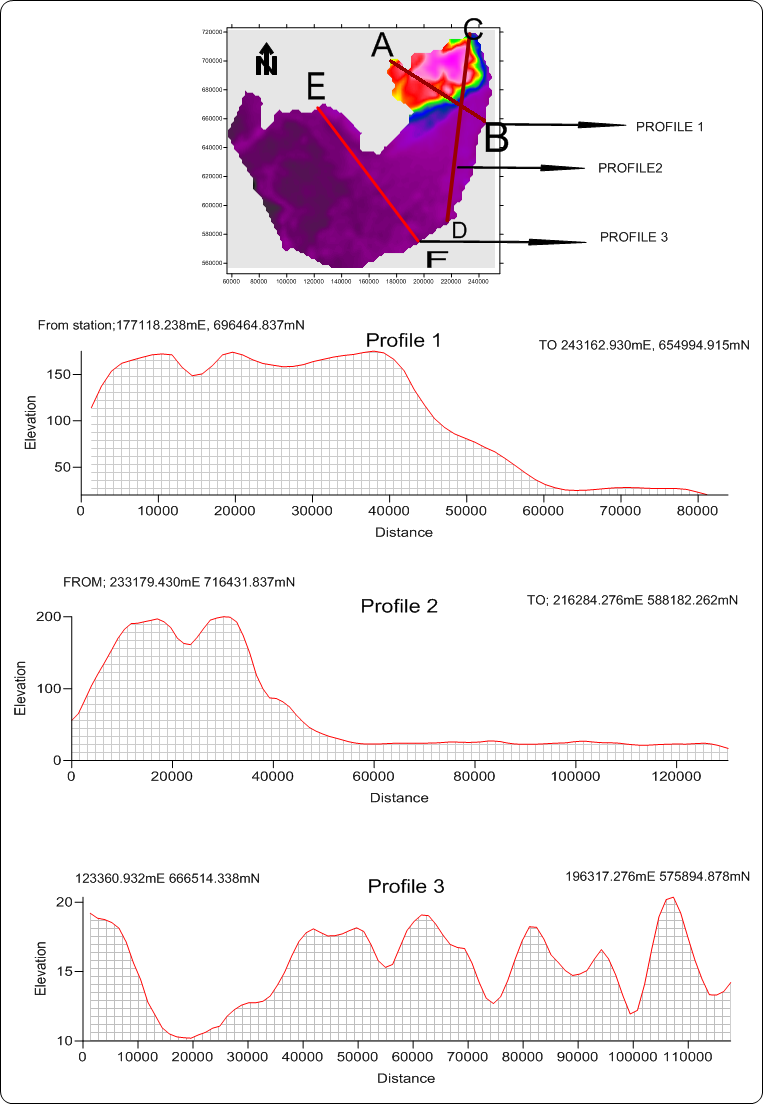 | Figure 8. Three elevation profile lines drawn along distinct relief areas. At top is the DEM of the study area showing path profile lines on the surface (A--B, C-D, and E-F) |
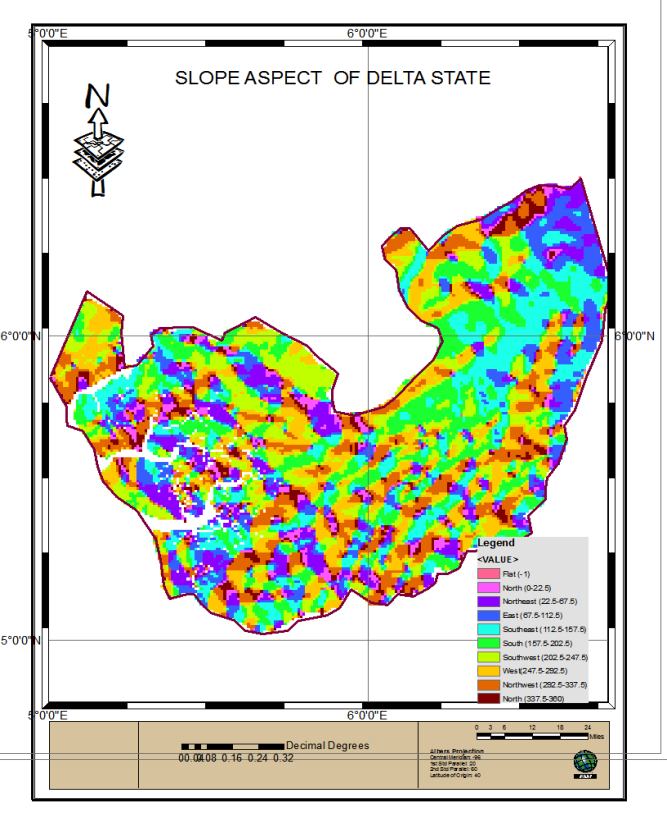 | Figure 9. Aspect map of the study area |
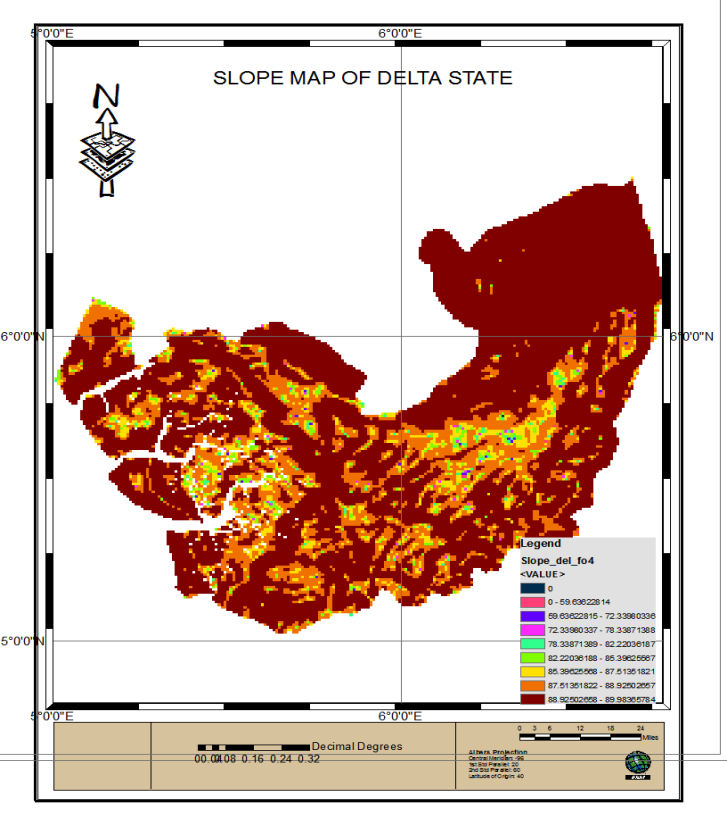 | Figure 10. Slope map of the study area |
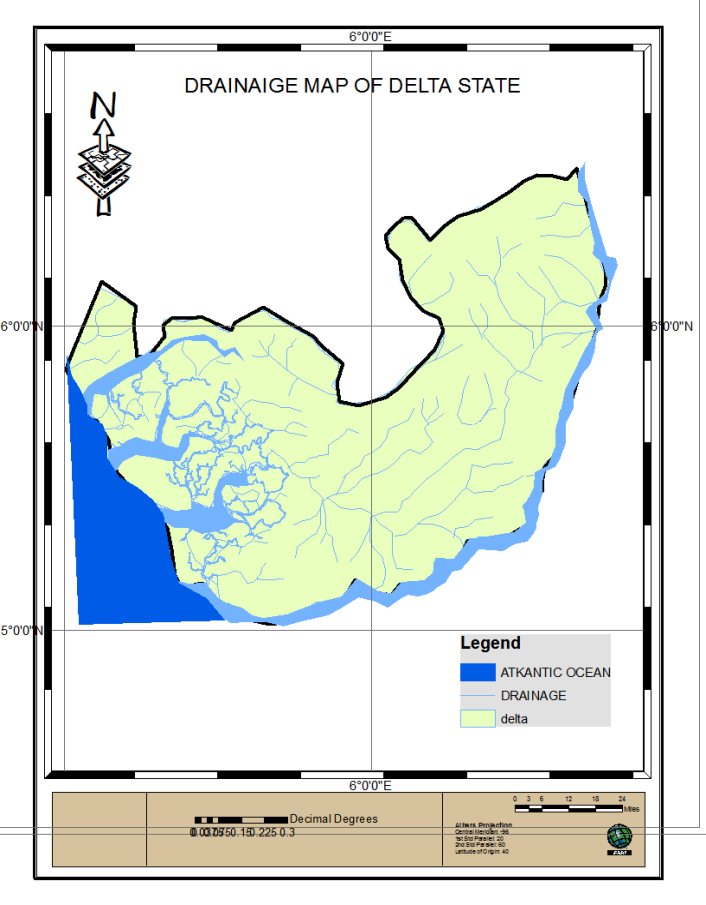 | Figure 11. Drainage map of the study area |
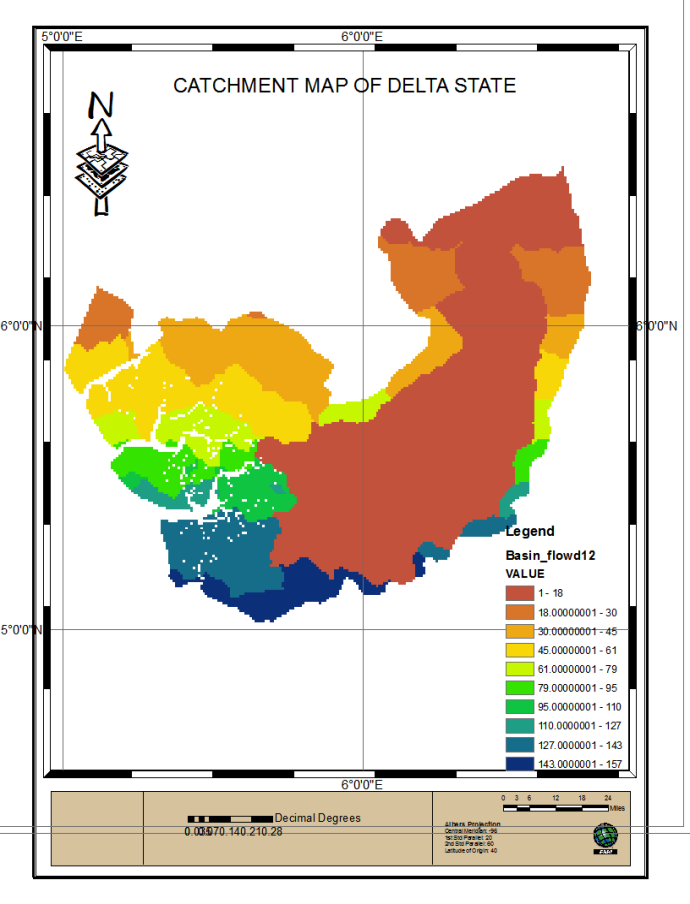 | Figure 12. Catchment map of the study area |
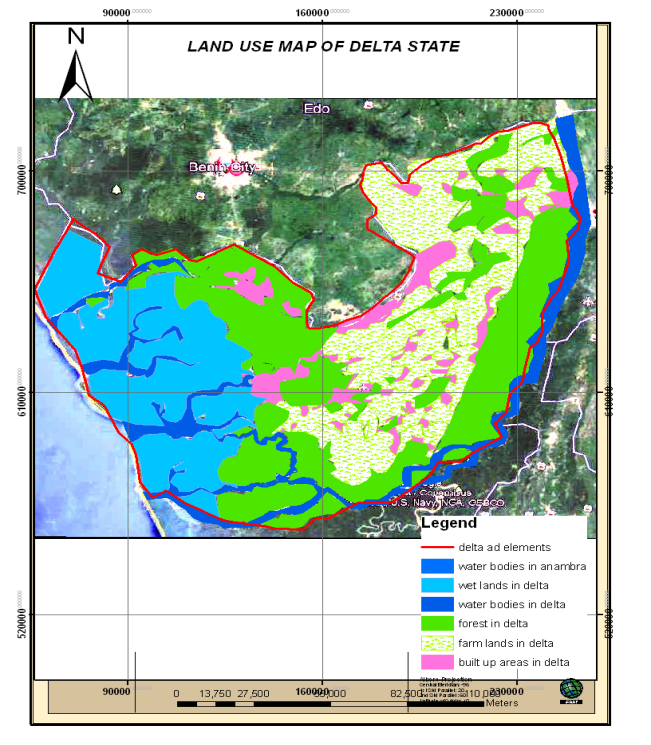 | Figure 13. LA/LU map of the study aeea |
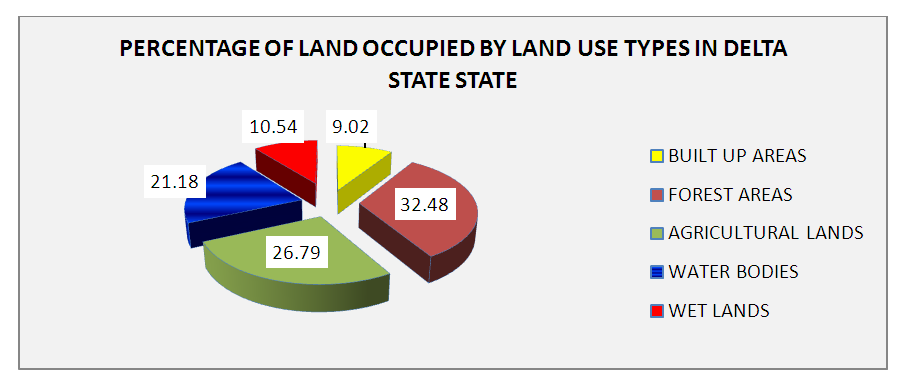 | Figure 14. Portions of the land mass occupied by LU/LC Categories in the study area |
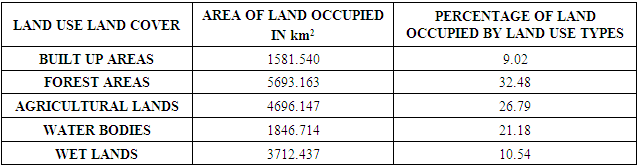
Table 1. Use Land Cover Analysis In Delta State
 |
| |
|
4. Discussion of Results
The density of contour lines (fig 3a) in the north eastern part indicates the ruggedness of the landscape while the density in other parts revealed flatness of the terrain. The DEM or surface analysis of the study area reveals that the relief falls within the range of 20 to 290m above mean sea level. The lowest elevation is found around the Atlantic ocean. The elevation of the state increases gradually up towards the Northern eastern part of the state with the highest elevation at 290m above sea level. Out of 25 local government areas within the state, only 5 local governments namely Oshimili north, Aniocha north, Aniocha south, Ika North East and Ika south are located in upland areas. Other local government including warri which is the economic nerve of the state is located in low lying areas. Figure3b is the wire frame showing the direction of flow i.e. from upland to low lying areas. Overlay analysis of 2012 flood layer with DEM of the study area (fig 5) revealed that affected areas are places within the elevation range of 20m to 60m lying close to river Niger. Profile drawing for visualizing topographic shape and structure is a prominent method often employ by Geomorphologists, Geologists and Engineers. This method is particularly helpful when the desired result is to visualize the pattern of mountain ranges, comparing the depth of two or more valleys and showing landscape variation in terms of ruggedness, height, steepness plane and when chosen the most economic areas for route construction. Figure 8 reveals profiles drawn along distinct landforms. Profiles were drawn along (A-B), (C-D), and (E-F). These graphical models revealed high level of undulations between the locations. Slope Aspect detects the down slope or downhill direction of the maximum rate of change in value from each cell to its neighbors. The slope direction grid can be used effectively for advance topographical modeling such as identifying and characterizing areas of high water runoff and landslide, estimating the portion of land that will receive high and low solar illumination for agricultural research purposes. The aspect of a terrain is measured clockwise (in degrees) from 0 to 360 having north and south as the reference directions. Fig 10 is the slopes map which indicates slope magnitude at various locations within the study area. Slope magnitude and slope direction are indispensable in erosion and flood modeling also in drainage design.
4.1. Drainage Network Analysis
The overall stream network (fig 11) revealed a hierarchy of 1st, 2nd, 3rd order streams with Benin river, Escavos river, River Forcados, which originate from the Atlantic ocean and river Niger positioned as 4th order streams in the hierarchy. Drainage density is the total length of all the streams and rivers in a drainage basin divided by the total area of the drainage basin. Abiodun (2018) reported that Soil permeability and underlying rock type affect the run off in water shed. Impermeable ground or exposed bedrock will lead to an increase in surface water runoff and therefore to more frequent stream. Drainage density is a measure of how well or poorly water shed is drained by stream channels. Area of high drainage density represents places of high rainfall. This study reveals a total number of 114 streams draining an area of 17530square kilometers of land. The total sum of the lengths of the rivers measured 2907.33kilometers giving rises to a drainage density of 0.1659km-1. Fig 12 is the sub catchment map of the study area. It can be used for agricultural planning, and also for investigation of the source of stream pollution. A total of 157 basins were identified. The largest and smallest basin measures approximately 1 and 7997 square kimometers respectively.
4.2. Land Use/Land Cover Analysis
Fig (13) shows five land use/ land cover types within the study area. Quantitatively, the analysis revealed that 1581.540 square kilometers (9.02%), 5693.163 square kilometers (32.48%), 4696.147 square kilometers (26.79%), 1846.714 square kilometers (21.18%) and 3712.437square kilometers (10.54%) are covered by built up areas, forest, farm lands, water bodies and wet lands respectively.
5. Conclusions
Mapping and visualization of topographic variable is the bedrock for protection, management and meaningful development of the physical environment. Based on this, sophisticated method that produces accurate result must be adopted to ensure that the right decision is made during planning. In this study, we were able to investigate the landscape pattern and show the direction of surface flow which is among other things invaluable for flood control. Aspect map and slope map which is indispensable for agricultural planning, drainage design, erosion modeling and control were also produced. Other products of this study are the drainage network, sub-catchment map and land use map of the study area. The numerous maps generated in this study constitute a comprehensive GIS database for advanced environmental modeling and assessment.These digital derivatives are inestimable in understanding, management of the environment and for informed decision making. This paper has demonstrated the potential of GIS in mapping and analysis of topographical setting. It is evident from this study that the use of space technology to gather spatial data and computer software to manipulate, model and visualize such data is far more reliable, less time and cost consuming compared to the traditional or conventional survey and mapping methods. It is therefore recommend that researchers should adopt this approach for environmental modeling and analysis.
References
| [1] | Ajami H, Khan U, Tuteja NK, Sharma A. (2016). Developmen of a computationally efficient semi-distributed hydrologic modeling application for soil moisture, lateral flow and runoff simulation. Environ Modell. Softw. 2016; 85: 319-331. |
| [2] | Abiodun Olufemi Adebola, Aliyu Hassan Ibrahim Williams Hamagamdo Wigeti, Nura Alhaji Yaro (2018). ‘‘Drainage Basin Morphology and Terrain Analysis of the Lower Benue River Basin, Nigeria’’ Science World Journal Vol 13 (1) pp 18 – 22. |
| [3] | Capizzi G, Grazia Lo Sciuto, Wozniak M, Robertas Damasevicius (2016). A Clustering Based System for Automated Oil Spill Detection by Satellite Remote Sensing. ICAISC. 2016; 2:613-623. |
| [4] | Gallant, J.C. (2011). The Ground beneath your Feet: Digital Elevation Data for today and tomorrow. 19th International Congress on Modelling and Simulation, Perth, Australia, 12–16 December 2011. |
| [5] | Jonathan T. Atkinson, Andrei B. Rozanov, Willem P and De Clercq (2017) Evaluating the effects of generalisation approaches and dem resolution on the extraction of terrain indices in kwazulu natal, south Africa. South African Journal of Geomatics, Vol. 6. No2. |
| [6] | Mushonga HT, Banda F, Mulolwa A (2017). Development of a web based GIS for health facilities mapping, monitoring and reporting: A case study of the Zambian Ministry of health. South. African. J. Geomat. 6:321-332. |
| [7] | Okpala-Okaka, C. (1991) “Revision of Nigerian maps: Map Makers and Their Inputs”. in R.N. Asoegwu (ed) Professional Papers on Surveying Practice in Nigeria (AS Applicable to Anambra State) vol. II Nigerian Institution of Surveyors (NIS) Anambra State pp. 95-101. |
| [8] | Peter Nwilo, (2017) Determination of the Impacts of Landscape Offsets on the 30-metre SRTM DEM through a comparative analysis with Bare-Earth Elevations. FIG Working Week 2017, Finland, May 29–June 2, 2017. |
| [9] | S. W. Running, C. O. Justice, V. V. Salomonson, D. Hall, J. Barker, Y. J. Kaufman, A. H. Strahler, A. R. Huete, J. P. Muller, V. & Vanderbilt, Z. M. (1994). “Terrestrial Remote Sensing Science and Algo- rithms Planned for EOS/MODIS,” International Journal of Remote Sensing, 15. (17): pp. 3587-3620. |
| [10] | Ufuah (2003). Non-revision of 1:50,000 topographic maps and its Implications for sustainable development in Nigeria, Proceedings of the 21st International Cartographic Conference (ICC) Cartographic Renaissance Durban, South Africa, 10 -16 August 2003. |
| [11] | Yu, J.H., and Ge, L. (2010). Digital Elevation Model generation using ascending and Descending multi-baseline ALOS/PALSAR radar images. FIG Congress 2010 Facing the Challenges – Building the Capacity Sydney, Australia, 11-16 April 2010. 15pp. |

 Abstract
 Reference
 Full-Text PDF
 Full-text HTML