-
Paper Information
- Paper Submission
-
Journal Information
- About This Journal
- Editorial Board
- Current Issue
- Archive
- Author Guidelines
- Contact Us
American Journal of Geographic Information System
p-ISSN: 2163-1131 e-ISSN: 2163-114X
2020; 9(2): 47-54
doi:10.5923/j.ajgis.20200902.01

Spatial Patterns of African Indigenous Vegetables Value Chain Actors: The Case of Narok and Kajiado County, Kenya
 Abstract
 Reference
 Full-Text PDF
 Full-text HTML
Juma R. Magogo1, David E. Lawver2, Mathew T. Baker3, Boren-Alpizar Amy2, Cynthia McKenney4, Agnes O. Nkurumwa5
1Kenya Agricultural and Livestock Research Organization, Matuga, Kenya
2Department of Agricultural Education and Communication, Texas Tech University, Lubbock, USA
3Department of Agricultural Leadership, Education, and Communications, Texas A&M University, Texas, USA
4Department of Plant and Soil Science, Texas Tech University, Lubbock, USA
5Department of Agricultural Education and Extension, Egerton University, Njoro, Kenya
Correspondence to: Juma R. Magogo, Kenya Agricultural and Livestock Research Organization, Matuga, Kenya.
| Email: |  |
Copyright © 2020 The Author(s). Published by Scientific & Academic Publishing.
This work is licensed under the Creative Commons Attribution International License (CC BY).
http://creativecommons.org/licenses/by/4.0/

The ever-increasing demand of vegetables has emphasized the importance of vegetable commodities in the horticulture industry. Vegetables grown and consumed in Kenya are categorized as either exotic or indigenous. Indigenous vegetables have comparative advantages over exotic vegetables such as high resilience to harsh climates. These vegetables among other crops have in the past significantly contributed to the nutritional and economic wellbeing of agricultural communities. Thus, this study of African indigenous vegetable (AIVs) value chain actors was conducted for the purpose of analyzing spatial patterns of AIVs value chain actors in Narok and Kajiado County to encourage more farmers, particularly women and youth consider AIVs production and marketing as an occupation. The study locations were selected through a systematic sampling technique and households were selected through a simple random sampling technique. Data were collected from 217 (n = 217) respondents and analysis was conducted using nearest neighbor ratio (NNR). The study found clustering of value chain actors and concluded that value chain actors were clustering based on proximity and commodity. The findings imply that value chain actors can form clusters to achieve higher volumes and clusters can be used by Extension service providers as reference points in disseminating agricultural information. Further research is recommended into cluster farming on its suitability as a tool for Extension and organization of farmers’ associations for improving livelihoods. Lastly, information generated by this study would positively contribute towards the development of AIVs value chain strategies in Kenya.
Keywords: Spatial pattern, Clustering, Indigenous, Geographical information
Cite this paper: Juma R. Magogo, David E. Lawver, Mathew T. Baker, Boren-Alpizar Amy, Cynthia McKenney, Agnes O. Nkurumwa, Spatial Patterns of African Indigenous Vegetables Value Chain Actors: The Case of Narok and Kajiado County, Kenya, American Journal of Geographic Information System, Vol. 9 No. 2, 2020, pp. 47-54. doi: 10.5923/j.ajgis.20200902.01.
Article Outline
1. Introduction
- Spatial analysis and geographical information systems (GIS) are analysis tools that have not, to a large extent, been utilized in agricultural Extension and education research. As a result, they have been viewed as reserved for other disciplines despite its potential for wide application (Esri, 2009). These technological tools can be used for comprehending geography and making intelligent decisions (Gorr & Kurland, 2013). Processing and integrating; analyzing, visualizing agricultural environments and workflows from a variety of datasets has been reported to be beneficial in farming industry (Esri, 2009). Thus, GIS can help farmers increase production, reduce costs, and manage their farmland more efficiently (Pierce & Clay, 2007; Esri, 2009). However, there are challenges and advantages associated with technology such as GIS technology. Some of the challenges, advantages, and potentials of GIS technology are covered under literature review section which depicts the emergence and convergence of various technologies in the quest for transformation of agricultural sector into agribusiness. With this transformation, farmers have become more concerned on farm productivity and profitability. In this regard, geospatial analysis and predictive models have come handy in enhancing the ability of farmers to visualize their land, crops and management practices in unprecedented ways to precisely manage their farm business (Clark & Lee, 1998). For example, geospatial technologies help farmers make rational decisions on type and quantity of inputs; and location of application. This has proven to be both friendly to the environment and profitable for the farmer (Yousefi & Razdari, 2015). In agricultural Extension and education research, there are basic concepts of spatial analysis and GIS that can be incorporated and integrated. Such basic concepts include spatial dependency; autocorrelation; statistical inferences; stationarity; isotropy; and social network analyses, among others. This is in pursuit of aligning and re-aligning our research work with present technology, such as GIS (O’Sullivan & Unwin, 2010). Thus, the increasing role of GIS technology in agriculture production and productivity; as well as agriculture Extension and education research is imperative.
2. Purpose and Objectives
- The purpose of this study was to analyze the spatial patterns of the African indigenous vegetables (AIVs) value chain actors in Narok and Kajiado County to encourage more farmers, particularly women and youth consider AIVs production and marketing as an occupation. This is because AIVs cultivation and marketing continues to offer competitive advantages as a viable farming business for smallholder farmers. In addition, the finding lays the foundation for mapping value chain actors and formation of sustainable clusters for both production and marketing.
3. Delimitations, Limitations and Assumptions
- This study focused on randomly selected value chain actors such as producers, traders, and Extension service providers. The focus on selected value chain actors was based on the main actors of the vegetable value chain in the study areas. In addition, the population estimate of the value chain actors was based on unpublished reports from the Department of Agriculture in Narok and Kajiado counties. Similarly, precision of data collected was also affected by GIS projection errors. Time and high cost of conducting this research also posed as a limitation. This study assumed that AIVs plays a critical role in alleviating poverty and as a result the respondents were motivated to participate in the survey and provided honest responses. This was enhanced through assuring respondents that their anonymity and confidentiality were preserved and that they were able to withdraw at any time without ramification.
4. Significance of the Study
- There is a growing interest of incorporating and integrating present technology in agriculture Extension and education research (Yousefi & Razdar, 2015). Such technology includes the use of GIS technology in Extension and education research. It has been further argued that the future of agricultural Extension and education research may rest on big data and technological developments (Sykuta, 2016). In view of these considerations, it is imperative to share research data at local, regional, and global levels. Thus, GIS has the potential of bridging these gaps by providing geospatial information of local issues to global platforms, and vice versa. The significance of this study is also laid on the foundation that generated information will positively contribute towards the development of AIVs value chain strategies in Kenya.
5. Literature Review
- There is an emergence and convergence of various technologies such as Global Positioning System (GPS), geographic information system (GIS), in-field and remote sensing, mobile computing, advanced information processing, and telecommunications (Pierce & Nowak, 1999) that can transform the agricultural sector into agribusinesses. In addition, these technological advancements have enhanced the capability of the agricultural industry and research in processing and integrating spatial data (Yousefi & Razdari, 2015). However, the benefits of these technologies and innovations are yet unproven (Stafford, 2000) due to the challenges that comes with technology. GIS technology has been reported to be expensive and require computer platforms that are not possessed by a majority of actors (Yousefi & Razdari, 2015). There are also obstacles which are region and/or country specific. Some of these obstacles reported in the literature include infrastructure; institutional constraints; lack of technical expertise; knowledge and technical gaps; and data availability, quality and costs (Adenkule, 2013; Clark & Lee, 1998; Lowenberg-DeBoer, 1996).However, there are also benefits associated with GIS technology as it has the potential of transforming agriculture in the 21st century (Adenkule, 2013). GIS technology has been reported to improve the efficiency and effectiveness of agricultural research (Limpisathian, 2011). Specifically, GIS technology can be tailored to meet the needs of technology in agricultural Extension and education research. Some packages have been redesigned and customized to address the urgent need of technology in agricultural research. A good example is field-level GIS that contain analytical functions for analyzing agricultural spatial data (Runquist, Zhang & Taylor, 2001). The accessibility of spatial data has also been boosted by delivery of valuable information via websites hosted by agencies such as U.S. Department of Agriculture (USDA), and the European Union (EU) (Xie & Wang, 2007). The continued support by these agencies has explored more options for the application and usability of GIS (Qian & Zheng, 2006). Thus, importance of geospatial analysis is further strengthened by the transformation of agriculture from subsistence to commercial farming. With this transformation, various players in agriculture Extension and education research are becoming more concerned about efficiency and effectiveness of research. In this regard, spatial analysis is becoming useful in enhancing the ability of actors to visualize their operations and management practices in unprecedented ways (Clark & Lee, 1998). For example, geospatial tools, such as the spatial analysis, can be used to determine spatial patterns or distribution of waypoints, such as location of value chain actors.
6. Conceptual Framework
- This study has been conceptualized as shown in Figure 1. Geospatial data were screened, validated, transformed, analyzed and visualized. Analyzed and visualized data were transmitted through various communication channels in which social networks plays crucial role in diffusing information. Social networks were assumed to play a crucial role in providing reassurances of the workability of the information based on previous experience and exposure as embodied in the Bass Forecasting model (Rogers, 2003).
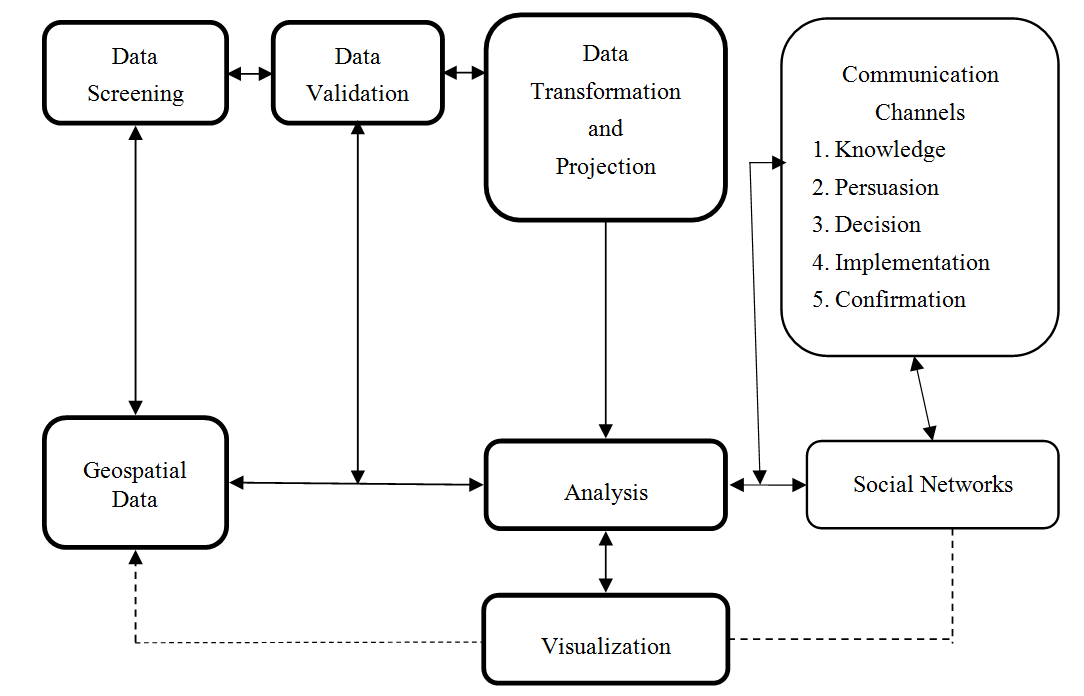 | Figure 1. Work flow for geospatial analysis and information diffusion (Source: Authors Conceptualization) |
7. Methodology
- This study was quantitative research as it employed statistical tests (Ary, Jacobs, & Sorensen, 2010) to analyze the spatial patterns. In addition, this study relied on measurement tools such as scales, observation checklists, and questionnaires. This approach was chosen to respond to research questions and hypothesis using numerical data (Williams, 2007). Due to independence of quantitative research, data is used to create meaning through objectivity uncovered in the collected data (Williams, 2007). Leedy and Ormrod (2001) also posits that quantitative research is intended to establish, confirm, or validate relationships and to develop generalizations that contribute to theory. The context of this study was AIVs value chain actors in Narok and Kajiado County. These study areas were chosen as a follow up of a previous study on analysis of marketing margins of AIVs which found variant and exorbitant margins through the commonly used marketing outlets and yet AIV producers were getting very low margins (AUTHORS, 2015). In addition, these areas were selected due to their productivity and potential for vegetable markets. AIVs marketing are prevalent in the study areas, and since there are different categories of actors in the value chain, efforts were made to include different categories such as male and female, younger and older participants, small and large-scale farmers. This ensured a more balanced representation of information from all categories. The selected households were evenly distributed in the two counties and in the various household categories. The locations for the study were selected through a systematic sampling technique and the households were selected through a simple random sampling technique. In this study, the sampling frame was obtained from Kenya’s Department of Agriculture. The desired sample size was determined using a sample size table developed by the Research Advisors (2007). According to Research Advisors (2007), given population of approximately 500 vegetable value chain actors in Narok and Kajiado; 95% confidence level; and a margin of error (degree of accuracy) of 5%, the recommended sample size was determined to be 217 respondents (n = 217). A face-to-face questionnaire was developed to conduct the study. The survey questionnaire captured the geospatial information and were administered to selected respondents (n = 217) by 14 trained enumerators. Enumerators were recruited from the study areas to bridge communication barriers, as well as to acquire research assistants who were well versed with the study areas. Recruitment of enumerators was conducted through interviews by the research team. After recruitment, the enumerators were trained for two days on how to administer the research instruments. The research instruments included questionnaires, GPS instrument, and camera. The main respondents were the household head. The household head provided most of the information but could consult others in the household when necessary. GPS coordinates were used to build the spatial patterns of AIVs value chain actors to aid targeting beneficiaries of Extension services and enhance understanding of suitable locations or sites for successful vegetable production and marketing.Research rigor in this study was mainly concerned with soundness and/or precision of the study in terms of planning; data collection; analysis; and reporting. Ary, Jacobs, and Sorensen (2010) discussed the importance of internal validity, objectivity, reliability, and external validity in addressing issues on accuracy, neutrality, consistency, and generalizability, respectively. Internal validity was concerned on the accuracy of data and findings and was addressed by research design that provided variable controls. The design of appropriate controls involved eliminating extraneous variables that could have led to alternative interpretations and hence lower internal validity. Random selection was used to select participants to ensure every member of the population had an equal chance of being selected for the study, thus eliminated selection bias. Random selection was also used as a strategy for increasing external validity. An inventory of 1,130 VCAs (Narok = 667, Kajiado = 463) was provided by the Department of Agriculture. The VCAs were classified as active (Narok = 323, Kajiado = 185) and non-active (Narok = 345, Kajiado = 277), respectively. The total active VCAs were 508 but 8 were excluded due to incomplete records. The 500 active VCAs were composed of male, female; young, and old; evenly distributed in the two counties and were assigned unique numbers (codes) from 001 to 500. The coded list was entered into SPSS and commanded to select 217 random cases from the coded list. Since the coded list was evenly distributed in terms of gender, age, and locality, the selected cases were representative and contained 111 producers; 53 extension service providers; 41 traders; and 12 consumers. Data were thoroughly screened to check on accuracy (improve validity), missing data, outliers, and the researcher assessed adequacy of fit between data and assumptions of specific procedures such as normality, linearity, and homogeneity of variance/homoscedasticity. Although there was no pattern of missing data, the enumerators were contacted to fill the gaps on missing data and outliers using their field notes, particularly the ones the researcher was not able to resolve. Some of the gaps that the researcher was able to resolve were on data entry, such as year of birth instead of age, and other conditional questions. Such conditional questions required respondents to provide response only if they meet a certain condition such as marketing AIVs, receiving extension services, sharing market information, and among others. The coordinate points were also subjected to Google Earth to ascertain they all fall within the study areas. In addition, ArcGIS was able to confirm that all spatial points were within the study areas. In terms of impartiality and objectivity, the research team remained objectively separated from the subject matter. Data were collected, screened, analyzed, interpreted, and reported objectively. The questionnaire was pretested by trained enumerators to determine feasibility; reliability, and validity of the instruments. It was established that the research instruments did not contain any confusing items and enumerators found it easy and quick to administer and complete. On average, one questionnaire was estimated to require about 35 minutes to one hour to complete, depending on the speed and understanding nature of both the respondents and the enumerator.External validity was ascertained to allow the findings to be generalizable. One key component was to ensure the sample was representative, which was attained through sample determination and selection, as earlier discussed. Generalizability is considered a major criterion for evaluating the quality of a study (Polit & Beck, 2008). However, Shadish, Cook, and Campbell (2002) noted the complexities and illusiveness of generalizability even in studies that are considered to yield high quality evidence. In response to these challenges, Firestone (1993) developed a typology depicting three models of generalizability that provides a useful framework for considering generalizations. The first model is extrapolating from sample to population (statistical generalization); second is analytical (researcher attempts to generalize from particulars to broader constructs or theory); and the third is case-to-case translation. In view of these models, the findings of this study can be best be generalized using the statistical and case-to-case translation models. Finally, this research was conducted in compliance with Texas Tech University's ethical requirements for all research conducted under its institutional auspices. An application for exemption was submitted to Institutional Research Board (IRB) of Texas Tech University. The application for exemption was based on one of the rationales stipulated by the IRB, that the research involved only the use of survey or interview procedures, and that the information from respondents was recorded in such a way that they cannot be identified directly or through identifiers linked to them. Respondents were assured of their confidentiality and were required to provide informed consent for participation and were free to withdraw at ant any time or level without ramification.
8. Analysis
- This study focused on the statistical inference for spatial data in which spatial data has been considered as one realization of stochastic process in the analysis of spatial patterns of AIVs value chain actors. Geospatial data were screened to ascertain there were no missing data or data entry errors. Since data were entered using SPSS (.sav), a .CSV file was converted from SPSS because it is the file format compatible with analysis using ArcGIS (Gorr & Kurland, 2013). Using ArcGIS, a file geodatabase (.gdb file Extension) was created because of its comparative advantages over personal geodatabase (.mdb file Extension) and enterprise geodatabase. The X and Y coordinates were then displayed with the X-coordinates representing longitude and Y-coordinates representing latitude. The displayed data were exported as shape files (.shp) to store the feature geometry and then projected using World Mercator. Data were projected to minimize distortion in one or more of the four map properties: shape, area, distance, and direction (Zeiler & Murphy, 2010). World Mercator projection was preferred because it is ideal for small areas (regions) and the map has less distortions when zoomed in (O’Sullivan & Unwin, 2010). The projected data were then used to conduct the spatial analysis and visualized using maps, graphs, and spatial statistics. Analysis was conducted using the average nearest neighbor ratio (ANNR) in ArcGIS. The ANNR was accessed in the ArcGIS toolbox under spatial statistics (ArcGIS Toolbox > Spatial Statistics >Analyzing Patterns > Average Nearest Neighbor). The ANNR is specifically designed for measuring patterns in terms of the arrangement of a set of points in two or three dimensions (O’Sullivan & Unwin, 2010). The nearest neighbor index is expressed as the ratio of the observed mean distance to the expected mean distance (Allen, 2011). If the average distance (observed mean distance) is less than the average for a hypothetical random distribution (expected mean distance), the distribution of the features being analyzed is considered clustered (O’Sullivan & Unwin, 2010). Similarly, the ANNR can be viewed as an index. If the index (ANNR) is less than 1, the pattern exhibits clustering while, if the index is greater than 1, the trend is toward dispersion (O’Sullivan & Unwin, 2010). Lastly, the z-scores and p-values informs the decision on whether to reject or fail to reject the null hypothesis. Rejecting the null hypothesis implies that rather than a random pattern, the features (or the values associated with the features) exhibit statistically significant clustering or dispersion (Allen, 2011; O’Sullivan & Unwin, 2010).
9. Results
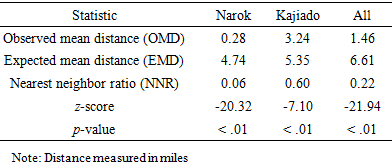
- Based on the nearest neighbor summary values (Table 1), it is evident that there was a clustered distribution patterns of points, overall (z=21.94, p<.01), as well as in Narok (z=20.32, p<.01) and Kajiado counties (z=-7.10, p<.01). In this regard, the researchers failed to accept the null hypothesis implying that there was statistically significant clustering of AIVs value chain actors in the study areas. Given the z-scores, there was less than 1% likelihood that this cluster could be the result of random chance.
|
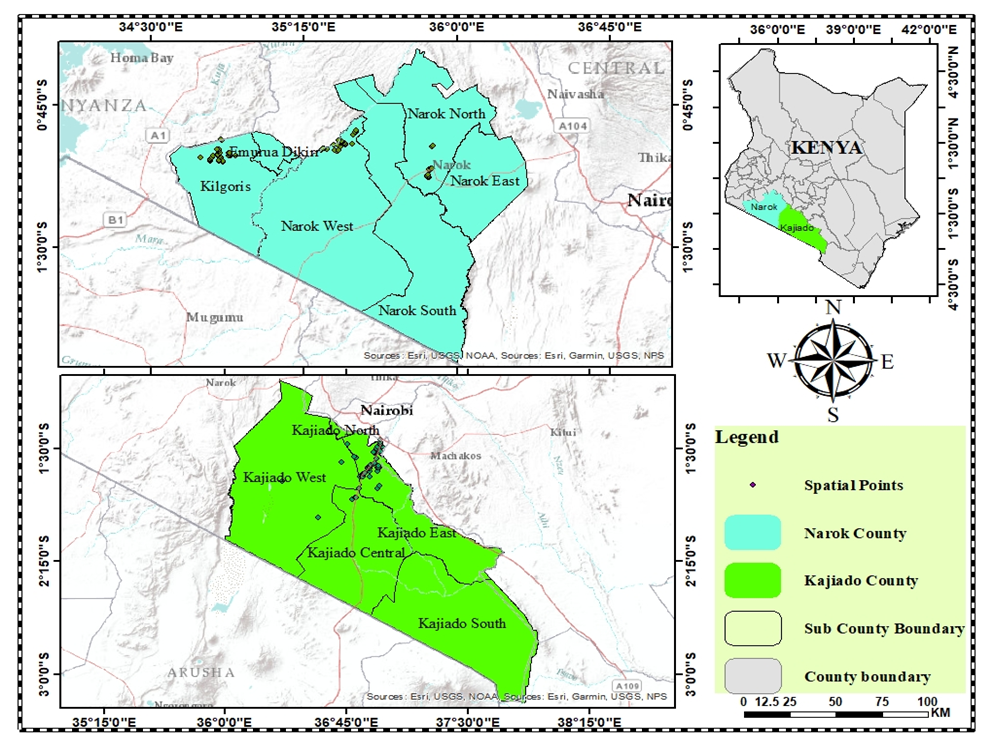 | Figure 2. Spatial patterns of the AIVs value chain actors in Narok and Kajiado CountiesImplications |
10. Recommendations for Practice
- The grouping aspect of value chain actors committing to work has been revealed under clustering of value chain actors. In this regard, formation of viable and sustainable clusters is imperative. This calls for concerted efforts from both private and public extension to provide support including strategies, policies, and programs. According to Galvez-Nogales (2010), clustering in the agricultural sector will most likely need to be induced by one or a mixture of external agents such as government, local firms, and international investors. The cluster-based approach can be a realistic way of avoiding coordination failures of Extension programming. Another important recommendation for practice is the integration of GPS as a data collection tool in agricultural Extension and education research to reap the benefits of technology. Geospatial information can be very useful in developing specific interventions to be undertaken to achieve the desired results with a targeted group.
11. Future Research
- The findings suggest the need for further studies on cluster farming and its suitability for improving Extension service delivery and farmers’ livelihoods. Cluster farming continues to serve as one of the marketing and production strategies, as well as Extension service programming. Further studies should explore more potential of the value chain. Cluster farming has been documented to provide benefits such as improving farm income; high and/or better prices; more marketing opportunities; and enhanced information access (Montiflor, et al., 2008). In addition, clustering has shown to create interaction and networking opportunities which are necessary in addressing issues of common concern (Engel, 1997). Thus, further study on vegetable cluster farming and role of social capital and/or networks will furnish more information on the direction and approach to be undertaken in promoting cluster farming in vegetable production and marketing while recognizing underlying challenges.
12. Conclusions
- The findings of this study suggest that clustering tendencies of AIVs value chain actors can be up scaled to attain high volumes to sustain the ever increasing demand of AIVs. The clusters can also be used as focal points for Extension programming.