-
Paper Information
- Paper Submission
-
Journal Information
- About This Journal
- Editorial Board
- Current Issue
- Archive
- Author Guidelines
- Contact Us
American Journal of Geographic Information System
p-ISSN: 2163-1131 e-ISSN: 2163-114X
2020; 9(1): 23-32
doi:10.5923/j.ajgis.20200901.03

Spatial Trends and Distribution Patterns of Organic Crop Production in Central Kenya
 Abstract
 Reference
 Full-Text PDF
 Full-text HTML
Raphael Mwiti Gikunda1, David E. Lawver2, Matt Baker3, Amy E. Boren-Alpizar2
1Agricultural Education and Extension, Chuka University, Chuka, Kenya
2Agricultural Education & Communications, Texas Tech University, Lubbock, TX, USA
3Agricultural Leadership, Education and Communications, Texas A&M University, College Station, TX, USA
Correspondence to: Raphael Mwiti Gikunda, Agricultural Education and Extension, Chuka University, Chuka, Kenya.
| Email: |  |
Copyright © 2020 The Author(s). Published by Scientific & Academic Publishing.
This work is licensed under the Creative Commons Attribution International License (CC BY).
http://creativecommons.org/licenses/by/4.0/

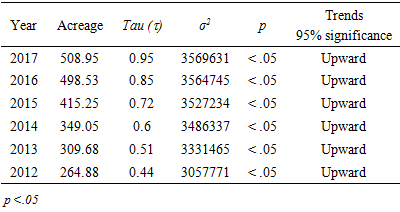
This research adds to knowledge on trends and distribution patterns of organic agriculture (OA) systems. The study was descriptive in nature involving 329 organic farmers selected through stratified random sampling from four counties in Central Kenya. The counties were Nyeri, Murang’a, Kirinyaga, and Kiambu. A peer and expert reviewed semi-structured questionnaire and GPS devices were used for data collection. The mean acreage under OA in the four counties rose significantly from M = 264.88, (tau) τ = .0.44, p < .05 in 2012 to M = 508.95, τ = .95, p < .05 in 2017. The annual income from organic crops increased by 84% from KShs 29,926 ($299.26) in 2012 to KShs 181,635 ($1816.35) in 2017. Most of the organic farms were clustered as reported by the average neighbor index (index = .05, p <.05, Z = -37.24). More conventional agricultural farmers converted to OA, thus, acreage and income emanating from organic crop production rose tremendously. The clustering of the farms resulted from the formation of farmer groups, proximity to the packing houses and holding facilities, environmental, sociological, and financial factors. More farmers in the region should be encouraged to convert to OA. An expansion of clusters would enhance the sharing of information.
Keywords: Estimated positional errors, Organic agriculture, Spatial trends, Distribution patterns
Cite this paper: Raphael Mwiti Gikunda, David E. Lawver, Matt Baker, Amy E. Boren-Alpizar, Spatial Trends and Distribution Patterns of Organic Crop Production in Central Kenya, American Journal of Geographic Information System, Vol. 9 No. 1, 2020, pp. 23-32. doi: 10.5923/j.ajgis.20200901.03.
Article Outline
1. Introduction
- Agricultural systems are continually changing worldwide in response to economic, technological and social trends (Limpisathian, 2011). FAO in its report recommended a wide range of creative, sustainable agricultural systems, which not only provide food, but also a factor in the economic value (FAO, 2016). Sustainability is a three-dimensional concept that encompasses economic, environmental, and social aspects (Mani, et al., 2016). OA is a promising path that is associated with environmental, social, and economic benefits of agriculture (Ahlem & Hammas, 2017). Few studies have been conducted in developing countries, especially sub-Saharan Africa, to map organic agriculture (OA). Empirical evidence indicates that adopters of OA are not randomly distributed across space, but are spatially clustered (Wollni & Anderson, 2014). Eades and Brown (2006) posit that the concentration of organic acreage and producers in certain regions of the U.S. seems to indicate that some form of clustering is present within the industry and that factors exist which make OA more apt to survive and grow in some regions rather than others. From a regional science point of view, organic farms appear to be under the influence of "centripetal forces" that tend to concentrate and encourage economic activity in the form of economic clusters (Eades & Brown, 2006).OA activities are regionally agglomerated to a certain degree. Regions with high shares of organic farming tend to be close to other regions with high shares of organically farmed land (Parker & Munroe, 2007). In addition, a high share of organically managed land in a region seems to be an ideal precondition for the decision of a farmer to convert to OA organic production (Schmidtner, et al., 2012). Research shows that spatial externalities whose marginal impact decreases with distance influence the location and production patterns of certified organic farms (Lewis, Barham & Robinson, 2011; Parker & Munroe, 2004; Parker & Munroe, 2007). Vos (2000) observed that organic practices are often closely related to landscape heterogeneity and a range of social and cultural diversity partly due to the agro-ecological differences that occur from the farm-scale to the community and to the region. Bagi and Reeder (2012) also found that regional differences in OA could result from agricultural geography. Research has shown that farmers in areas with low potential for intensification are more likely to adopt organic farming since flat land and certain soil types are more conducive to intensive agriculture while steep slopes and hilly terrain are disadvantages to intensification and mechanization (Schmidtner, et al., 2012; Wollni & Andersson, 2014).Environmental, social, and financial elements have been found to influence the distribution of OA systems. Bichler, Haring, Dabbert, and Lippert (2005) categorized factors with a likely influence on spatial distribution OA into four, namely, natural, farm-structure, socio-economic, and political elements. A study by Kacprzak and Mackiewicz (2014) reported that OA in Poland and Spain are determined by a number of elements including financial aid, an introduction of clear law, the scale of OA production, and demand for OA produce. A study by Gabriel, et al., (2009) described the key economic and sociological variables that influence conversion to OA as yields, profits, forces of demand and supply, and public/farmer attitudes. Research has shown that environmental conditions predispose farmers to convert from conventional to OA, thus this form of agriculture becomes clustered in the agricultural landscape. Specifically, agro-ecological conditions and locality will directly influence the possibilities of a farmer to implement and derive benefits from OA (Wollni & Andersson, 2014).A previous study has suggested that spatial aggregation is also likely to evolve out of sociological factors (Gabriel, et al., 2009). Most farmers are likely to convert to OA in a locality where most of the farmers have already converted. Morone, Sisto, and Taylor (2006) reported that the social acceptability of organic farmers might be higher if many farmers in the vicinity are already organic. Wollni and Andersson (2014) suggested that policies that target areas with more desirable land use or encourage such land uses can potentially reduce negative spatial effects and promote OA. A study involving network analysis in Italy provided evidence that local organizations in the organic sector play a role in the diffusion of legal and technical knowledge (Morone, et al., 2006). Social acceptance has been found to play an important role in the adoption decision of farmers in developed countries. Social conformity in spatial clustering is where there is a tendency of the individual to behave in compliance with the individual’s social group (Läpple & Kelley, 2015).A few studies have been conducted to provide insights on financial factors influencing the distribution of OA. Wollni and Andersson (2014) observed that organic markets are likely to be more mature for certain crops than for others in a particular region. The market of organic products also counts, for instance, if farmers are situated in a location with conditions suitable for growth of products that command organic premiums, they will have greater financial incentives to convert to OA. Accordingly, there is a likelihood of the occurrence of spatial concentration of OA to the extent that these geographic related-factors are spatially correlated (Wollni & Andersson, 2014).
2. Purpose and Objectives
- This study sought to spatially analyze and describe the trends and distribution patterns of organic crop production in Central Kenya. This research provides empirical evidence that could be beneficial to the planning and execution of extension services related to OA as well as the formulation of supportive policies, all of which could spur the growth of the organic industry in Kenya. The research objectives were to:a) Analyze the spatial trends of organic crop production, and b) Describe the spatial distribution patterns of organic crop production in Central Kenya
3. Materials and Methods
- Data CollectionThis research was conducted in Central Kenya, which covers an area of 13,191 km2 (5,093 sq. miles) and contains a population of 4,383,743 (Kenya National Bureau of Statistics, 2010). Central Kenya is located to the north of Nairobi and west of Mt. Kenya. The study was descriptive in nature involving 329 organic farmers selected through a stratified random sampling of four counties. The counties were Nyeri, Murang’a, Kirinyaga, and Kiambu as shown in Figure 1. Agricultural production in Central Kenya is mainly rain-fed where rainfall occurs in two seasons. The long rainy season occurs between March and June, while the short rains fall between October and December. The mean annual rainfall ranges between 1200 mm to 1500 mm. The soils, which are primarily nitosols, are deep, and of moderate to high fertility (Franzel, Wambugu, & Tuwei, 2003).
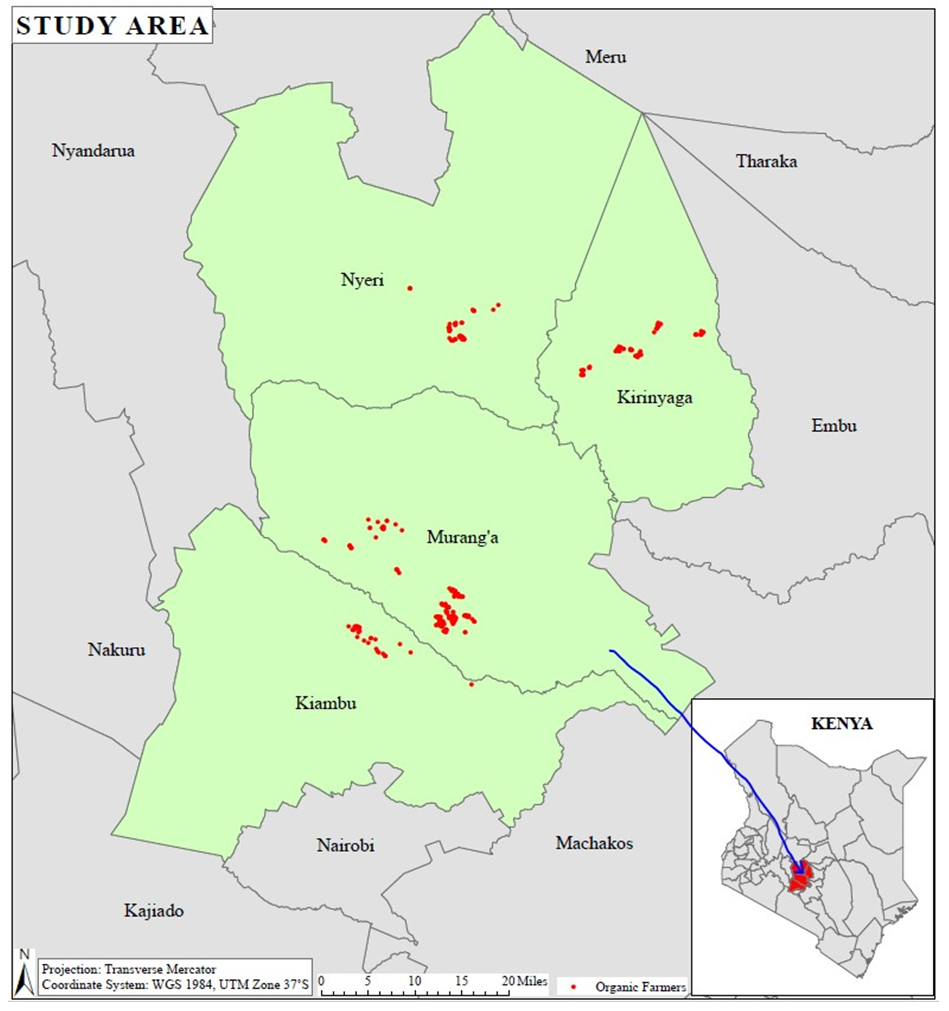 | Figure 1. A map of the study area illustrating the distribution of organic farmers by county |
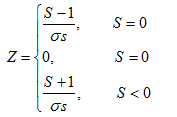 | (1) |
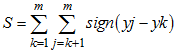 | (2) |
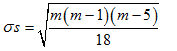 | (3) |
 | (4) |
 | (5) |
 and
and  are standardized scores of attribute values for unit i and j, and j is among the identified neighbors of i according to the weights matrix
  (Anselin, Kho, & Syabri, 2004). Moran’s I require a weights matrix that defines a local neighborhood around each geographic unit. Therefore, before bivariate Moran’s I was conducted, a weight matrix was created using queen contiguity. The value at each unit is compared with the weighted average of the values of its neighbors. A weights file identifies the neighbors and it is calculated from the distance between points. The formulae of each weight are as follows;
 with
with  =1 when i is linked to j, and
  = 0 when otherwise (Anselin, Kho, & Syabri, 2004).
4. Results and Discussion
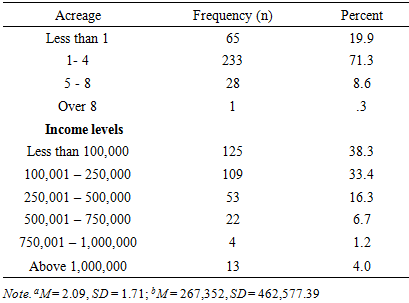
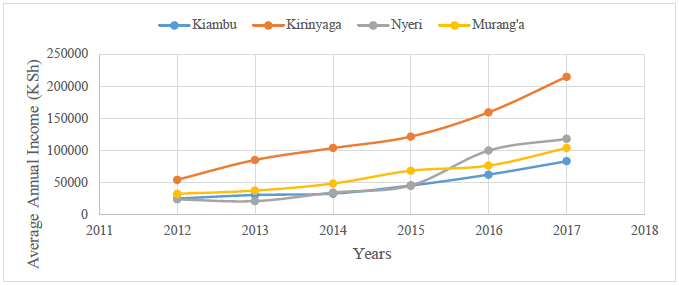
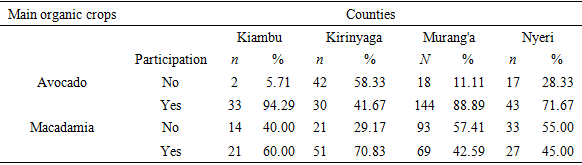
- Organic Crop Production in Central KenyaMost of the organic farmers (n = 233, 71.3%) owned between one and four acres as presented in Table 1. The average acreage under OA was M = 2.09, SD = 1.71, although the farm sizes ranged from .025 to 13 acres. The results in Table 1 indicate that many of the farmers (n = 125, 38.3%) earned less than Kshs 100,000 annually. The annual incomes from organic crops ranged from Kshs 2,500 ($25) to Kshs 3,200,000 ($32,000) (M = 267,352.01, SD = 462,577.39). Among Central Kenya counties, Murang’a dominated both in avocado and macadamia production, thus its farmers reported much higher income levels than the other counties. The production of avocado and macadamia has in recent years overtaken coffee and tea growing, both of which have been the main cash crops in the region for centuries (Bagal, Belleti, Marescotti & Onori, 2013). Other than avocado and macadamia crops, organic farmers in the region participated in the production of tea, coffee, pineapples, maize, beans, bananas, and fresh vegetables.
|
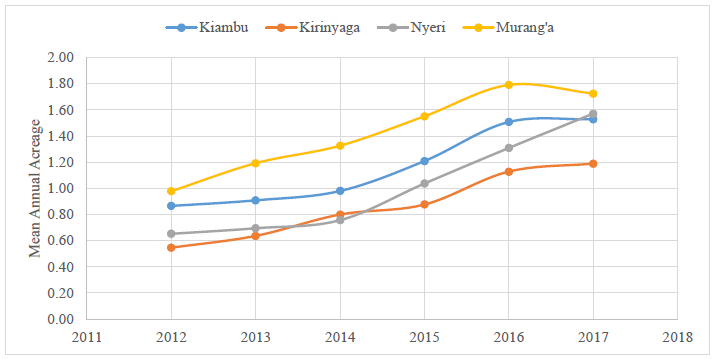 | Figure 2. Mean annual acreage under organic crop production (N = 329) |
|
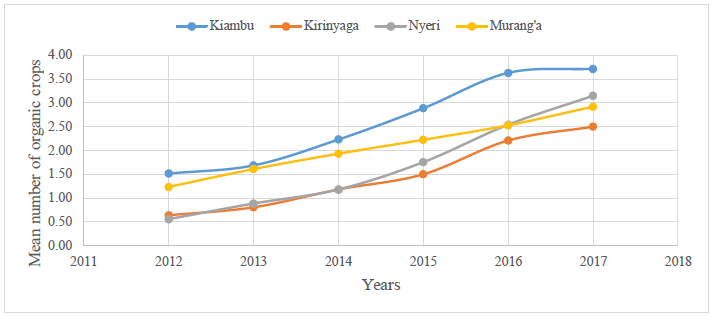 | Figure 3. Mean number of organic crops per farmer by county (N = 329) |
 | Figure 4. Mean annual organic crops’ income by county (N = 329) |
|
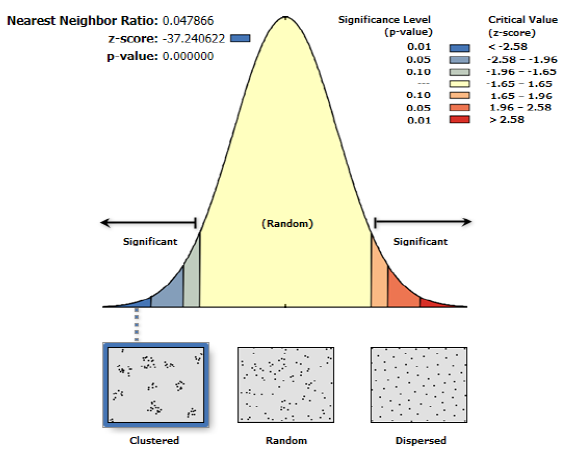 | Figure 5. Spatial distribution patterns of organic macadamia and avocado farms (N = 329) |
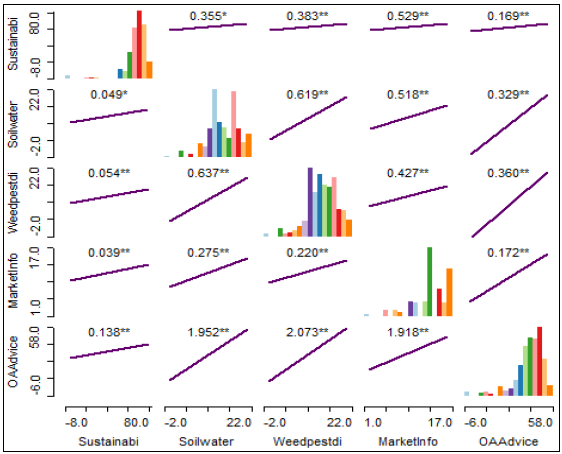 | Figure 6. Spatial autocorrelation statistics for sustainability and organic agricultural advice on produce market, soil, water, weed, pest and disease management practices (N =329); Organic farms Moran’s, I = .23, p = .001 |
|
5. Conclusions and Implications
- Most of the organic farmers in Central Kenya are small-scale as their agricultural activities take place on between one and four acres. However, there was an upward trend in organic crop production between 2012 and 2017. More conventional agricultural farmers converted to OA, thus acreage and income emanating from organic crop production increased. Farmers gradually moved from the production of one variety of crop to several varieties. The mean acreage per farmer rose by 48% from .81 acres in 2012 to 1.55 acres in 2017. Murang’a emerged as the topmost county with regards to acreage under OA. The annual income from organic crops increased by 84% from KShs 29,926 ($299.26) in 2012 to KShs 181,635 ($1816.35) in 2017. Kirinyaga County reported the highest average annual income while Kiambu County grew the highest number of organic crops. Many of the farmers participated in the production of organic macadamia and avocado. Other organic crops are grown in the region including tea, coffee, pineapples, maize, beans, bananas, and vegetables.A majority of the organic farms especially those producing macadamia and avocado in Central Kenya were clustered. A high concentration of both avocado and macadamia production was witnessed in Murang'a County as compared to other counties in Central Kenya. Among the four counties comprising the study area, Nyeri had the least number of organic farms engaged in the production of the two crops. The clustering allowed the organic farmers to share resources such as production and marketing information, and collectively market their produce (Gikunda & Lawver, 2019). The clustering of the organic farms may have been brought about by a number of factors. Many of the organic farmers, especially those certified, are organized in groups and members of these groups owned farms that were closely located. It is apparent that farmers located in the same area and producing similar crops would want to benefit from positive outcomes associated with group marketing, access to finance, and economies of scale (Gikunda & Lawver, 2018).Macadamia and avocado have become lucrative produce with the establishment of packing houses and holding facilities in the region to process and export fresh produce. A kilo of certified macadamia sell for between 180 and 250 KShs while the certified avocado farm gate price is between 8 and 16 KShs, depending on the quality. Most of the organic farms were found concentrated around the organic packing houses and holding facilities established by local and external companies such as Kakuzi, Jungle Nut, Sasini, etc. These companies had contracted farmers around their vicinity to grow organic produce for them. Each of the companies has employed its own extension agents to disseminate OA information to its contracted farmers. The concentration of the farmers around the packing houses and holding facilities and skewed dissemination of OA practices also contributed to the clustered patterns (Greene & Kremen, 2003) witnessed.Environmental factors, including ecological conditions and soils favorable for the production of certain crops, like macadamia and avocado, in certain locations of the study area also accounted for the clustered application of the OA practices as revealed by the findings. The altitude of the sampled farms ranged between 1650 and 2100 m above sea level, temperatures of between 52 and 79 degrees Fahrenheit (11 to 26 degrees Celsius) (FAO, 2012) favored the production of the two major organic crops. The clustering of organic farms is not only beneficial to farmers but also to the companies, extension services, and policymakers. The concentration of farms around the companies eases the transport of raw nuts and avocado and thus reduces the transport costs. With the knowledge of where farmers are concentrated, extension educators are better able to plan, package, and disseminate localized and crop-based OA information to the farmers. Knowledge of clusters eases communication as it serves as one of the criteria that guide the choice of communication mode.
ACKNOWLEDGEMENTS
- The authors acknowledge logistical support that was offered by Kenya Organic Agriculture Network during data collection. We also appreciate the financial support that was offered by the Graduate School and Department of Agricultural Education and Communications, Texas Tech University.