-
Paper Information
- Next Paper
- Paper Submission
-
Journal Information
- About This Journal
- Editorial Board
- Current Issue
- Archive
- Author Guidelines
- Contact Us
American Journal of Geographic Information System
p-ISSN: 2163-1131 e-ISSN: 2163-114X
2020; 9(1): 1-12
doi:10.5923/j.ajgis.20200901.01

Modeling the Impact of Traveling Time on the Utilization of Maternity Services Using Routine Health Facility Data in Siaya County, Western Kenya
 Abstract
 Reference
 Full-Text PDF
 Full-text HTML
Oluoch Felix 1, Ayodo George 1, Owino Fredrick 2, Okuto Erick 3
1Department of Public and Community Health, School of Health Sciences, Jaramogi Oginga Odinga University of Science and Technology, Bondo, Kenya
2Department of Spatial Planning, School of Spatial Planning and Natural Resource Management, Jaramogi Oginga Odinga University of Science and Technology, Bondo, Kenya
3Department of Applied Statistics, School of Mathematics and Applied Statistics, Jaramogi Oginga Odinga University of Science and Technology, Bondo, Kenya
Correspondence to: Oluoch Felix , Department of Public and Community Health, School of Health Sciences, Jaramogi Oginga Odinga University of Science and Technology, Bondo, Kenya.
| Email: |  |
Copyright © 2020 The Author(s). Published by Scientific & Academic Publishing.
This work is licensed under the Creative Commons Attribution International License (CC BY).
http://creativecommons.org/licenses/by/4.0/

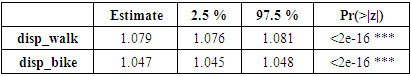
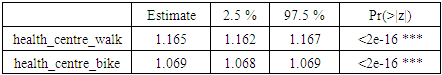
In Kenya, no studies have attempted to use routine health facility data disaggregated by level of care, to find out if there is a significant statistical relationship between physical accessibility and utilization of maternity services at the ward administrative level. A cross-sectional study design used publicly available geospatial data in combination with routine data from the web-based district health information software (DHIS2) platform. AccessMod (version 5.2.6) was used for travelling time analysis. ArcGIS (version 10.5) and R (version 3.5.3) sufficed for the preparation of geospatial input and the manipulation of AccessMod results respectively. The associations between the independent and dependable outcome was computed using a Zero-inflated Poisson regression model at 95% confidence level. The findings in Siaya County revealed a higher likelihood of a skilled delivery 35% (0.353; CI: 0.349–0.357) and 16% (0.164; CI: 0.162–0.167) respectively, for every unit increase in the proportion of pregnant women who could reach a hospital and health centre within an hour of walking, as compared to being within an hour of a dispensary 4.6% (0.046; CI: 0.045–0.048) using motorcycle transport. Simply advising women to opt for motorized transportation schemes to improve their access to low quality facilities, may in fact, result in diminishing returns. The immediate implication is that policy makers need to upgrade lower tier maternity health services in Siaya County, as pregnant women may value quality of services regardless of the distance. Future research should consider looking at the relationship between skilled delivery and the capacity of existing maternity health services.
Keywords: Maternity services, Geographic information systems, Traveling time, Routine health facility data, DHIS2
Cite this paper: Oluoch Felix , Ayodo George , Owino Fredrick , Okuto Erick , Modeling the Impact of Traveling Time on the Utilization of Maternity Services Using Routine Health Facility Data in Siaya County, Western Kenya, American Journal of Geographic Information System, Vol. 9 No. 1, 2020, pp. 1-12. doi: 10.5923/j.ajgis.20200901.01.
Article Outline
1. Introduction
- Achieving the sustainable development goals (SDG) target of a global maternal mortality ratio (MMR) of fewer than 70 maternal deaths per 100,000 live births by 2030 will require high-quality data to track progress and achievement (United Nations, 2017), so that no country should have an MMR greater than 140 maternal deaths per 100,000 live births, a number twice the global target (WHO, 2015). According to a 2016 United Nations (UN) report, about 830 women die from pregnancy- or childbirth-related complications around the world every day (Alkema et al., 2016). Almost all of these deaths occurred in low-resource settings, and most could have been prevented (Say et al., 2014; You et al., 2015). More importantly, the SDGs further amplify the importance of local data to assess progress and allocate resources to reduce inequalities within high burden regions like Sub-Saharan Africa, where about 60 percent of maternal deaths occur during childbirth and the immediate postpartum period, with 50 percent of such deaths occurring within the first 24 hours after delivery (WHO & UNICEF, 2015).On the other hand, more data on coverage of safe delivery indicators are collected, yet little is used to inform policy decisions in high burden countries like Kenya, where the MMR of 362 deaths per 100,000 live births currently remains well above the global rate of 210, despite the country falling short of its Millennium Development Goal (MDG) target of 147 per 100,000 (MoH, 2016). Data processing and analysis is usually centralized which often fails to provide feedback to lower organizational units, yet sub-nationally, only about half of mothers residing in rural areas of the country reportedly received skilled care or delivered in a health facility compared to 82 percent of mothers residing in urban areas (KDHS, 2014). Nevertheless, despite devolution of healthcare and the introduction of free maternity services in Kenya, the use of skilled attendance at birth remains low in many places because of cultural reasons and because health facilities are inaccessible or services are perceived to be of poor quality in the lower middle-income country (KDHS, 2014; Ministry of Health (MoH), 2016; S. O. Nyangueso, P. Hayombe, & F. Owino, 2018). As such, methods that allow for better use of existing disaggregated data at the local level may be more useful for planners and decision makers, since aggregated maternal health indicators even at subnational level can often conceal important inequities, with the rural poor often least well represented (MoH, 2016).Furthermore, only 15 out of 47 counties in Kenya accounted for 98.7% of the total maternal deaths in the country (UNFPA, 2014). Yet Siaya, the worst of six counties in Nyanza region, Kenya, with an unacceptably high MMR of 691 maternal deaths per 100,000 live births, also received the best ranking in terms of its overall readiness to provide maternity health services according to a previous service availability and readiness assessment mapping (SARAM) around the same period (Gok, 2014; UNFPA, 2014). However, use of routine health-facility data to assess coverage and prevalence of maternal and child health indicators, for example, has recently been recognized as an opportunity to provide more precise numerator estimates (Maina et al., 2017). As such, there is urgent need to move beyond summarized national and even subnational coverage estimates, and use local data to make programmatic decisions in priority settings where emphasis is currently placed on data aggregation and reporting. Additionally, in settings like Kenya, nationally representative cross-sectional surveys such as Demographic and Health Surveys (DHS) and Multiple Indicator Cluster Surveys (MICS) will continue to provide vital statistics (Corsi, Neuman, Finlay, & Subramanian, 2012) at least at the first administrative level (provinces, regions or counties), even if sample sizes used in such perennial surveys do not meet the current demand for local coverage data, both in terms of timeliness and disaggregation (Alegana et al., 2017), despite recent progress in the implementation of electronic web based reporting systems that allow for easier and faster reporting and better data quality control and feedback for monitoring trends down to even the lowest administrative level (e.g. wards) (Maina et al., 2017). Today, district health information software, version 2 (DHIS 2) is the world's largest health management information system (HMIS) platform, in use by 67 low and middle-income countries, including national-scale deployments in 46 countries (DHIS2, 2019). More importantly, in recognition of the key impact that Emergency Obstetric Care (EmOC) can have on maternal mortality and safe birth outcomes, global health policy experts like WHO categorically recommend the local use of Geographic Information Systems (GIS) based on travel time cost surface models, rather than unrealistic straight-line distances, in measuring physical accessibility to maternity health services, as time is a more comparable measure (e.g. between countries) than distances (Munoz & Källestål, 2012; Ray & Ebener, 2008; WHO, 2016a). AccessMod platform for instance, is a free and open source WHO developed spatial model which estimates the most efficient travel time to a health facility along established roads, walking paths and landscape barriers and has emerged as one of the most robust analytical spatial techniques applied in maternal health towards universal health coverage (UHC) (Ebener et al., 2015; Roth et al., 2016; Schmitz et al., 2019). Hence, in examining physical access to maternity health services or predicting skilled birth attendance, the application of geographic approaches and GIS to measure inequities in maternal health outcomes is critical to assess the situation and needs and guide policy decisions (Ebener et al., 2015).In summary, the wider use of routine health facility data within the Kenyan context via robust and open source platforms like DHIS 2, may indeed provide an unprecedented opportunity for local decision makers to employ the power of existing GIS able to combine information on theoretical physical accessibility to maternity services, with more accurate and timely reporting on the numerators of the coverage for safe delivery indicators-to locate, measure and address the needs of most vulnerable pregnant women. Therefore, based on current GIS best practices from literature (Ebener & Stenberg, 2016a; Makanga, Schuurman, von Dadelszen, & Firoz, 2016; Schmitz et al., 2019), in combination with data on the actual use of available maternity services from DHIS2, the current study estimated how different transportation modes (walking and/or motorized) affected women’s ability to utilize maternity health services at the ward administrative level. Thus, the urban areas population were spatially excluded and facilities were disaggregated by level of care (hospitals, health centres and dispensaries), towards a more realistic representation of the magnitude of the relationship between physical accessibility and utilization of existing maternity health services in rural Siaya County.
2. Materials and Methods
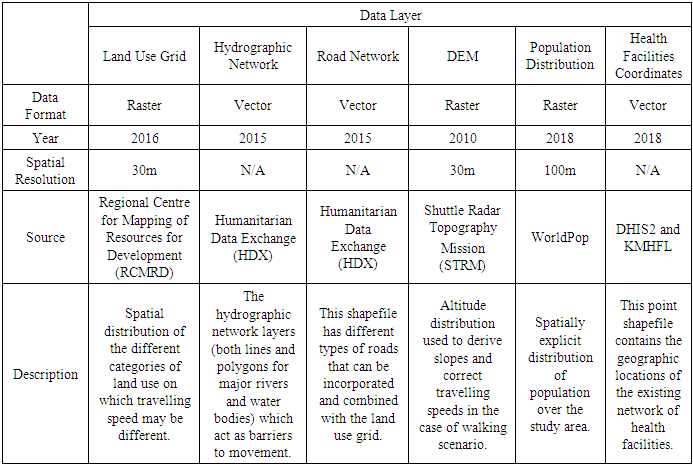
- Study AreaSiaya is one of six counties in the Nyanza region of Kenya. It has a land surface area of approximately 2,530 km2 and water surface area of approximately 1,005 km2. It approximately lies between latitude 0° 26´ South to 0° 18´ North and longitude 33° 58´ and 34° 33´ East. The county consists of six sub-counties and thirty wards. Alego Usonga, Bondo and Gem sub counties have six wards each; Rarieda, Ugenya and Ugunja sub counties have five, four and three wards respectively; Alego Usonga is thus the largest sub county with an approximate area of 605.8 km2, while Ugunja is the smallest with an approximate area of 200.9 km2 (Siaya County, 2018). The female reproductive population was estimated at 222,846 representing 22.7 per cent of the population and was projected to increase to 238,527 and 273,276 persons in 2022 and 2030 respectively. The county’s population density of 318 per square kilometer is further anticipated to increase to 415 and 476 in 2022 and 2030 respectively. In terms of the population distribution by residence, 89 per cent of Siaya County residents currently live in the rural areas. As of 2017, the county had 434.2km of bitumen standard roads, 1297.41km of gravel, 532.78 km of earth and a further 1,170 narrow roads. The main development challenges include poor infrastructure, inadequate water supply, erratic electricity supply, high prevalence of HIV/AIDS and high unemployment; as a result, about 47.5% of the total population in the county currently lives below the poverty line (Siaya County, 2018).Moreover, by 2018, the number of health facilities registered in the county were 220, comprising 11 hospitals (level 4), 50 health centres (level 3) and 159 dispensaries (level 3). (S. O. Nyangueso, P. O. Hayombe, & F. O. Owino, 2018). The County’s uptake of Antenatal care and skilled Birth Attendance was higher than the national average, but it is not certain whether all the demand was met within or there was spill over to neighboring Counties. According to last demographic and Health Surveys (DHS), percentage mothers receiving antenatal care from a skilled provider in the county was 98.5% as compared to 95.5% nationally (KDHS, 2014). Similarly, percentage mothers who delivered in a health facility was 66% compared Kenya’s 61.2%, yet the demand for the maternal services in 2018 was 38,972 annually, as depicted in the figure 1 below (Samuel Ouma Nyangueso et al., 2018).
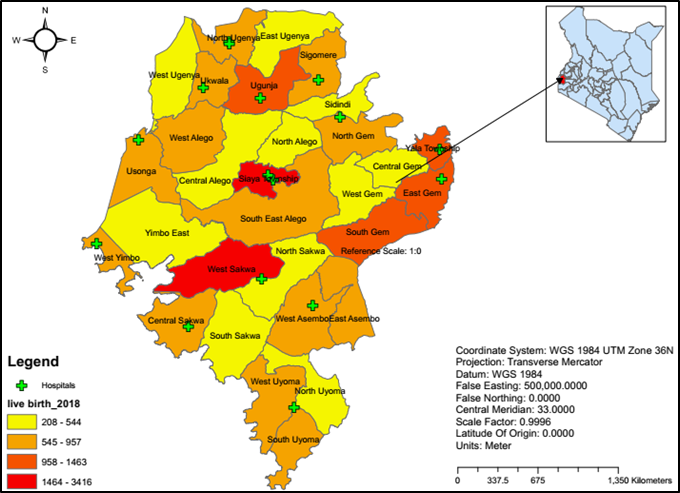 | Figure 1. Study Area |
|
|
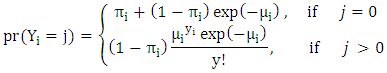 Where µi is a rate parameter expressing the rate of ward level skilled deliveries. The likelihood function prob (Yi=j) was then used as the family of the generalized linear model (glm). Moreover, for the zero inflated model, maximum likelihood estimation method was used to obtain the slope parameter estimates. Significance of the slope parameters were assessed using probability (p) value computed at 95% confidence level.Ethical ConsiderationsThe study protocol was approved by the the Jaramogi Oginga Odinga University Ethical Review Board in close collaboration with the National Commission for Science Technology and Innovation and the Siaya County health department, Division of reproductive health.
3. Results
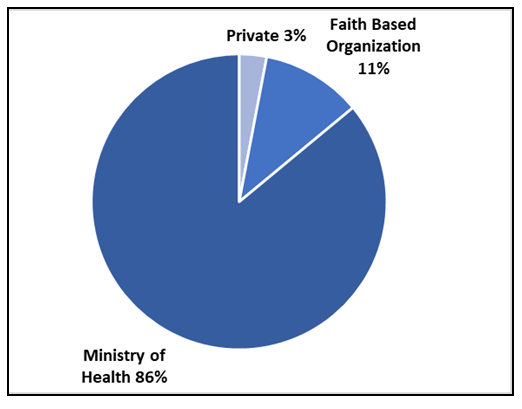
- Summary Statistics from DHIS2According to data from the web based DHIS2 platform, in terms of facility ownership, 21,810 (86%) deliveries took place in public facilities owned by the Ministry of Health, followed by 2,894 (11%) deliveries in facilities owned by Faith Based Organizations, and only 834 (3%) of pregnant women preferred Private for-profit facilities as illustrated in figure 2 below.
 | Figure 2. Comparing the proportion of total deliveries by health facility ownership in Siaya County |
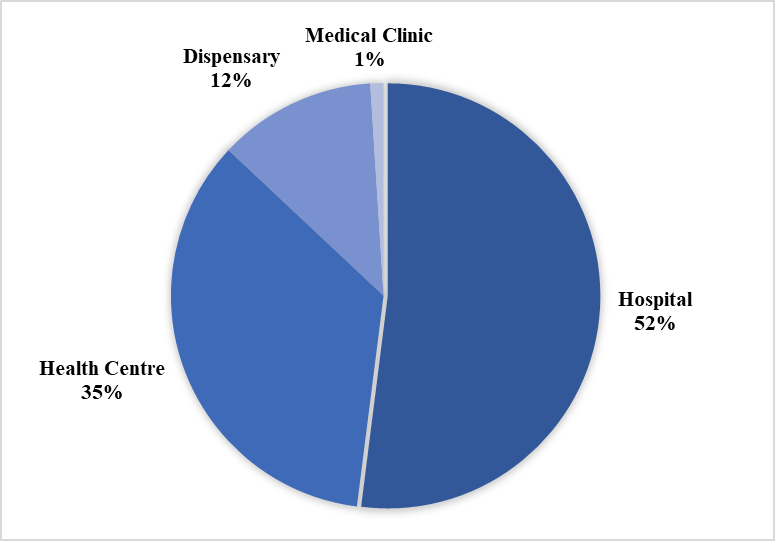 | Figure 3. Comparing the proportion of total deliveries by health facility type in Siaya County |
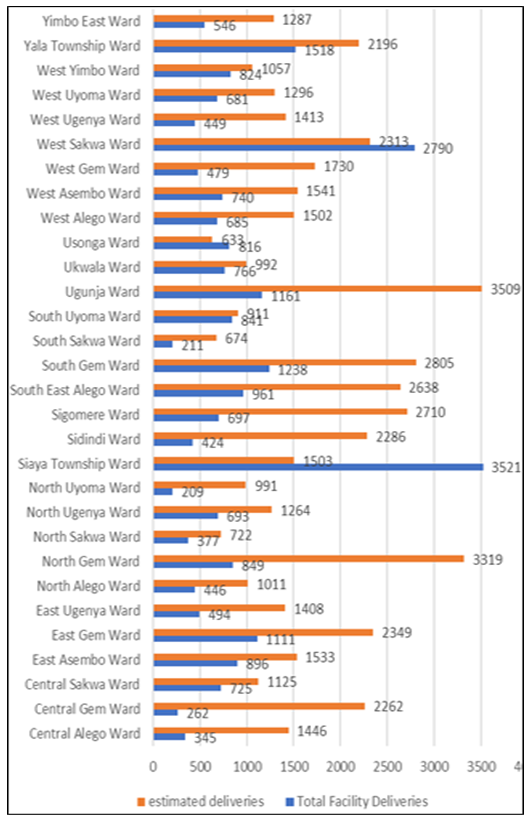 | Figure 4. Showing the number of estimated deliveries versus the total deliveries that took place in a health facility across all wards in Siaya county |
|
|
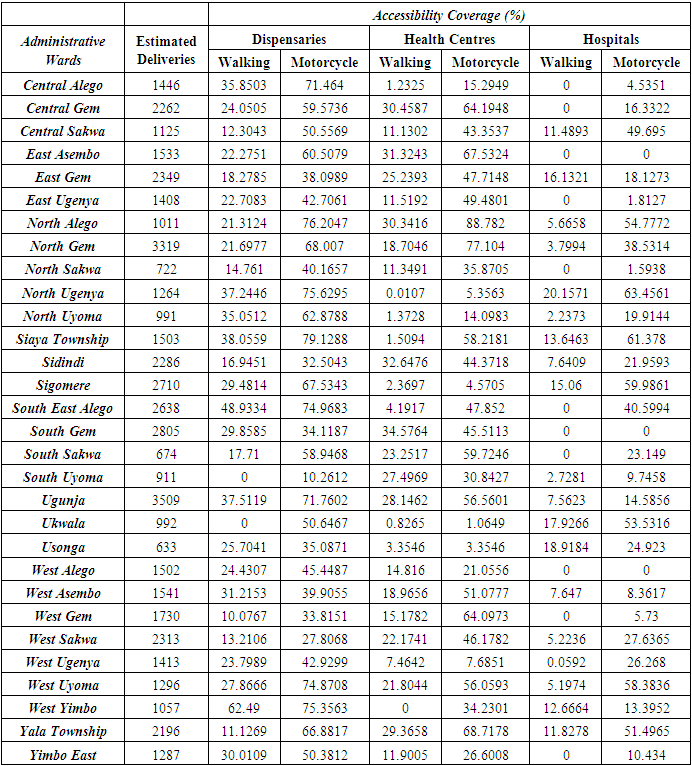
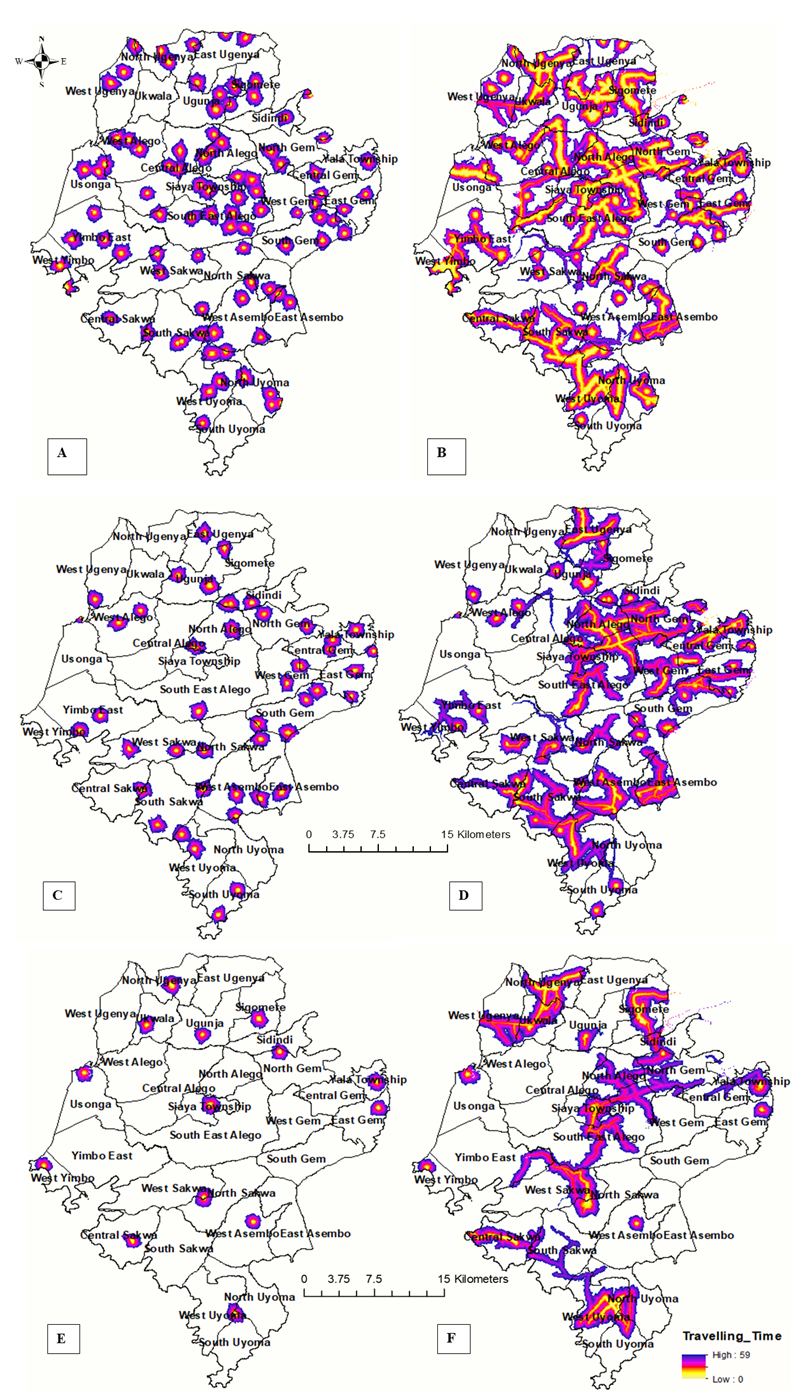 | Figure 5. The distribution of dispensary level (A and B), health centre level (C and D) and hospital level (E and F) travelling time scenarios across all wards in Siaya county (A, C and E= walking scenario; B, D and F=motorized scenario) |
|
|
|
4. Discussion
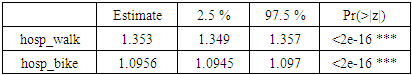
- The current study demonstrates the feasibility of combining routine health facility data with existing GIS best practices to map out spatial inequalities in maternity health services utilization, as currently recommended by global policy experts like the WHO. The web based DHIS2 data platform in particular, is indeed robust in terms of its timeliness and completeness, even if reporting rates for reproductive and child health in Siaya county for the year 2018 were as high as 98.7%, and 92.3% of such reports were on time. Nevertheless, the robustness and prudence of using routine health facility data for local decision making has previously been demonstrated by a recent study in Kenya, that revealed that reporting completeness for facility data were well above 80% in all 47 counties, and the consistency of data over time was indeed good ((Maina et al., 2017). Similarly, a most recent study in Siaya county confirmed improvements in the data quality score for routine health facility statistics because of the county health management team (CHMT) identification of gaps in the reporting tools, as well as a recent update of the guidelines for collecting and analyzing such data (Millar, 2019).Furthermore, based on summary statistics from DHIS2, the current study findings of a higher proportion of deliveries happening in facilities owned by the ministry of health, are consistent with a recent study that attributed a significant increase in the number of deliveries conducted in Kenyan public health facilities to the elimination of user fees for delivery services (Gitobu, Gichangi, & Mwanda, 2018), despite the fact that a majority of deliveries in Siaya County happened in hospitals and health centres at the expense of dispensaries, yet the number of dispensaries outnumber hospitals and health centres combined. However, decision makers need to concentrate efforts in the 18/30 administrative wards in Siaya county where skilled delivery coverage was less than 50%, even though neighbouring wards where skilled delivery coverage was more than 100%, could suggest a need to focus on service quality due to the influx of pregnant women seeking higher quality services farther away, whilst shunning lower quality facilities that may indeed be closer to them.In terms of traveling scenario, the current findings suggest that walking had the greatest negative impact on the ability of a pregnant woman to access the nearest facility offering maternity services. Although this finding was consistent with both previous and most recent studies (Ebener et al., 2015; Makanga et al., 2016; Schmitz et al., 2019), further analysis across higher level facility types like health centres and hospitals contrasted this finding that walking distance alone was enough to determine whether or not a pregnant woman reached, and thus utilized, a nearby health facility offering maternity services. A case in point is from a previous study of the correlates of utilization of skilled maternal health services in Siaya County, which revealed that poverty, low education, husband/ partners education and walking or using a bicycle to hospital were significantly associated with low utilization of skilled maternal health services (Omondi & Amolo, 2015), even if a comparable study reaffirmed that in the event high accessibility ratios overlap with low levels of utilization, it could suggest that physical accessibility may not be the main determinant of maternity services utilization and that other barriers might exist in areas like Siaya county with poor maternal health outcomes (Colston & Burgert, 2014). Motorcycle traveling scenario on the other hand, was consistent with earlier studies that suggested that more pregnant women could indeed access maternity health services if they opted for motorized transportation schemes. For example, a recent study in Kigoma region in Tanzania, confirmed the importance of motorcycles and bicycles as intermediate means of transportation to improve access to health services, taking advantage of their high availability and mobility (Chen et al., 2017). Similar trends were also observed in a study that used travel time cost surface modeling to assess accessibility by various transportation scenarios in the Western Province of Rwanda (Munoz & Källestål, 2012).More importantly, the present study also calculated the maximum likelihood of a skilled delivery across different health facility types, based on alternative traveling scenarios. The findings however, suggest a very strong relationship between physical accessibility and the probability of a skilled delivery across all levels of care (hospitals, health centres or dispensaries), regardless of a walking or motorized traveling scenario. Nevertheless, the findings in Siaya County also revealed a higher likelihood of a skilled delivery for every unit increase in the proportion of pregnant women who could reach a hospital or health centre by walking, as compared to reaching a dispensary even if they opted for motorcycle transport. This finding is nevertheless consistent with a fairly recent study on the role of distance and quality on facility selection for maternal and child health services, albeit in urban Kenya, which found out that once a woman has to travel to a facility that is not close to her home, she is acting on her preference for a higher quality facility, even when the nearest facility is closer to her home, she may weigh her options differently before bypassing (Escamilla, Calhoun, Winston, & Speizer, 2018). Moreover, a more recent GIS based study in Siaya County reaffirmed that increasing availability of low quality and non-comprehensive health facilities is not cost effective, since they are most likely to be bypassed and rendered redundant or grossly underutilized. Thus, county governments ought to prioritize improving quality and expanding services within existing health facilities (Samuel Ouma Nyangueso et al., 2018).
5. Limitations
- In contrast, a major caution for the current analysis, as well as for other studies using travel time cost surface models, is the assumption of a closed system- where women don’t seek services outside the study area, yet in actual sense, pregnant women living near borders were likely to travel beyond the current administrative boundaries of Siaya County to seek maternity services. There were also minor limitations in terms of time discrepancies and different resolutions between the publicly available geospatial datasets, despite omission of the few privately-owned facilities that were not offering free maternity health services. Moreover, boat and travel by car were not analyzed, as the study area was restricted to the larger mainland Siaya County, and because rural women in such a low resource setting with poor road networks, were less likely to rely on car travel.
6. Conclusions and Recommendations
- The current analysis has confirmed the feasibility of leveraging local routine health facility data to model physical accessibility and evaluate its impact on maternity health services utilization. Moreover, it should be understood that the likelihood of skilled delivery goes beyond the physical proximity of a health facility, as such, simply advising women to opt for motorized transportation schemes to improve their access to low quality facilities, may in fact, result in diminishing returns. The immediate implication is that policy makers need to upgrade the quality of lower tier maternity health services in Siaya County, as pregnant women may value quality of services regardless of the distance. Future research should also consider looking at the relationship between skilled delivery and the capacity of existing maternity health services, albeit based on local routine health facility data.
ACKNOWLEDGEMENTS
- I would like to thank the Siaya County Health Department, Division of Reproductive Health and the County Health Management Team for their support.