Aicha Saad1, Adam Milewski2, Lahcen Benaabidate3, Zin El Abidine El Morjani1, Lhoucine Bouchaou4
1Exploration and Management of Natural and Environmental Resources Team, Department of Sciences and Technology, Ibn Zohr University, Taroudant, Morocco
2Geology Department, University of Georgia, Athens, GA, USA
3Environment Department, Sidi Mohamed Ben Abdellah University, Fès, Morocco
4Geology Department, Ibn Zohr University, Agadir, Morocco
Correspondence to: Aicha Saad, Exploration and Management of Natural and Environmental Resources Team, Department of Sciences and Technology, Ibn Zohr University, Taroudant, Morocco.
| Email: |  |
Copyright © 2019 The Author(s). Published by Scientific & Academic Publishing.
This work is licensed under the Creative Commons Attribution International License (CC BY).
http://creativecommons.org/licenses/by/4.0/

Abstract
Flood impact is one of the most significant disasters in the world. Floods are due to natural factors such as heavy rainfall, high floods and high tides, etc., and human factors such as blocking of channels or aggravation of drainage channels, improper land use, deforestation in headwater regions, among others. With the increasing use of GIS, HEC-RAS and digital databases in the floodplain mapping and management processes, the present paper develops a simplified one-dimensional model applied to the Sidi Ifni basin. This approach allows visualizing and quantifying the results in a spatial format. A Digital elevation Model (DEM) was used to create hydraulic model geometry data. The computational procedures were based on a 1D energy equation for steady flow water surface profile calculations. Flows were assessed from a frequency analysis of the only gauging station data. The results have shown that the return period of the observed floods 1985, 2002 and 2015 is respectively about 20-year, 10-year and 50-year, a lateral overflow of the decadal and centennial floods where the maximum water depth is 6.78m for Q (10) and 6.96 m for Q (100). The results obtained can be useful to guide the development plan of the Sidi Ifni city, which is growing.
Keywords:
Urban Flood mapping, HEC-RAS, GIS, 1 D modelling
Cite this paper: Aicha Saad, Adam Milewski, Lahcen Benaabidate, Zin El Abidine El Morjani, Lhoucine Bouchaou, Flood Frequency Analysis and Urban Flood Modelling of Sidi Ifni Basin, Southern Morocco, American Journal of Geographic Information System, Vol. 8 No. 5, 2019, pp. 206-212. doi: 10.5923/j.ajgis.20190805.02.
1. Introduction
Floods result in losses of life and damage properties. Population increase results in more urbanization, more impervious area and less infiltration and greater flood peak and runoff. These issues are exacerbated due to more severe and frequent flooding likely caused by climate change, which amplifies socio-economic damage and population impacts. Flood loss prevention and mitigation includes structural flood control measures such as construction of dams or river dikes and non-structural measures such as improving flood forecasting and warning, flood hazard and risk management, public participation and institutional arrangement, etc. [1]Since the 1990s, there has been a considerable increase in natural disasters related to the floods in Morocco. Human Damage: More than 232,896 people were affected, and more than 1,165 people were killed. Economic loss: more than US $ 295 million [2]. The Sidi-Ifni city (Figure 1) was classified as high risk of flooding [3] and was declared a sinister city by the state during 2014 flood. The city is built on an alluvial plain of a watershed of 704 km2 with a population of 115.691 (PHC, 2016). The climate is arid with an average annual temperature of 19.2°C and an average annual rainfall of 133 mm. The average annual river flow discharge recorded at Sidi-ifni hydrometric station is 0.28 m³/s. The city is growing given its important tourism and fishing opportunities. Assif El Krayma Dam was built in 2012 in order to protect against floods. However, the floods of November 2014 showed these types of structures don’t adequately protect the city from extreme events. The control of flooding therefore involves awareness of the danger, its evaluation and the analysis of its probabilities of occurrence. The floodplain mapping is also an essential step in the fight against natural disasters [4]. For this purpose, a floodplain mapping study for different return periods in the Sidi- Ifni basin was developed. The main objective is accurate delineation of flood extents and depths within the floodplain based on the integration of calibrated hydraulic simulation model with HEC-RAS software, Digital Elevation Model (DEM) and GIS analysis. For hydrological modelling, GIS, especially through their powerful capabilities to process DEM data, have provided modelers with new platforms for data management and visualization [5]. A few leading GIS software vendors in recent years have made extra efforts to improve the analytical and modelling capabilities of their products. Pioneered by HEC-RAS developed by the Army Corps of Engineers [6], several commercial software vendors have developed stand-alone GIS modules with functions that can be used for a variety of hydrological modelling needs. In recent years, high-resolution topographic models have multiplied in several countries to provide the information needed for accurate modelling of flood zones [7].The results of this research could be used for flood mitigation planning, flood insurance studies and sustainable urban development regarding to the historical flood threatens in the study area.
2. Methods and Materials
2.1. Study Area
The Sidi Ifni Watershed in Sidi-Ifni province was selected for this research located in Southern Morocco between 9°50′ W to 10°10′ W longitude and 29°10′ N to 30°00′ N latitude. Figure 1 shows the location of the watershed and the main effluents of the hydrographic network. The length of river is approximately 52 km from the headwater (the Anti-Atlas Mountains) that it flows into the Atlantic Ocean (Figure 1). | Figure 1. Location of study area and the main tributaries of hydrographic network of Sidi-Ifni watershed |
The absence of vegetation cover (on almost the entire basin) and dams specially designed for extreme events generate in the basin very large floods: peak flow is 433, 263 and 862 m3/s in a few days for the great floods of 1985, 2002, and 2015 respectively. The floods flow normally until the confluence with the main section of Sidi Ifni river, then the low slope of the plain (3.5% on the downstream and 43% on the upstream of the basin) greatly limits the flow capacity in the minor bed, large-scale overflows are then produced, causing many damages downstream of the basin (Figure 2).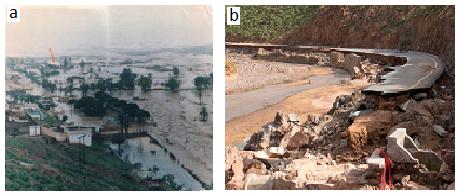 | Figure 2. Flood of 1985 (a) and 2015 in Sidi-Ifni city (b) |
2.2. Methods and Materials
The lack of sophisticated analytical and modelling capabilities was recognized by GIS researchers and hydrologists alike as one of the major deficiencies of GIS technology [8]. Geographical information systems are a tool for geographical Information Science, which will in turn lead to their eventual improvement [9]. The integration of GIS with hydrological modelling was part of these broad research efforts to link spatial analysis and modelling with GIS. Although overlapping with many other GIS modelling efforts in terms of the general methodology [10], the integration of GIS with hydrological modelling has a set of different issues from other kinds of GIS-based environmental modelling [11,12].Then with the increasing use of GIS and digital databases in floodplain mapping and management processes, these alternative approaches may also lend a helpful hand for us to better communicate uncertainties to a wide range of users [13]. The software chosen for modelling is the HEC-RAS software. HEC-RAS is a program that models the hydraulics of water flow through natural rivers and other channels. It is one-dimensional, meaning that there is no direct modelling of the hydraulic effect of cross section shape changes, bends, and other two- and three-dimensional aspects of flow. It is also “good enough” for floodplain flow/ flood mapping [14].HEC-RAS can also be used in the GIS program ArcGIS (With 3-D analyst and Spatial Analyst extensions). Cross sections and geometric data for HEC-RAS are prepared in the Geo-RAS extension, for use in HEC-RAS and can be used to export water surface data from HEC-RAS back into ArcGis to create flood maps with depths and extents of flooding.The methodology involved in the integration of GIS and HEC-RAS flood simulation models is shown in the figure 3.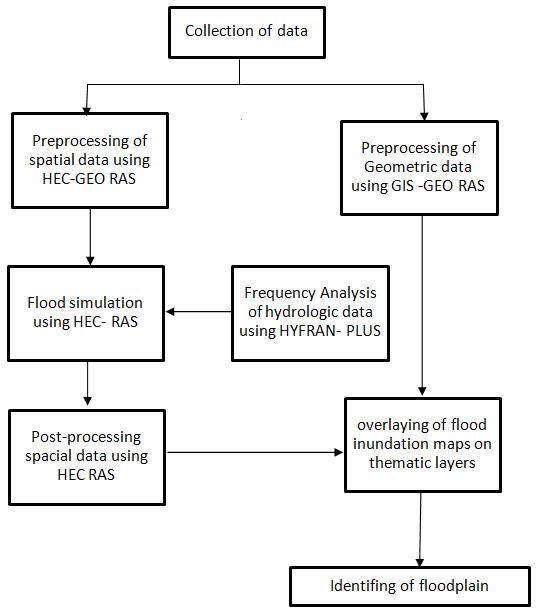 | Figure 3. Chart showing the process involved in the methodology |
2.3. Dada and Methodology
Annual peak flow data along with the following GIS data was used in this study: cross sections, physical properties of the river system and Digital Elevation Model (DEM) with 12.5m have been collected from data portal for remotely sensed imagery of the Earth [15]. Peak flow data recorded at Sidi-Ifni hydrometric station, located in upstream of the selected reach was used for this study. The length of data set is 44 years from 1979-80 to 2014-15 water years.The basic computational procedure is based on the solution of the one-dimensional energy equation, in which energy losses are evaluated by friction and contraction or expansion in river cross sections. Water surface profiles computation is based on solving the energy equation from one cross section to the next using an interactive procedure called the standard step method [6]. The Energy equation is written as follows: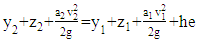 | (1) |
Where,y1 and y2 are depth of water at two adjacent cross sectionsz1 and z2 are elevation of the main channel beds;v1 and v2 are average velocities;a1 and a2 are velocity weighting coefficients;g is gravitational acceleration and he is energy head loss between two cross sections.Cross sectional geometry of channel, river system schematic, ineffective flow areas, reach lengths, energy loss and Manning’s coefficient and steady flow input are the basic data requirements for water surface simulations [16].Model sets:The modelling of the hydrographic network of Sidi Ifni River concerned only the selected reach section that collects runoff water all over the watershed and which is located east of the urbanized center of Sidi-Ifni city. Given the relatively short length of this section (52 km) combined with the fact that we are interested only in the maximum elevation of the water line for a given chronic stream of extreme flows, the one-dimensional modelling steady flow is sufficient.• Boundary conditions: discharges measured during recorded historical events and observed water depth were used as boundary conditions; • Manning coefficient: Manning’s n roughness coefficient depends on channel material, surface irregularities, variation in shape and size of cross sections, vegetation and flow condition, channel obstruction, and degree of meandering. Manning’s value was chosen from well-known literatures and observation of Souss Massa Basin Hydraulic Agency [17]. The terrain is non-developed, non-rocky, with medium-slope and natural stream channel. The vegetation is very sparse. For theses raisons the manning coefficient was chosen uniformly: n= 0.035 (s / [m1 / 3]);• Calibration of the model: High degree of uncertainty exists in floodplain-mapping models due to complexity of the surface water level modelling processes including the structure of the model, topography, parameters and data. As a result, calibration of a river hydraulic model is a necessary stage in floodplain zoning [16]. For this purpose, three flows were simulated, 10-year, 50-years and 100-year. These flows were assessed from a frequency analysis of the only gauging station data (Sidi-Ifni station). The statistical treatment of the maximum daily precipitation and using different empirical equations (Gumbel, Normal, Log Normal III), has resulted in the calculation of the peak flow for different return periods. The calibration of the model was based on the latest extreme event of 2015. The results of differences between observed and simulated water level can be either obtained from HECGeoRAS outputs using GIS spatial capabilities or extracted from maps to conduct a quantitative comparison. In order to reach an optimal calibrated coefficients, the model performance with different sets of Manning roughness coefficients chosen from a wide range, are compared to observed spatial inundation data. Simulations are grouped into runs; with each run applying to a slight change apply to coefficient [16]. All cross sections were then parameterized with uniform Manning “n” values in main channels and floodplains. An acceptable match between the observed and simulated flood water depth is achieved (figure 4).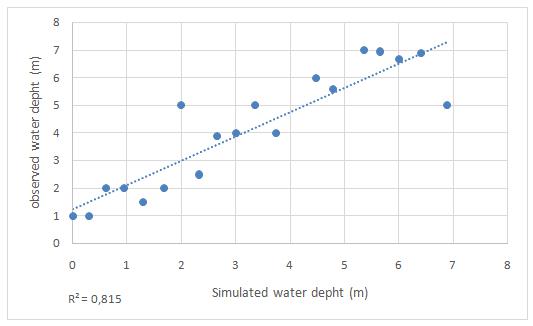 | Figure 4. Comparison of flood water depth between the result of calibrated model and observations for 2015 flood event |
3. Results and Discussion
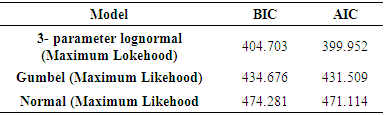
Flood frequency analysis (using HYFRAN –Plus software) was conducted to select the most accurate input for the hydraulic simulation of the river reach. It has shown that Gumbel, Log- Normal III and Normal are the best statistical distributions to estimate peak flow in different return periods. Figure 5 shows the results between observed and estimated annual peak discharge.To discriminate the different adjustments, two criteria were used:• Akaike Information Criterion (AIC)• Bayesian Information Criterion (BIC).The equations (2) and (3) of the two criteria are written as follow [18]:  | (2) |
 | (3) |
Where, LogLik represents the log-likelihood of the parameters associated with data, K is the number of independent parameters in the model, and N is the number of individuals in the sample. These two criteria used consecutively (AIC then BIC) make it possible to build a classification of statistical models taking into account the principle of parsimony (Table 1). The best adjustments correspond to the lowest values of these criteria [19].Table 1. Classification of statistical models using AIC/ BIC criteria
 |
| |
|
This result is also confirmed on the graph of the Log Normal III (Figure 5). 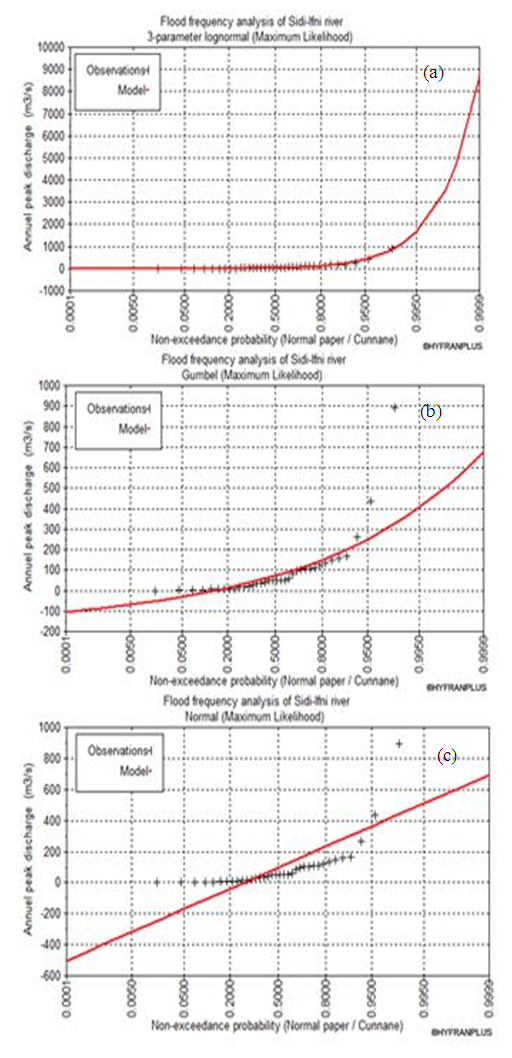 | Figure 5. Flood frequency analysis using three empirical equations: a. Log Normal III, b. Gumbel, c. Normal |
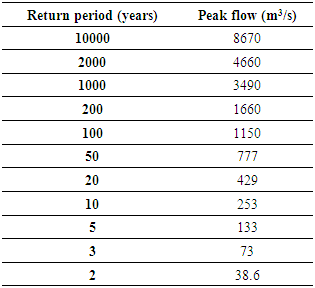
Table 2 has shown magnitude of peak flow for 2 to 10,000-year return periods at Sidi-Ifni hydrometric station.The peak flow of the extreme events that occurred in 1985, 2002 and 2015 in Sidi-Ifni River recorded respectively 433 m³/s (6.12 m water depth), 263 m³/s (5m water depth) and 891 m³/s (7 m water depth) based on field observations. The results of the simulation in Table 2 have shown that the return period of the observed floods 1985, 2002 and 2015 is respectively about 20-year, 10-year and 50-year.Table 2. Peak flow rates for 2 to 10000 year return periods at Sidi-Ifni hydrometric station
 |
| |
|
The validation of the HEC-RAS model can be ensured by a visual comparison with photographs taken during the 2015 flood event by the hydraulic agency or the population. Figure 6 and figure 7 (a) obtained from HEC-RAS simulations depict the extent and depth grid of inundation occurred during the flood of 2015 magnitude (a 50-year flood magnitude). The HEC-RAS model has generated similar inundation patterns, which are close to the real situation in 2015 (figures 7 (b), 7 (c) and 7 (d)). The simulated water depth is 6.88 m.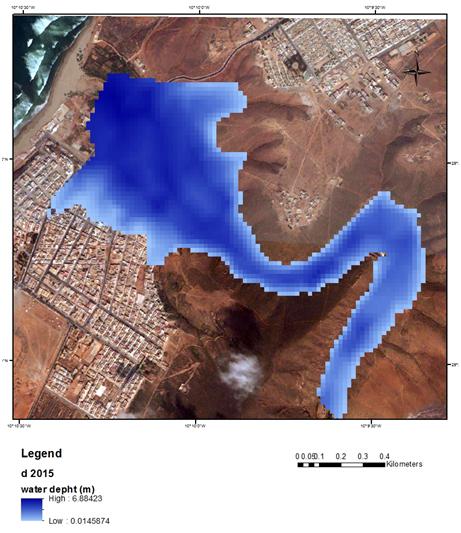 | Figure 6. Flood waters depth and flooded areas simulated by HEC-RAS model for 2015 flood event in Sidi-Ifni river |
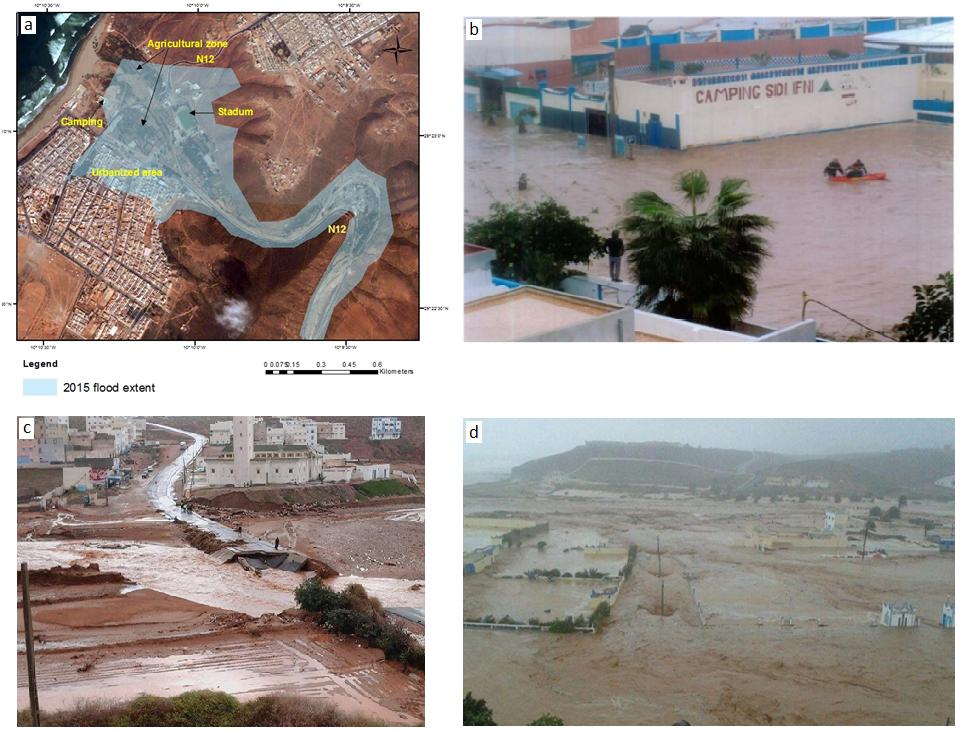 | Figure 7. a. Spatial extent of 2015 flood water from HEC RAS simulation, b.2015 Inundation at Sidi-Ifni camping, c. N 12 National road, d. Inundation at camping and agriculture area |
Following the calculation of the return periods relative to the observed floods and the economic development that the city of Sidi-Ifni is currently experiencing, this research reconstructed 10-year and 100-year flood events. The results (figure 8 and 9) have shown a lateral overflow of the decadal and centennial floods that reached both banks of Sidi-Ifni river and submerged: the agricultural zone, part of the urban area, and the national road (N12). We can see how the maximum water depth is 6.78 meters for Q10, and 6.96 meters for Q100.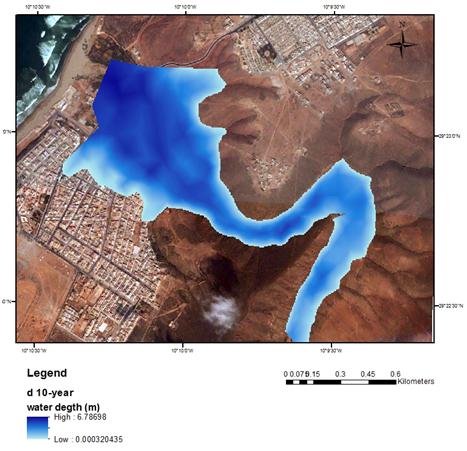 | Figure 8. Flood waters depth and flooded areas simulated by HEC-RAS model for 10-year flood event in Sidi-Ifni river |
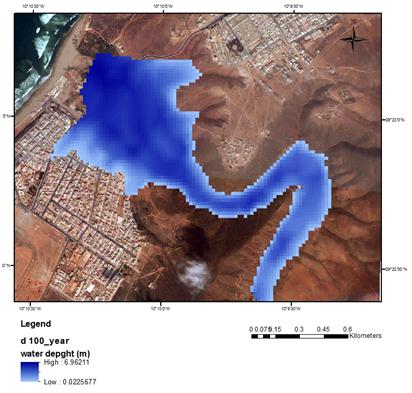 | Figure 9. Flood waters depth and flooded areas simulated by HEC-RAS model for 100-year flood event in Sidi-Ifni river |
For a river of 0.28 m3/ s of interannual flow (1979-2015), the decadal and centennial floods reach respectively 253 m3/s and 1150 m3/s. These are very high peak flows for a catchment area of 704 km² and present a large hydrological risk. Many facilities against these predictive floods can be proposed: construction of a retaining wall of 793 m to protect the urbanized zone and the agricultural zone, reconstruction of 2 bridges on N12 road (Figure 10), and construction of a dam upstream of the basin. The dam will be used for capping and rolling of the 100-year flood with a discharge of 10- year. The restriction of the development of the valley by prohibiting new constructions and establishment of a flood warning system could be applied as non-structural measures.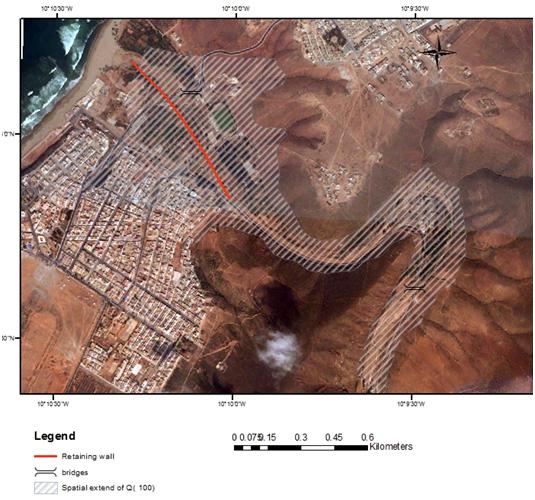 | Figure 10. Proposed protection measure against floods in the Sidi-Ifni basin |
4. Conclusions
Application of hydraulic modeling using GIS capabilities provides a platform to simulate flood water depth and inundated flood areas in different part of the floodplain [20]. After the validation of the model based on historical events in the city of Sidi-ifni, predictive modeling using statistical discharge values was undertaken along 52 km of the Sidi-Ifni River. The combination of Arc-GIS and HEC-RAS 1-D flood simulation model indicate the capability of simulating flood events and spatially depicting the degree of exposure of the region towards a hazard event in terms of inundation extent and depth of water levels of 10-year and 100-year magnitude. This research investigated the possibility of calibrating and validating hydraulic model by using only one observed flood event with limited data observations and even with no available concurrent satellite-derived data sets. It is noticeable that many operational flood inundation predictions are made in situations when the observation data to calibrate and validate the model performance are limited [21], [22].This experience suggests that there will be some degree of uncertainty in reproducing both flood extent boundary and flood water depths [23], [24] especially when predictions tend to be used for flood mitigation purposes in residential areas. The calibration of the model has shown a significant correlation between observed and simulated floodwater depths. It strongly suggests the need for more research into methods for validation of this hydraulic model with very with a good satellites imagery, although the overall calibration results are encouraging and acceptable. Results of this study can reasonably specify high flood risk from low flood risk areas in the floodplain and measures to mitigate future flood damages.These results showed that the hundred-year flood could invade critical areas such as urban zone, agricultural zone, the national road (N12) that connects the city of Sidi-Ifni to other cities. They reveal the necessity of integrating system generated information in the decision making process in order to make informed choices. The authority concerned can apply the structural and non-structural proposed measures for a better economic and social development of the Sidi-Ifni city.
ACKNOWLEDGEMENTS
This work was supported by the Morroccan-American commission for Educational and Cultural Exchange under “Fulbright post-doctoral research grant”. The authors are very grateful to Souss Massa Hydraulic Agency (Morocco) for data and to the University Of Georgia (USA) for helping support this research.
References
| [1] | Tingsanchali, T. 2012. Urban flood disaster management. Procedia Engineering, no.32 (Elsevier): 25 – 37. doi:10.1016/j.proeng.2012.01.1233J. Breckling, Ed. The Analysis of Directional Time Series: Applications to Wind Speed and Direction, ser. Lecture Notes in Statistics. Berlin, Germany: Springer, 1989, vol. 61. |
| [2] | El Morjani Z.E.A., Seif Ennasr M., Elmouden A., Idbraim S., Bouaakaz B. and Saad A. (2016). Flood Hazard Mapping and Modeling Using GIS Applied to the Souss River Watershed. In: Choukr‐Allah R., Ragab R., Bouchaou L., Barceló D. (eds) The Souss‐Massa River Basin, Morocco. The Handbook of Environmental Chemistry, vol 53. Springer, Cham. https://doi.org/10.1007/698_2016_69. |
| [3] | Ben Abdelfadel, A. 2016. Plan de protection contre les inondations au Maroc [Flood Protection Plan In Morocco]. Project Report. |
| [4] | El Alaoui El Fels A. and El Mehdi Saidi M. 2014. Simulation et spatialisation du risque d’inondation dans une vallée anthropisée. Le cas de la vallée de l’Ourika (haut atlas, Maroc) [Simulation and spatialization of flood risk in an anthropised valley. The case of the Ourika Valley (High Atlas, Morocco)]. European Scientific Journal, 10 (17): 223-236. |
| [5] | Sui D.Z., and Maggio R.C. 1999. Integrating GIS with hydrological modeling: practices, problems, and prospects. Computers, Environment and Urban Systems Journal 23 (1): 33-51. doi.org/10.1016/S0198-9715 (98)00052-0. |
| [6] | Hydrologic Engineering Center (HEC) 2010. HEC-RAS river analysis system. Hydraulic Reference Manual (version: 4.1), U.S. Army Corps of Engineering, Davis, CA, January, pp: 262. |
| [7] | Detrembleur, S. 2008. Modélisation numérique et gestion du risque inondation en milieu urbain sur base de modèles topographiques à haute resolution [Numerical modeling and flood risk management in urban areas based on high resolution topographic models]. Paper presented at 3e journées doctorales en hydrologie urbaine 14-15 octobre 2008. http://hdl.handle.net/2268/35259. |
| [8] | Wilson, J. P. 1996. GIS-base land surface/subsurface modeling: New potential for new models? Paper presented at the 3rd International Conference on GIS and Environmental Modeling, Santa Fe, NM. http://bbq.ncgia.ucsb.edu:80. |
| [9] | Goodchild, M. F. 1992. Geographical information science. International Journal of Geographical Information Systems, 6 (1): 31-45. |
| [10] | Sui, D. Z. 1998. GIS-based urban modeling: Practices, problems, and prospects. International Journal of Geographic Information Sciences, 12 (7): 651-671. |
| [11] | Goodchild, M. F., Parks, B. O., and Steyaert, L. T. (Eds.). 1993. Environmental modeling with GIS. New York: Oxford University Press. |
| [12] | Goodchild, M. F., Parks, B. O., and Steyaert, L. T. (Eds.) 1996. GIS and environmental modeling: Progress and research issues. New York: Oxford University Press. |
| [13] | Sui D.Z., and Maggio R.C. 1999. Integrating GIS with hydrological modeling: practices, problems, and prospects. Computers, Environment and Urban Systems Journal 23 (1): 33-51. doi.org/10.1016/S0198-9715(98)00052-0. |
| [14] | Wicks J. 2016. What is 1D/2D flood modeling? Flood modeller suite webinar. http://ch2m.com/floodmodeller. |
| [15] | ASF DAAC (Alaska Satellite Facility Distributed Active Archive Center) 2017. Dataset: ALOSPALSAR_Radiometric_Terrain_Corrected_hight_res; Includes Material © JAXA/METI 2007. Accessed through ASF DAAC August 09 2017. DOI: 10.5067/Z97HFCNKR6VA. |
| [16] | Ghanbarpour, M. R., Salimi, S, Saravi, M. M. and Zarei M. 2011. Calibration of River Hydraulic Model Combined with GIS Analysis using Ground-Based Observation Data. Research Journal of Applied Sciences, Engineering and Technology 3(5): 456-463. |
| [17] | Souss Massa Basin Hydraulic Agency (SMBH) 2008. Étude de protection contre les inondations du chef-lieu de la commune rurale de Sidi Hmad Oumoussa et de la ville de Sidi Ifni Province de TIZNIT. [Flood protection study of the head of the rural commune of Sidi Hmad Oumoussa and the city of Sidi Ifni Province of Tiznit ]. p17. Technical report. |
| [18] | El Alaoui El Fels A. and El Mehdi Saidi M. 2014. Simulation et spatialisation du risque d’inondation dans une vallée anthropisée. Le cas de la vallée de l’Ourika (haut atlas, Maroc) [Simulation and spatialization of flood risk in an anthropised valley. The case of the Ourika Valley (High Atlas, Morocco)]. European Scientific Journal, 10 (17): 223-236. |
| [19] | Ehsanzadeh, E., El Adlouni, S., Bobée, B. 2010. Frequency analysis incorporating a Decision Support System (DSS) for hydro-climatic variables. Journal of Hydrologic Engineering, 15 (11): 861-881. https://doi.org/10.1061/_ASCE_HE.1943-5584.0000261. |
| [20] | Correia, F.N., Saraiva, M.D.G., Silva, F.U.D. and Ramos. 1999. Floodplain management in urban developing areas. Part II. GIS-based flood analysis and urban growth modeling. Water Resources Management Journal, 13 (1): 23-37. https://doi.org/10.1023/A:1008045419517. |
| [21] | Beven, K.J., 2002. Towards a coherent philosophy formodelling theenvironment. P. Roy. Soc. Lond. AMat., 458(2026): 2465–2484. |
| [22] | Pappenberger, F., K. Beven, M. Horritt and S. Blazkova, 2005. Uncertainty in the calibration of effective roughness parameters in HEC-RAS using inundation and downstream level observations. J. Hydrol., 302(1-4): 46-69. |
| [23] | Horritt, M.S., 2006. A methodology for the validation of uncertain flood inundation models. J. Hydrol., 326:153-165. |
| [24] | Di Baldassarre, G., G. Schumann and P.D. Bates, 2009. Atechnique for the calibration of hydraulic modelsusing uncertain satellite observations of flood extent.J. Hydrol., 367: 276-282. |

 Abstract
 Reference
 Full-Text PDF
 Full-text HTML