-
Paper Information
- Paper Submission
-
Journal Information
- About This Journal
- Editorial Board
- Current Issue
- Archive
- Author Guidelines
- Contact Us
American Journal of Geographic Information System
p-ISSN: 2163-1131 e-ISSN: 2163-114X
2019; 8(4): 141-157
doi:10.5923/j.ajgis.20190804.01

Integrated Remote sensing and GIS-based Universal Soil Loss Equation for Soil Erosion Estimation in the Megech River Catchment, Tana Lake Sub-basin, Northwestern Ethiopia
 Abstract
 Reference
 Full-Text PDF
 Full-text HTML
Veeranarayana Balabathina1, Raju R. P.2, Wuletaw Mulualem1
1Department of Geology, College of Natural and Computational Sciences, University of Gondar, Gondar, Ethiopia
2Department of Environmental and Occupational Health and Safety, Institute of Public Health, College of Medicine and Health Sciences, University of Gondar, Gondar, Ethiopia
Correspondence to: Veeranarayana Balabathina, Department of Geology, College of Natural and Computational Sciences, University of Gondar, Gondar, Ethiopia.
| Email: |  |
Copyright © 2019 The Author(s). Published by Scientific & Academic Publishing.
This work is licensed under the Creative Commons Attribution International License (CC BY).
http://creativecommons.org/licenses/by/4.0/

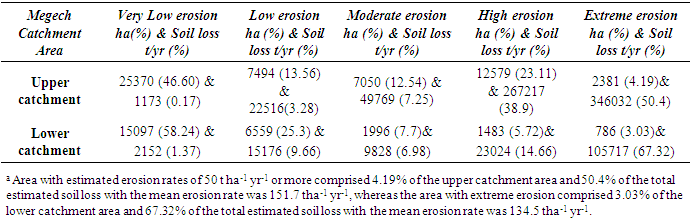
Severe land degradation occurred in northern highlands of Ethiopia due to its complex topography, rainfall, and various anthropogenic activities. Soil erosion in the Megech river catchment, one of the major catchments of Lake Tana sub-basin of the Abbay River basin using Remote sensing, and GIS based Universal Soil Loss Equation (USLE) was quantified. The study was conducted by estimating the important factors that affect soil erosion namely, rainfall erosivity (R), topography (LS), soil erodibility (K), cropping management practice (C), and support practice (P). The results showed that the annual soil loss in the total catchment is 8,43,736 tons with an average soil erosion rate of 41.54±75.92 tons ha-1yr-1 of which the soil loss from the upper catchment is 6,86,705 tons (36.63±64.2 tons ha-1yr-1) while from the lower catchment 1,57,031 tons (32.68±57.41 tons ha-1yr-1). In 3.1% of the total catchment area the soil erosion is extreme with the rate greater than 50 tons ha-1yr-1; in 20.5% of the area it is greater than 10 tons ha-1 yr-1; and in 50.5% of the area it is very low, less than 1 ton ha-1yr-1. Soil erosion rates varied from various land uses in a given topographic condition, and from a particular land use type in different topographic conditions. Soil conservation- neglected post-harvested land is eroded by small rainfall intensities. Substantial soil erosion occurs from degraded lands and decreased vegetative covers. Implementation of scientific measures of land use management, agriculture, and restoration of degraded lands would control soil erosion.
Keywords: Soil erosion, Megech river catchment, Ethiopia, Universal Soil Loss Equation, Remote sensing, Geographical Information System
Cite this paper: Veeranarayana Balabathina, Raju R. P., Wuletaw Mulualem, Integrated Remote sensing and GIS-based Universal Soil Loss Equation for Soil Erosion Estimation in the Megech River Catchment, Tana Lake Sub-basin, Northwestern Ethiopia, American Journal of Geographic Information System, Vol. 8 No. 4, 2019, pp. 141-157. doi: 10.5923/j.ajgis.20190804.01.
Article Outline
1. Introduction
- Soil erosion and degradation of land resources are very significant problems in many countries. Land degradation is the most serious growing threat to food production, food security, and natural resource conservation, particularly for the poor and vulnerable population in the dry lands of developing countries in Africa and Asia and consequently to global security since it has been seriously threatening people’s livelihoods, soils and landscapes [1,2]. Land degradation is defined as the loss of production capacity of land in terms of loss of soil fertility, soil biodiversity, and degradation of natural resources [3] that have put the world’s ecosystems under intense pressure [4]. Globally, about 2 billion hectares were already degraded, and the average rates of soil erosion were estimated between 12 and 15 tons ha-1yr-1 [5]. Land degradation is caused by soil water erosion (46%), wind erosion (36%), loss of nutrients (9%), physical deterioration (4%), salinization (3%) [6], and in rural areas by overgrazing (49%), agricultural activities (24%), deforestation (14%), and overexploitation of vegetative cover (13%) [7].Ethiopia experienced moderate to severe land degradation problems. Very severe degradation occurred in northern Ethiopia [8]. Soil erosion is one of the most dangerous hazards in high land regions. In the highland areas of north Gondar district in Amhara region, soil erosion rates mainly depend on the intense rainfalls, erodible soils, topography, slope gradient, land use types etc. Excessive soil erosion with a resultant high rate of sedimentation in the reservoirs and decreased soil fertility has become solemn environmental problem for the country with disastrous economic consequences. The estimated total mean annual sediment load in the Megech reservoir in north Gondar was 496,066 tons that corresponds to 1,170 tons km-2 yr-1 [9]. A quantitative assessment is needed to infer on the extent and magnitude of soil erosion problems so that sound management strategies can be developed on a regional basis with the help of field measurements [10]. Researchers have developed many tools for estimating soil loss, such as the Soil and Water Assessment Tool (SWAT), the Water Erosion Prediction Project (WEPP), the Universal Soil Loss Equation (USLE), the Revised Universal Soil Loss Equation (RUSLE), etc. [11]. Among them, USLE is widely used for the study of soil erosion by water because of its simplicity, despite some inconveniences due to its extensive requirement for input data [12,13]. The USLE method predicts the long term average annual rate of erosion on a field-based rainfall pattern, soil type, topography, crop system and management practices. The major purpose of the soil loss equation is to guide methodical decision making in conservation planning on a site basis. Using conventional methods to assess soil erosion risk is expensive and time consuming. Hunri (1985) [14] conducted conventional study on soil erosion for the highest areas in Ethiopia focusing on various soil erosion factors. The integration of existing soil erosion models, field data and data provided by remote sensing (RS) technologies through the use of geographic information systems (GIS) appears to be an asset for further studies [15-17]. Recently developed RUSLE that has a similar structure as that of the USLE contains several improvements in identifying input factors based on the updated database in the United States. We chose the USLE model due to its wider use, relative simplicity to assess soil loss, and most importantly its easiness to compare with other studies on soil erosion in various river catchment areas. RS and GIS are capable of handling easily and efficiently large amount of spatial data. For this reason, many researchers use GIS as main approach to estimate soil erosion at all scales. Therefore, this study, conducted in the Megech river catchment area, aims to utilize the USLE model with RS and Arc GIS to determine the soil erosion rates.
2. The Study Area
- The Megech River is one of the major river catchments of Lake Tana sub-basin of the Abbay River, a major river basin in Ethiopia. The Megech river and its tributaries namely Angereb, Shinta, Keha, Dimaza, Gilgel Megech, and Wizaba that rise on the Ethiopian highlands in North Gondar in Amhara region are concentrated at elevations of 3000 meters mean above sea level (m.a.s.l.) having a high and perennial, but highly seasonal in their runoff (Figure 1). The upper and lower catchment areas of Megech River encompass about 80757 ha with an annual runoff of 350×106 m3 which is half of the total northern river catchments of Lake Tana including Garno, Arno, Dirma, and Gabi Kura rivers. [18]. A well developed dendritic drainage pattern is observed at the area with a chain of ridges bordering the catchment area (Figure 2). The elevation of the total catchment area fluctuates from 1755 m to 2974 m m.a.s.l. and decreases from north to south. The upper river catchment area is not flat like the lower one but very broken and hilly ragged terrain containing grassy uplands, swamp valleys, scattered vegetation, and occasional rocky peaks which are of volcanic origin consisting of varied range of altitudes (Figure 3). The upper catchment area fluctuates from 1900 m to 2974 m m.a.s.l., whereas it decreases from the north to south to 1755 m m.a.s.l. Slope of the terrain is complex and varies from nearly level to very steep slope with a range of 0.3° to 63°. The northern part of the catchment area has a characteristic of gentle to very steep slope, while the southern part has gentle slopes and plain surfaces that are mostly near the outlet of the Megech River to Lake Tana.
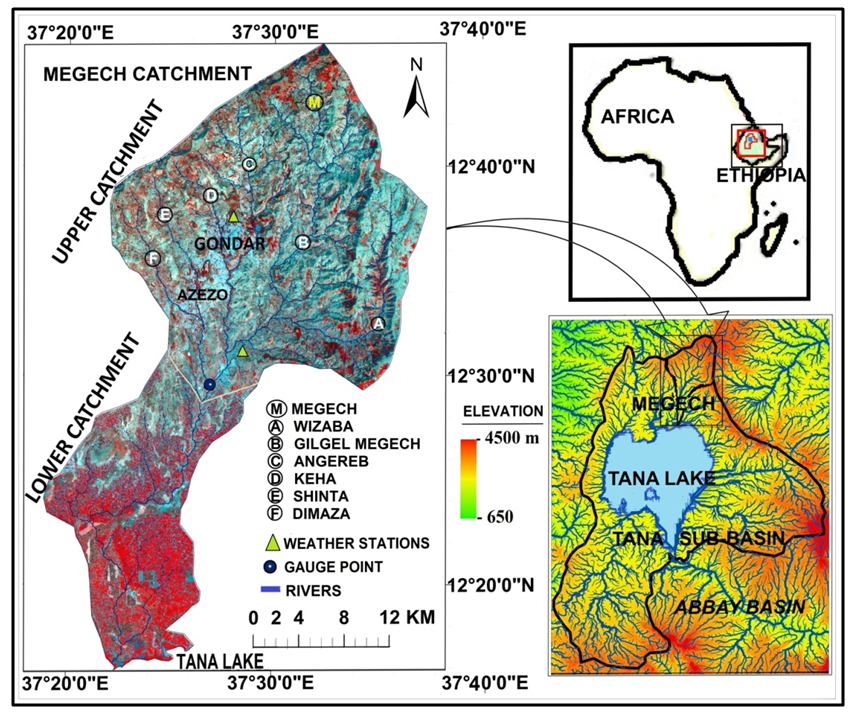 | Figure 1. Location of the study area |
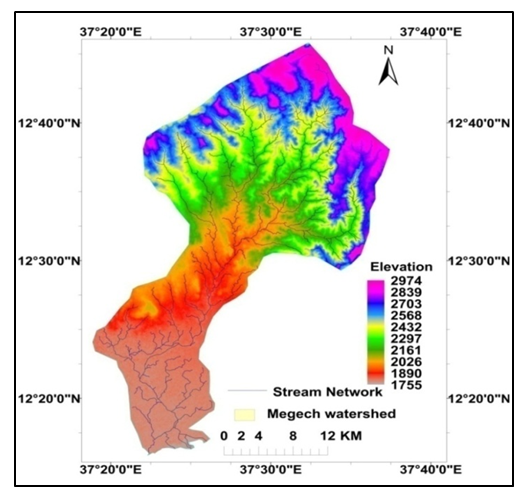 | Figure 2. Stream network of the River Megech catchment |
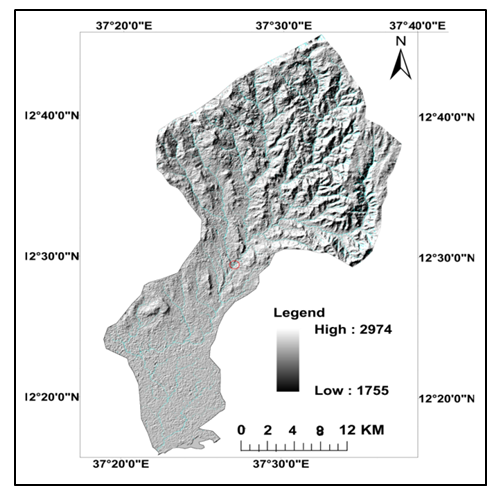 | Figure 3. Terrain and flow direction of the Megech catchment |
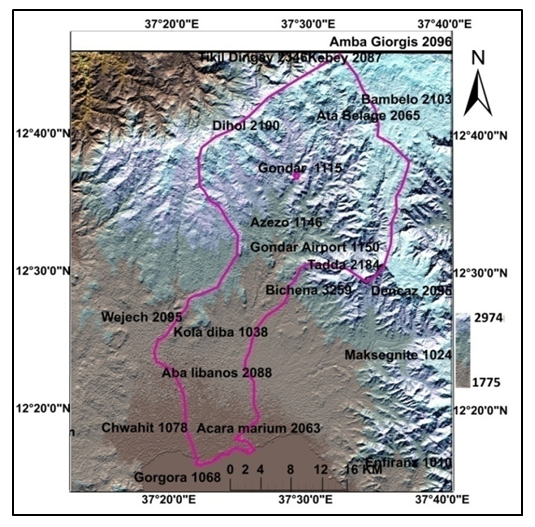 | Figure 4. Rainfall Stations and Annual Average Rainfall (mm) |
3. Methods
3.1. Universal Soil Loss Equation (USEL)
- The USLE is an erosion model designed to compute longtime average soil losses in runoff from sheet and rill erosion under specified conditions [23]. It was applied in many areas worldwide. It calculates erosion as a product of five factors: rainfall erosivity, soil erodibility, slope length and steepness, land cover and management, and support practice, and the resources for identifying their values are rainfall, soil properties, terrain data and, land use. The soil loss equation is:
 | (1) |
3.1.1. Rainfall Erosivity Factor (R)
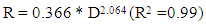
- R-factor is an index of rainfall erosivity that estimates the erosive forces of the rainfall and its directly associated runoff. Rainfall erosivity (R) is defined as the product of total storm kinetic energy (E) times the maximum 30-minute rainfall intensity (I30) for a given rain storm, (EI30) (Wischmeier & Smith 1978) [23]. According to the definition, the detailed continuous precipitation data with 30-minute time resolution and the rainfall kinetic energy measurement that derived from drop-size, drop-velocity, and drop-volume measurements as well as drop-size distribution are required to calculate the R-factor. Moreover, the calculation of R-factor is a complex process and, data on the nature of the distribution of those sizes and intensities of the individual rainstorms are rarely available. However, there are other methods suggested by various researchers to calculate the annual R-factor. Hurni (1985) developed a method of USLE adapted for Ethiopian conditions to measure R-factor based on mean annual precipitation by analyzing the rainfall data as given in the following equation:
 | (2) |
 | (3) |
 | (4) |
 = the monthly rainfall depth (mm) in i month, and p = the annual rainfall (mm).
 | (5) |
 | (6) |
 | (7) |
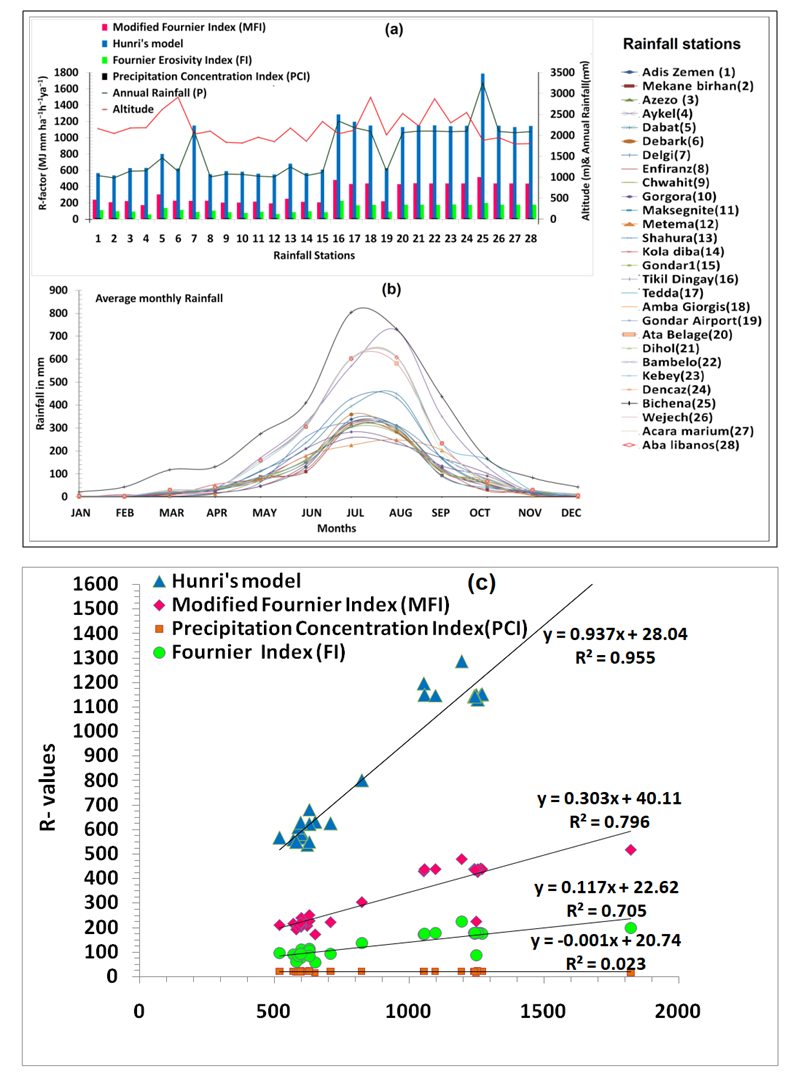 | Figure 5. a. Rainfall erosivity (R); and b. monthly average rainfall at 28 stations in and around Megech River catchment; c. Correlation of R-values between Derge’s power-law and other methods |
3.1.2. Soil Erodibility Factor (K)
- The soil erodibility factor, K, is the rate of soil loss per rainfall erosivity for a specified soil, which reflects the combined effect of all the soil properties and soil profile characteristics. K-factor in the soil loss equation is experimentally determined quantitative value. Measurement of the K-factor requires several physical parameters for each soil type such as soil texture, soil organic matter, percent of sand, silt, and clay in the soil, soil structure code, and profile permeability. Therefore, K is one of the most challenging factors, requiring substantial time, cost, resources, field surveys, and analyses [28]. Hurni, (1985) used methods of Bono & Sheiler (1984) and Weigel (1985) [29,30] to estimate K-factor values based on the color for soils in Ethiopia. However, in the current study, the K is estimated based on soil texture and organic material content. This relationship was used by many researchers to estimate K values for their soil samples [31]. The soil information for our study was obtained from the Harmonized World Soil Database (HWSD) v.1.21. (2013) [32], jointly developed by Food and Agriculture Organization of the United Nations (FAO), International Institute for Applied Systems Analysis (IIASA), ISRIC-World Soil Information, the European Soil Bureau Network, and the Institute of Soil Science, China. The percentage of organic material was estimated by multiplication of organic carbon with a factor value 1.72. The mean K-values were obtained based on percentage organic material in association with the sand, silt and clay percentage of soil composition by using the United States Department of Agriculture (USDA) [33] soil textural class fields at <2 and ≥2 organic matter values. The K values, soil type and soil classes were derived for the present study site by following the above procedure.
3.1.3. Topographic Factor (LS)
- Topographic factor (LS) is the slope length gradient that reflects the effect of the topography on erosion rates. Both the length and the steepness of the land slope substantially affect the rate of soil erosion by overland flow particularly in complex terrain areas. Many researchers agree that the amount of land lost depends on the three-dimensional distribution of the terrain [34,35]. Various methods have been devised to calculate the LS for topographically complex terrain that requires high resolution Digital Elevation Model (DEM) data. In the present study, we calculated the combined LS factor using the DEM data extracted from Advanced Space-borne Thermal Emission and Reflection Radiometer (ASTER) Global Digital Elevation Model Version 2 (GDEM V2), 2011 with a spatial resolution of 30 m following an approach developed by Mitasova et al. (1996) [34]:
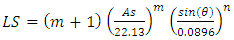 | (6) |
 | (7) |
3.1.4. Cropping Management Factor (C)
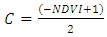
- Cropping management factor (C) reflects the effect of cropping and management practices on the soil erosion rate. The vegetation cover and management factor is the ratio of soil loss from an area with specified vegetation cover and its management to the soil loss from an identical area in tilled continuous fallow. Remote sensing technology provides a lot of information about the land surface through the Normalized Difference Vegetation Index (NDVI) which is positively correlated with the amount of green biomass and gives an indication of differences in green vegetation coverage [38]. Time series Landsat-8 imageries data in January, April, June, September and December of year 2018 with a spatial resolution of 30 m (path 170; row 51) as given in Table were used for our study to calculate NDVI, an index of vegetation abundance. These months were chosen to maximize the ability to distinguish agricultural land from natural vegetative covers. A significant proportion of noises were normalized by converting the digital number (DN) to at-satellite reflectance value. The DNs of NIR and RED bands for Landsat-8 were converted into reflectance by the following equation:
 | (8) |
 is true top of atmosphere (TOA) planetary reflectance,
 is TOA planetary spectral reflectance, and
 is solar elevation angle (in Radians).
 is obtained by the following formula:
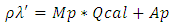 where,Mp is reflectance multiplicative scaling factor for the band,Qcal is level one pixel value in DN, andAp is reflectance additive scaling factor for the band.The spectral reflectance of NIR and RED bands were used to calculate NDVI for each image with the following equation:
 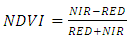 | (9) |
 | (10) |
|
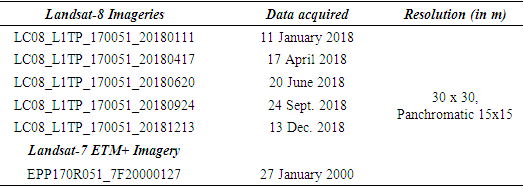
 | Figure 6. Average Normalized Difference Vegetation Index (NDVI) for Megech River catchment |
3.1.5. Support Practice Factor (P)
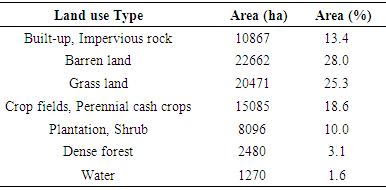
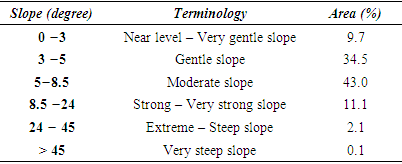
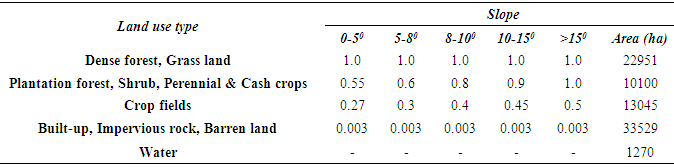
- The support practice factor (P) represents erosion prevention practices to reduce the amount of soil erosion. P is defined as the ratio of soil loss with support practices like contouring, strip cropping, or terracing to the soil loss with the practice of straight-row farming up and down the slope. If there are no conservation practices, then the P-value should be 1.0. Determining the P-value is difficult as it requires direct and long-term field observations of specific land use types and farming practices at several places in the catchment area that are time-consuming and involve high finances. However, in order to overcome the constraints of more time and money, the P-values can be derived from either image classifications using remote sensing data, previous studies, or even expert knowledge [40]. Many researchers use the information of slope inclination or farming practices to calculate P-values. In the present study, the P-value is determined by the slope based on land use map. The land use map of year 2018 was generated from the pan sharpened Landsat-8 image with a resolution of 15 m (Figure 7). The areas of various land use types were given in Table 2. Inseparability of contiguous land features result in poor accuracy in unsupervised and supervised classifications due to spectral and spatial resemblances in VIS and NIR bands. Thus, spectral response of different surface features from all bands of Landsat image was analyzed. In addition, the Google earth data were used to confirm the type of land feature in generation of land use map. The researchers focused on identifying the land cover types in areas that presented problematic spectral signatures in the unsupervised classes (e.g., sparsely vegetated, lava flows, and emerging row crops). Table 3 shows the result of the accuracy and error matrix estimations for such land use classification. Figure 8 and Table 4 show various degrees of slope categories in the Megech catchment.
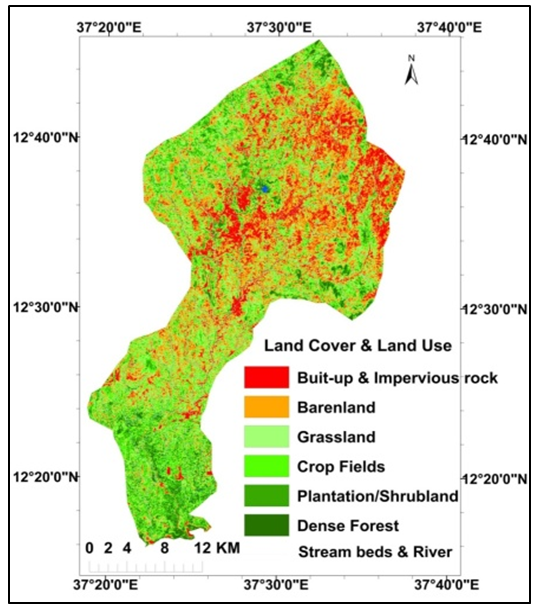 | Figure 7. Land Cover and Land Use |
|
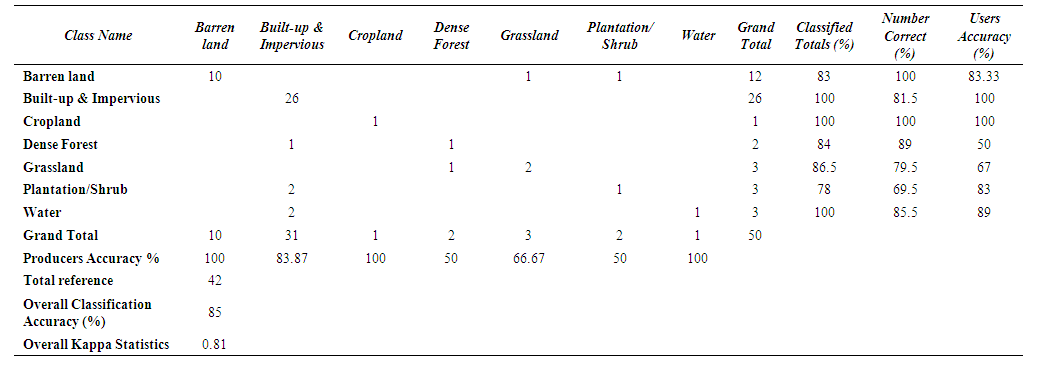 | Table 3. Accuracy and error matrix estimations |
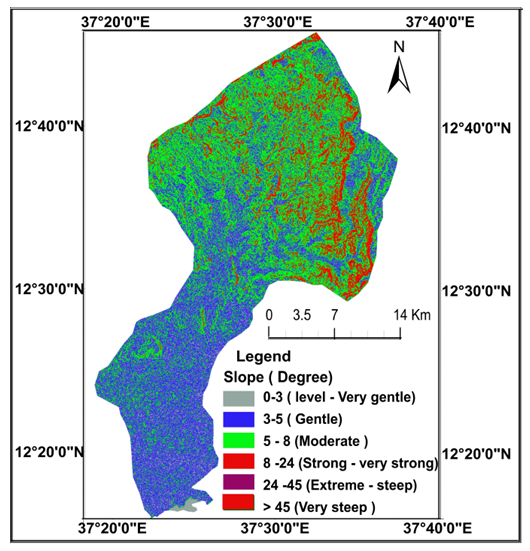 | Figure 8. Slope in the Megech River Catchment |
|
3.1.6. Stream Power Index (SPI)
- SPI is a measure of the erosive power of flowing water. SPI is calculated based upon slope gradient and contributing area [41]. As catchment area and slope gradient increase, the amount of water contributed by upslope areas and the velocity of water flow increase, and hence the SPI and the erosion risk increase. SPI can be used to describe the potential flow erosion at the given point of the topographic surface and approximate the locations where gullies are most likely to form, and to identify suitable locations for soil conservation measures to reduce the effect of concentrated surface runoff. High SPI values represent locations vulnerability to gully erosion on the landscape where very steep slopes and flow accumulations exist. For this reason, SPI is very useful for determining potential critical source area locations. SPI is calculated using the following equation:
 | (11) |
3.1.7. Descriptive Statistics
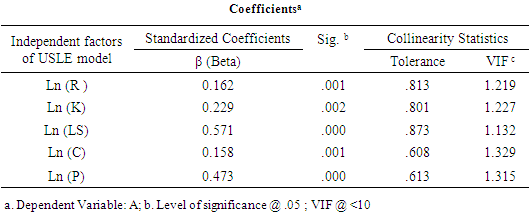
- In this study, we focused on determining the effect of each input factor on soil loss rate for which the pixels have been chosen randomly where soil erosion occurred. The soil loss equation (Eq.1),A = R * K * LS * C * P, was transformed as follows:
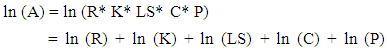 | (12) |
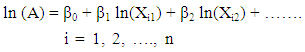 | (13) |
4. Results
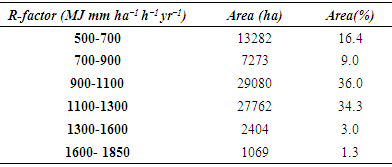
4.1. Rainfall Erosivity Factor (R)
- The average annual rainfall data was used to calculate the R-factor for the entire catchment using Eq. (2). The average annual rainfall (ranged from 986 to 3259 mm) and consequently the estimated rainfall erosivity (ranged from 515 to 1850 MJ mm ha−1 h−1 yr−1) are increasing from the West to the East and South to North on the Megech River catchment area (Figure 9a). Seventy percent of the catchment area showed erosivity factor ranging from 900 to 1300 MJ mm ha−1h−1yr−1 (Table 5). The MFI values in this study ranged from 172.8 to 516.7 (avg. 317.5). The MFI value of greater than 160 is an indicator of very high erosivity according to the classes of MFI (CEC, 1992) [42]. The higher MFI values indicate higher rainfall erosivity in the catchment area. The PCI% values in this study ranged from 15.1 to 23 % (avg.20.1%), which is between moderate and high seasonality according to the Oliver’s (1980) [25] conceptual scale to evaluate the PCI index. The average PCI% indicated that the rainfall follows a seasonal pattern without changes during the study period. The FI values ranged from 60 to 225 (avg. 131), which is between severe to extremely severe according to the Oduro-Afriyie’s (1996) [43] conceptual scale for assessing the Fournier index. The annual rainfall (P) was correlated with MFI and PCI% (Figure 5c). P had a significant +ve correlation with the MFI (r=0.915, p =0.01) and significant negative correlation with the PCI% (r= -0.158, p=0.68), and the MFI was +ve’ly correlated with the PCI% (r= 0.232, p=0.698). The impact of altitude on P, MFI, FI and PCI% was found not significant.
|
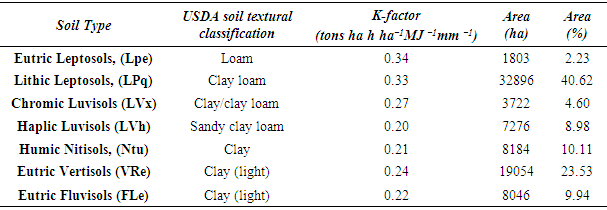
4.2. Soil Erodibility Factor (K)
- There are six soil types within the Megech River catchment, with K-factors ranging from 0.20 to 0.34 tons ha h ha−1MJ−1mm−1 (Table 6). Soil types were extracted from the HWSD. The Lithic Leptosols, (LPq, 40.8%) and Eutric Vertisols (VRe, 33.5%) occupy the largest area, about 75%, of the total area of the catchment with the highest K-factor of 3.3 and 2.4. In the river catchment, the lowest K-values are concentrated in the low lands, whereas the highest K-values are concentrated in the high elevation areas (Figure 9b).
|
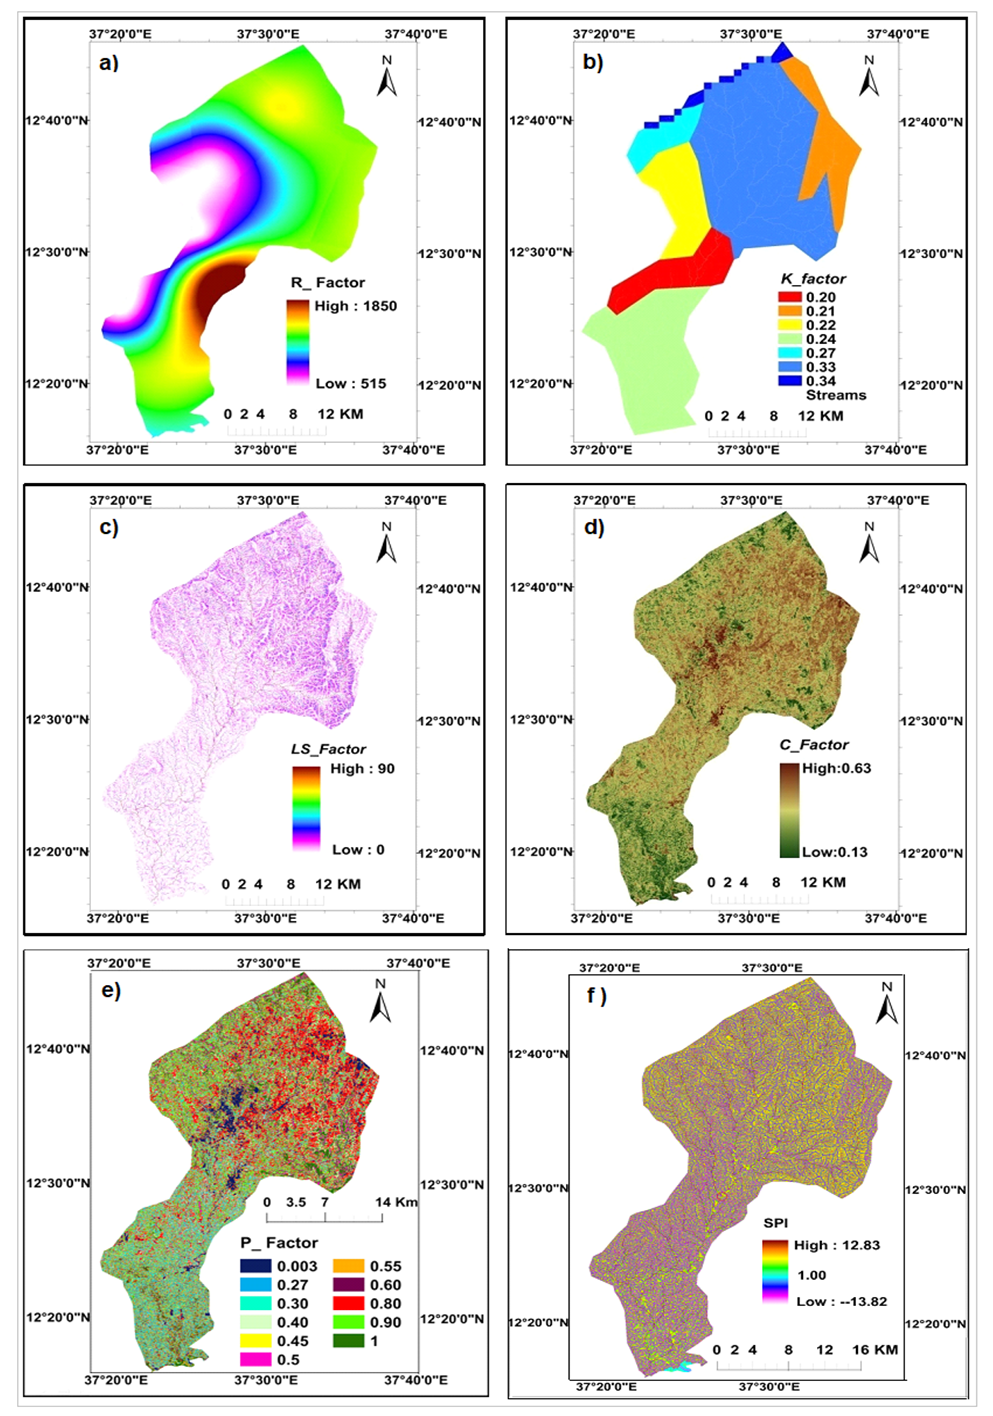 | Figure 9. a. Rain fall erosivity factor (R), b. Soil erodibility factor (K), c. Topographic factor (LS), d. Cropping management factor (C), e. Support practices factor(P), and f. Stream power index |
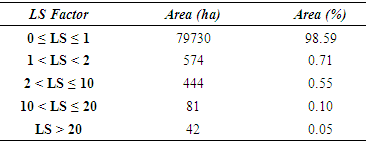
4.3. Topographic Factor (LS)
- It accounts for the effect of topography on erosion. The DEM data show that terrain is very complex, particularly in upper catchment area with 13% of the natural area having a strong slope steeper than 9°. The result of Eq. (7) shows that the LS factor in the catchment ranges from 0 to 90 (Table 7; Figure 9c) with almost all of them being below 1.0, meaning that the slope is very steep and slope lengths are short. This factor leads to a very powerful rain flow rate and makes the soil erosion more serious.
|
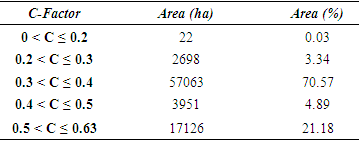
4.4. Cropping Management Factor (C)
- The catchment area shows NDVI values ranging from −0.063 to 0.74 (Figure 6) that are the average values of time series NDVIs of satellite images, and are applied in Eq.(10) to calculate the cropping management factor (C). The results showed that the C-factor in the research area ranged from 0.13 to 0.63 with the highest coefficient of C concentrated in high altitude regions (Table 8; Figure 9d).
|
4.5. Support Practices Factor (P)
- As the erosion prevention practices depend on land use type, six different land use types are identified in the catchment. The support practices factor (P) for the catchment was calculated by the land use type and the slope degrees as suggested by Shin (1999) [44], resulting in values ranging from 0.003 to 1.00 (Table 9; Figure 9e). The dense forest and grass land accounted for 25.5% of the total area, and P-value is 1.0 as there are no conservation practices. The land use map of 2018 was generated with the accuracy of 84% and was estimated in the table of error matrix (Table 3).
|
4.6. Stream Power Index (SPI)
- SPI values ranged from −13.82 to 12.83 and suggest that the stream flow accumulates at one point. (Figure 9f). A strong correlation was found between the rill cross sections and a power function of slope gradients and contributing area reference. The negative values appeared by otherwise high positive main convergent flows and were symbolized in white color whereas the other colored ones were of positive values. Stream power index (SPI) is very indicative about soil erosion potential, and it represents the upstream watershed area multiplied with slope. This index is related to erosion processes, constituting an indicator of the capabilities of a flow to generate net erosion [45]. SPI of the upper Megech watershed is obtained from Arc hydrology module, like derivative of slope and watershed area. The SPI values have large range and their mean value is 217.7+35. SPI values in the range of 2−12.83 cover 74.8% of the entire area, whereas nearly 25% area has below 2. Hypsometrically, highest SPI values have altitude zones of 2200−2950 m which indicate high erosion and transport capabilities of streams in that area.
4.7. Soil Erosion Risk Mapping
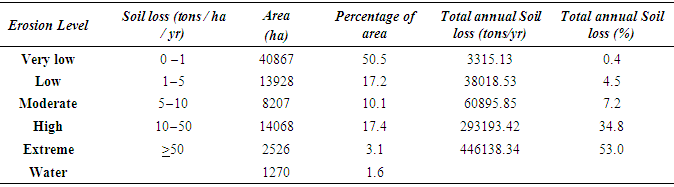
- The raster values of all five factors (i.e., R, K, LS, C, and P) are used as input data for USLE model, and are applied in Eq. (1) to compute the average annual soil loss per hectare (A). The potential soil loss predictions in the study area have been categorized into five levels based on rate of erosion: very low, low, moderate, high and extreme erosion levels (Table 10; Figure 10).
|
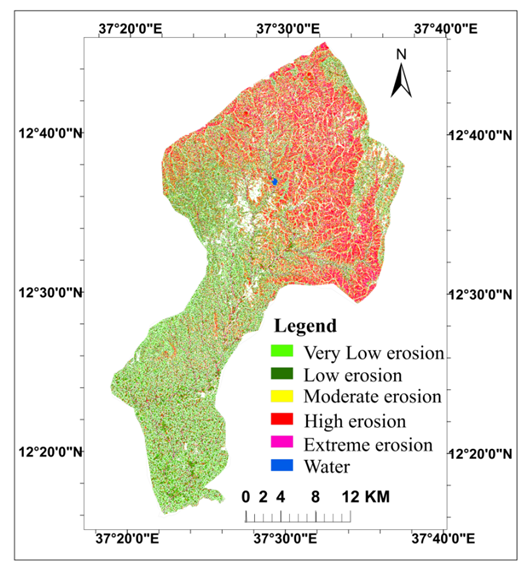 | Figure 10. Soil erosion risk levels in the Megech River catchment |
|
|
|
 | (14) |
|
5. Discussion
- The soil erosion and land degradation problems in Ethiopia are due to increased human population pressures, deforestation, poor soil management and farming practices, insecurity in land tenure, variation of climatic conditions, marginal lands development, escarpment areas and steep slopes for cultivation, free grazing and intrinsic characteristics of fragile soils. The substantial soil erosion from the Megech River drains off most of the nutrients into the Lake Tana polluting it and decreasing the soil fertility in and around the catchment area. The erosion also carries and dumps large quantity of sediment into the lake.
5.1. Rate of Soil Erosion in the Catchment Area
- The gross amount of soil loss accounts for 8,43,736 tons per year in the catchment of Megech River with an average soil erosion rate of 41.54 tons ha-1yr-1. Estifanos (2014) [46] estimated the average rate of soil loss as 39.8 tons ha-1 yr-1 in the Ribb watershed that is adjacent to the present research site. Gelagay and Menale (2016) [47] estimated the average soil loss rate as 47.4 tons ha-1yr-1 in the Koga watershed that is situated in the south of the current research site. The Ribb and the Koga are the catchments of Lake Tana sub basin of the Abbay River basin. Our results show that the soil erosion is higher in the Megech River catchment than that in the catchments of the Ribb and Koga rivers. We suppose that the differences between the R, K, and LS factors of the Megech catchment and the other catchments could be the main reason for higher soil loss rate in the Megech river catchment. The extreme erosion of soil in the mountainous and hilly regions of upper catchment of the Megech river, particularly along the sides of the main streams and down slopes, as we found, may be due to rill and sheet erosion.
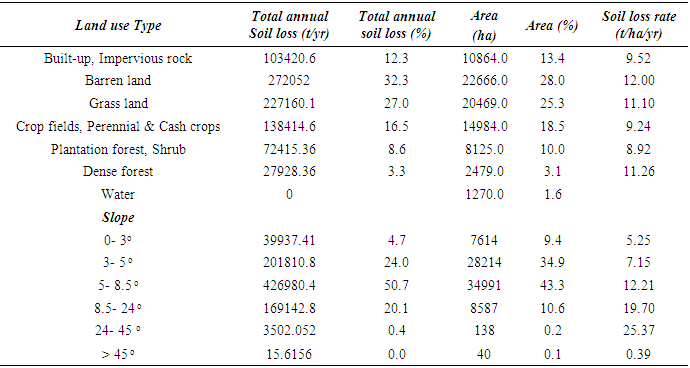
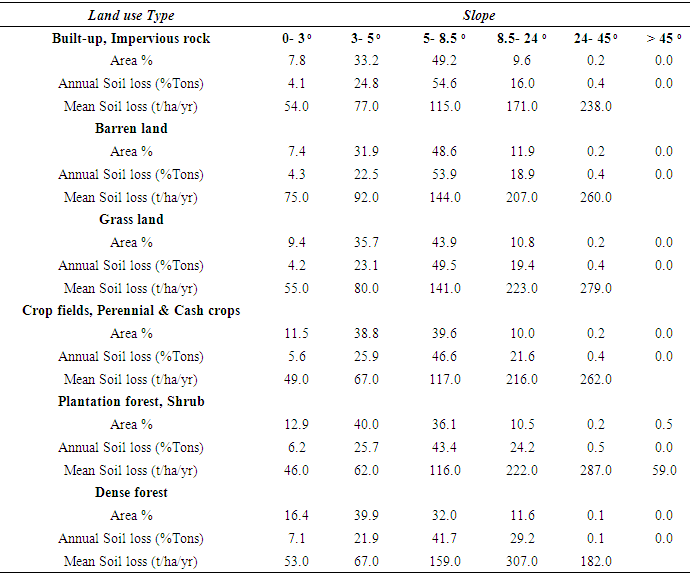
5.2. Soil Erosion and Land Use
- Most studies conclude that the land use influences both soil erosion results and characteristics [48-50]. Our research indicates that different land uses impact the degree of soil erosion differently. The barren land experiences the most severe erosion followed by dense forest and grassland. The main causes of the high soil erosion in these land uses are geographical factors. The soil erosion rate is more in very strong and steep slopes. In the same topographic condition, the soil erosion rate between these land uses varies. Similarly, the soil loss rate varies from particular land use in different topographic conditions. The agricultural fields and plantation are in very strong and steep slopes and they show high rate of soil erosion. The plantation shows more soil erosion rate in steep slopes, while dense forest shows in strong slopes, and in the same topography condition, from steep slopes, the eroded soil rate between dense forest and plantation forest is 1.5 times greater. The volcanic surface rock shows more soil erosion in very strong and steep slopes. These rocks are basic and rich in magnesium causing high weathering.
5.3. Impact of Cultivation Practices on Soil Erosion
- The soil erosion rate and the seasonal calendar have a close relationship with C factor. In the Megech catchment, mainly there are three types of agricultural land use: forest plantation (mostly wood plants), cultivation of annual crops including teff (a staple food millet), and growing of seasonal crops. The growth cycle for each of these vegetations is different. They are usually planted in September when the flood-borne wet sediment comes from the up-lands and settles, and harvested in the following February in low-catchment areas. Usually there is no growth during the initial period, September to November. However, there is rainfall during that time causing severe soil erosion rate.In the up-land areas, sowing is done during May and harvesting is done during October – November. After harvesting, the agricultural land is left as it is without any soil conservation measures. Consequently, soil from such lands is being eroded considerably even by small rainfall intensities. Similarly, there is erosion from the forest plantations where the woods were harvested and the land is prepared for new plantations during the early rainfall season, i.e., May–June. In addition, the agricultural practices in the areas at the foot of steep slopes have been causing more soil loss.
5.4. Impact of Increase in Agricultural Area on Soil Erosion Rate
- We attempted to analyze the impact of land use and land cover changes on soil erosion rate by comparing the current Landsat-8 data of the year 2018 with the Landsat-7 data of 2000. Such a comparison of historical data revealed that the agricultural land increased substantially with the decrease of forest and grasslands. The crop management factors, C, for the increased agricultural area were derived from NDVI. The gross amount of erosion has been increased to 15% when compared with the actual soil loss in 2018 that is due to increase in agricultural area and decrease in forest and grassland area. The increase in soil loss was found mainly due to the unscientific agricultural practices like primitive ploughing, tillage, land preparation, etc. In addition, conversion of scrublands, grazing fields, and uncultivated barren lands to agricultural fields has been leading to more soil loss. The original forest cover was reduced from 90% to a mere 5.6% of the total Ethiopian highlands area coverage [51].
5.5. Impact of Land Use and Land Cover Changes for Developmental Programs on Soil Erosion Rate
- Urban Planning and Implementation are the major focused areas of Ethiopia. The developmental corridor in the North Gondar area, particularly transportation corridors in the highlands, is now undergoing rapid urbanization causing land degradation and soil erosion. For example, cutting of hillocks and stone crushing for development of road corridors for connecting various villages for transport purposes, but leaving the cut portions of hillocks without any landslide control measures, have been causing the land erosion.
6. Conclusions
- Prevention and control of substantially high annual soil erosion from the Megech River catchment needs an attention for sustainable conservation of the soil fertility in and around the catchment as well as to prevent nutrient and sediment pollution loads into the Lake Tana. Appropriate strategies and action plans must be drawn and implemented for protection and conservation of the catchment and its soil and land resources. Scientific land use allocation and management, agricultural and forest cultivation practices must be propagated among the farmers and their implementation shall be regularly monitored. Soil conservation in the agricultural lands in the catchment area, and the restoration of the lands degraded due to various infrastructural developmental activities also would prevent and control soil erosion and land degradation.
ACKNOWLEDGEMENTS
- We would like to express our sincere appreciation to the Mrs. Ertiban Wondifraw, Co-ordinator, Soil and Water management, Agricultural Research Centre, Gondar, for providing the meteorological data. We are also grateful to the National Meteorological Service Agency (NMSA), Addis Ababa, and Landsat/EO/NASA/USGS for their unconditional support.