-
Paper Information
- Paper Submission
-
Journal Information
- About This Journal
- Editorial Board
- Current Issue
- Archive
- Author Guidelines
- Contact Us
American Journal of Geographic Information System
p-ISSN: 2163-1131 e-ISSN: 2163-114X
2019; 8(2): 96-102
doi:10.5923/j.ajgis.20190802.05

Multitemporal Sentinel-1SAR Interferometry for Surface Deformation Monitoring near High Dam in Aswan, Egypt
 Abstract
 Reference
 Full-Text PDF
 Full-text HTML
1Department of Geomatics, Faculty of Environment Design, King AbdulAziz University, Jeddah, Saudi Arabia
2Faculty of Engineering, Aswan University, Aswan, Egypt
Correspondence to: Yehia H. Miky, Department of Geomatics, Faculty of Environment Design, King AbdulAziz University, Jeddah, Saudi Arabia.
| Email: |  |
Copyright © 2019 The Author(s). Published by Scientific & Academic Publishing.
This work is licensed under the Creative Commons Attribution International License (CC BY).
http://creativecommons.org/licenses/by/4.0/

The area in the downstream of Aswan High Dam is subjected to many factors that may cause a deformation on the earth surface. The existence of Lake Naser, the hesitated water table and its bad effect and the tectonic activities increase the possibility of surface elevation changes. In this study, Multitemporal Synthetic Aperture Radar (SAR) images and Differential SAR Interferometry (DinSAR) technique were used to derive terrain deformation measurements over the area near Aswan high dam. The data were processed using SNAP, Sentinel Application Platform and a two-pass interferometry technique with the help of the Shuttle Radar Topography Mission (SRTM) is performed. Based on the results, all interferograms performed have high coherence while the pixels represent water surface had a low coherence value. The surface elevation changes range between -6.5 cm and +2.4 cm in 2017, while in 2018 it ranges between -5.2 cm and +6.6 cm. it is recommended to use a longer observation time period with three-pass interferogram technique to give the independence of the external low-resolution DEM and map the annual rates of movement.
Keywords: Sar Interferometry, Sentinel-1, Surface Deformation, Aswan High Dam
Cite this paper: Yehia H. Miky, Multitemporal Sentinel-1SAR Interferometry for Surface Deformation Monitoring near High Dam in Aswan, Egypt, American Journal of Geographic Information System, Vol. 8 No. 2, 2019, pp. 96-102. doi: 10.5923/j.ajgis.20190802.05.
Article Outline
1. Introduction
- Radar interferometry is an effective method for obtaining Digital Elevation Models (DEM) from SAR images by exploiting the phase information of the signal backscattered by the terrain. When using differential mode, it can also provide information on changes in terrain caused by various phenomena such as earthquakes, landslides, subsidence, variation in the ground water table, etc [1-4]. Differential Synthetic Aperture Radar Interferometry (DInSAR) can be used to measure ground deformation by relying on the phase difference between multi temporal SAR acquisitions, with accuracies in the range of mm to cm [5, 6]. Although the principles have been stated long time ago, radar interferometry did not really used until the 1990s, with the launch of the ERS-1 satellite followed by the ERS-2 satellite (tandem mission). It must be noted, however, that this technology is not yet widely used in the field of remote sensing in general and radar in particular, due to the difficulty of obtaining data, which is not free of charge, or due to the sophisticated software and methodologies. In April 2014 the European Union's Copernicus programme lunched the first sentinel-1A followed by sentinel-1B, each carries a C-band Synthetic Aperture Radar. The main advancement of Sentinel-1 is the new imaging technique, i.e., the Terrain Observation by Progressive Scans (TOPS) [7]. This new scan technique allows to cover large footprints (about 250 km across the orbit track) by three overlapping sub-swaths. The data acquired by this satellite can be easily downloaded for free from The Copernicus Open Access Hub.The Aswan High Dam is considered a unique structure among all the large irrigation and electric power projects in the world, see Figure 1. It was chosen to be a rock fill dam provided with an impervious core in its main part. The construction of the dam was completed in 1971 with the financial and technological assistance of the Soviet Union. The lake behind the dam, Lake Naser, is the major freshwater body supplying Egypt with water for different purposes. The lake now provides an important source of fish for Aswan and the rest of Egypt [8]. Lake Naser has a length of about 500 Km, 325 Km in Egypt and 175 Km in Sudan. It can store up to 130 billion m3 of water, water level reach 182-m above sea level in case of full storage scenario [9].
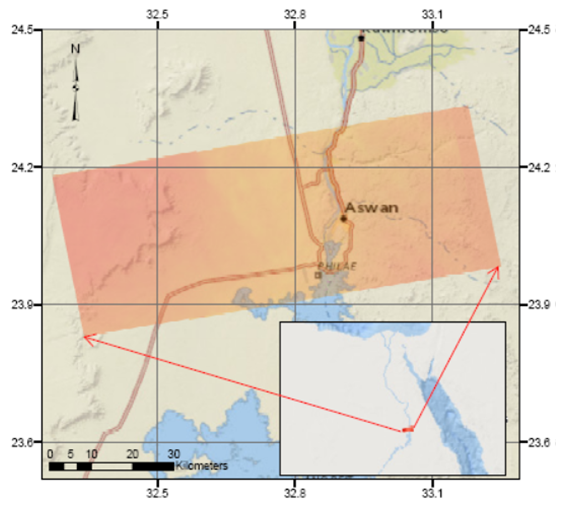 | Figure 1. Location of the study area |
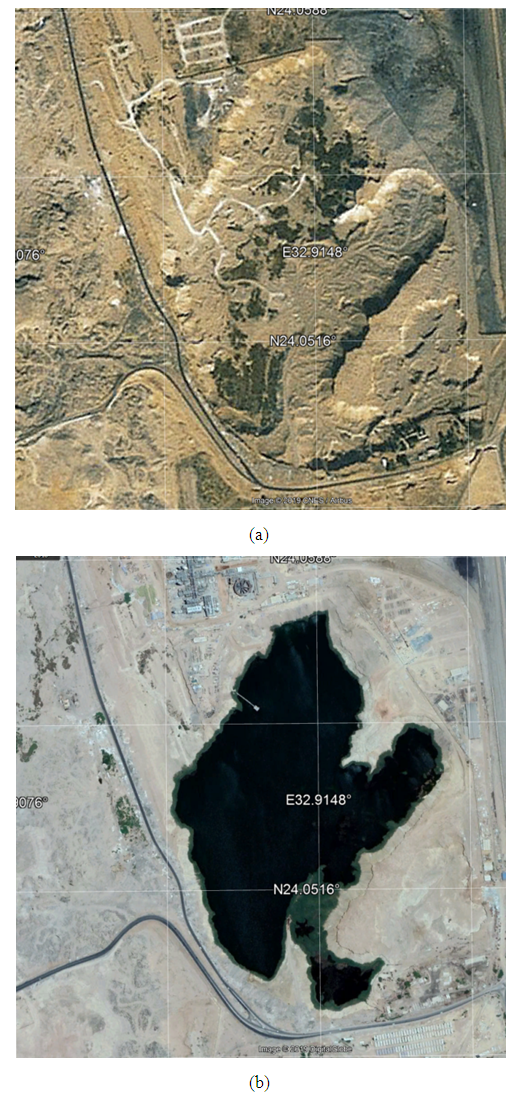 | Figure 2. El Shalaal region near Kima factory: (a) on 02 July 2007, (b) on 07 November 2018 |
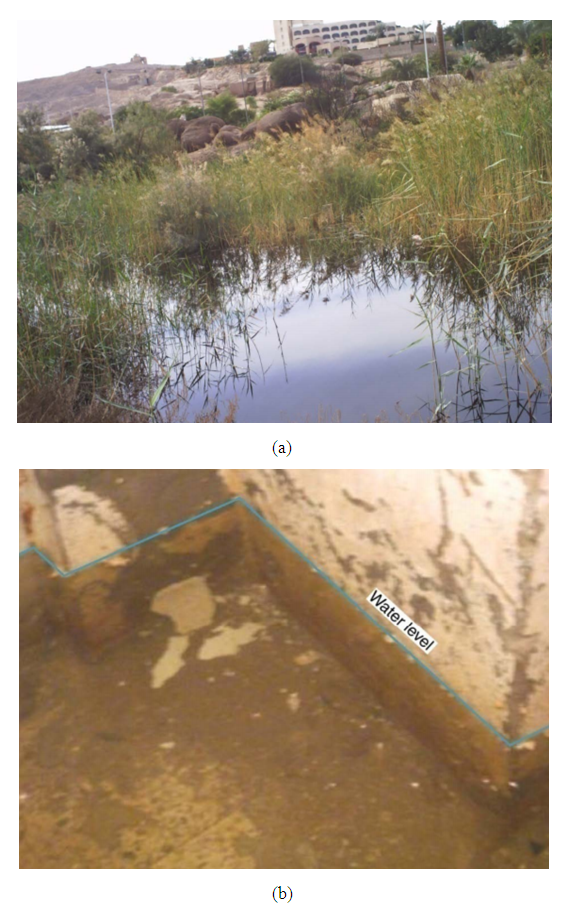 | Figure 3. Rising groundwater level affecting areas: (a) KhorAwadaa, (b) Phatemic graves area [14] |
2. General Background
2.1. Interferometry and Differentia Interferometry
- The radar image contains data of a complex nature, namely, the amplitude of the signal and also its phase. The phase is considered a valuable source of information on the change of relief in the image area. The measurement of the phase is at the base of the so-called interferometry Radar technique. This technique has been proposed and detailed for topographic applications by Zebker and Goldstein [18]. The principle of interferometry is the measurement of the phase difference between signals coming from the same object and picked up in two different positions by the radar. This phase difference is directly related to the altitude of the illuminated object. The technique of differential interferometry was introduced by Gabriel et al, 1989 [19]. It is used to measure sub centimeter variations at altitude in the relief of a nominal terrain. The basic concept is to use radar images of different periods to detect any variation in altitude in the terrain. Technically, via the subtraction of two interferograms obtained before and after the manifestation of the phenomenon that caused the deformation. After the subtraction, the remaining represent the magnitude of the altimetric change that the terrain has subjected. According to Massonnet et al, 1993, in order to take advantage of the technique of interferometry, two conditions are decisive they are: the two images must have a high correlation coefficient between them and the target must have the same physical characteristics during acquisition times [20].
2.2. Interferogram Formation
- A satellite SAR, when repeating orbits, can observe the same area at different times from slightly different look angles. The nominal repeat interval of the Sentinel1 acquisitions was 12 days. The distance between the two orbits in the plane perpendicular to the orbit is called the interferometer baseline (see Figure 3) and its projection perpendicular to the slant range is the perpendicular baseline (Bn). When some of the point on the ground slightly change their relative position in the time interval between two SAR observations (orbit 1 at time T1 and orbit 2 at time T2), the interferometric phase
 with respect to notations in figure 4, can be calculated as equation (1).
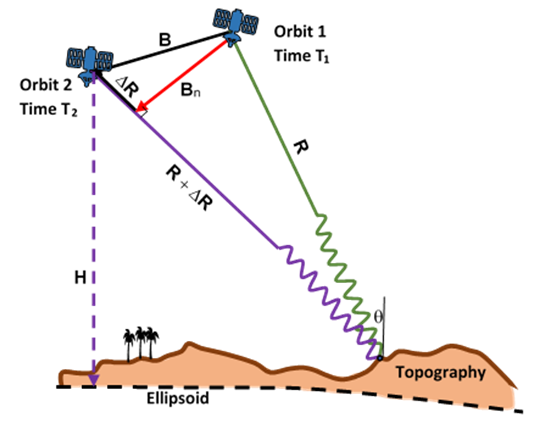 | Figure 4. Differential SAR interferometry |
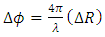 | (1) |
 is the relative scattered displacement projected on the slant range direction.The interferogram is defined as the product of the complex values of a master image and complex conjugate of a slave image, i.e. the amplitudes of the corresponding pixels are averaged and the difference of the phase values for each point in the image is calculated. In interferometry, the perpendicular baseline plays a very important role in the application point of view. Particularly, when the application is related to the height or altitude of any target, the altitude of ambiguity (ha) is defined as the altitude difference that generates an interferometric phase changing of 2π after interferogram flattening. The altitude of ambiguity is inversely proportional to the perpendicular baseline, see equation 2. The larger the perpendicular baseline, the more is the sensitivity of the interferogram phase to topography. However, the smaller the perpendicular baseline, the more is sensitivity of the interferogram phase to the deformation.
 | (2) |
 is the perpendicular baseline,
  and is the incident angle.
2.3. Differential Interferometry Methods
- There are four methods for measuring terrain elevation changes using differential interferometry. The first method used two images, by which one image represents the terrain before change, and the second is acquired after this change. However, both acquisitions must have exactly the same geometry, otherwise this technique will not produce any results. Areas that have no changes will have the same phase and a zero-phase difference. On the other hand, those with an altitude changes will backscatter waves with different phases. The rate of change can then be deduced geometrically. This technique remains difficult to achieve because even a small shift in the trajectory will certainly induce an error. The second method, named two-pass interferometry, can be implemented if we have two images beside a DEM for the studied area. The DEM represents the terrain before the change, one or both images are acquired after this change. An interferogram is simulated from the DEM and subtracted from the one generated based on the two images. The third method is the three-pass interferometry where tree images are used. In this method, the first two images of the scene must be taken before the altimetric variation of the relief, while third image is acquired after this change. Two interferograms are generated: one from the first two images, and the other from the second and third images, and then these two interferograms are subtracted. This technique results in a double difference interferogram. The fourth method is the fourth-pass interferometry that can be achieved with two separate couples of images. The first couple must be acquired before the change, and the second is taken after. By subtraction of the two interferograms obtained from the two pairs, the terrain elevation changes are then carried out.
3. Methodology
3.1. Study Area
- The study area is located in a downstream of Aswan High dam in the Eastern side of the Nile river, in Aswan, Egypt, bounded by latitudes 24°01'30" and 24°06'30"N and longitudes 32°52' and 32˚56'E. (Figure 2). This area can be classified as highlands where the elevations vary from 164 to 188 m above the main sea level. Few wadis incise this area and directed from east to west such as Wady El-Keimab and Wady Al-Haytah. The high land areas are underlain by basement rocks and or by Nubian sandstones. This region is subjected to an abrupt increase in the ground water levels and continuing up till now. Besides, it is considered to be seismically active place, based on the Egyptian National Seismic Network (ENSN) observations.
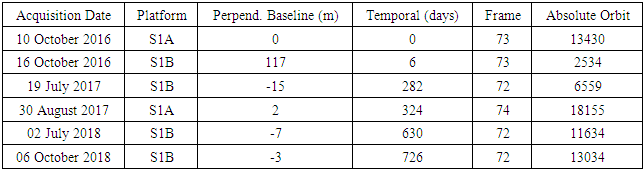
3.2. Data
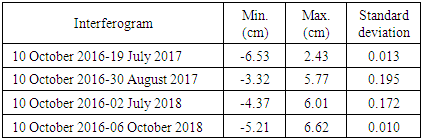
- This study was carried out by using the C-band SAR, wavelength λ = 5.6 cm. Data acquired in ascending orbit by Sentinel-1A (S1A) which was launched on 3 April 2014 and Sentinel-1B (S1B) on 25 April 2016. Their data are free downloadable from the European Space Agency (ESA) [21]. Dataset consists of seven SAR images acquired from October 2016 until January 2019 as shown in table 1. They are characterized by small spatial and temporal baselines. Repeating cycle between observations varies between 6 and 12 days. Level1 interferometric Wide (IW) Single Look Complex (SLC) data were used. Image pairs for interferogram conduction were selected thanks for the Interferometry Baseline Tool Published by Alaska Satellite Facility (ASF), University of Alaska Fairbanks (UAF) [22].
|
3.3. Methods
- In this study we will use the two-pass interferometry with the help of the Shuttle Radar Topography Mission (SRTM) 3 second DEM for the study area, see figure 5. The datasets are required to generate a real interferogram in each time interval. The differential interferometric processing aims at separating the topographic and displacement term in an interferogram. The topographic phase has to be removed to identify the displacement component. Hence, two interferograms are formed. The master image was acquired on October 10, 2016, and the slave image depending on the time interval for formation the DEFO interferogram, where the TOPO interferogram is generated from the DEM. So, we have five deferential interferograms to estimate the displacement during the time intervals between the dates of these images.
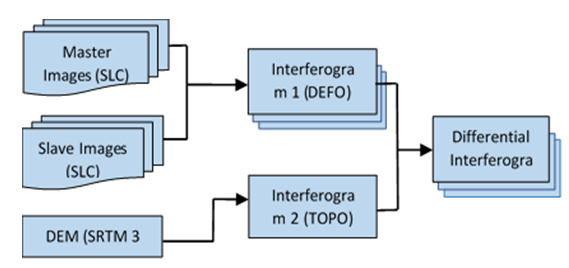 | Figure 5. Two-pass differential SAR interferogram formation |
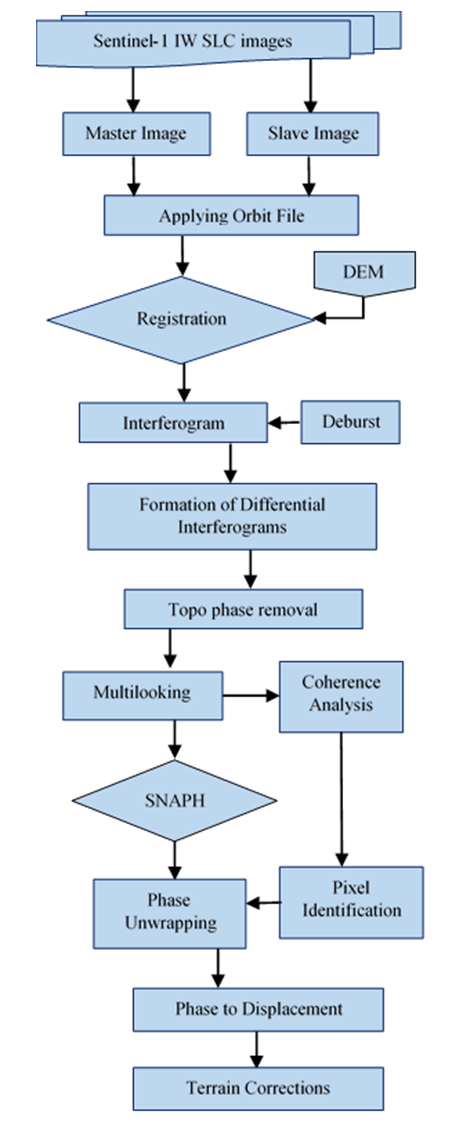 | Figure 6. A typical workflow of the proposed methodology |
4. Results and Discussion
- The debursted interferograms contain interferometric phases band and coherence bands. In the phase bands represents the phase difference between the two images, after debursting, it is appeared as a spatially continuous image. The coherence map is an indirect measure of the quality of the interferogram. The coherence of all interferogram was very high on a scale from zero to one except the pixels represent water in the ground which appear to have low coherence. The next step is differential interferogram formation where the Topographic phase must be removed to obtain the deformation. Figure 7 shows the Topographic phase VV polarization removed from the differential interferogram created from orbits 13430 and 2534, i.e. between 10 and 16 October 2016. The maximum height removed was 28.755 m.
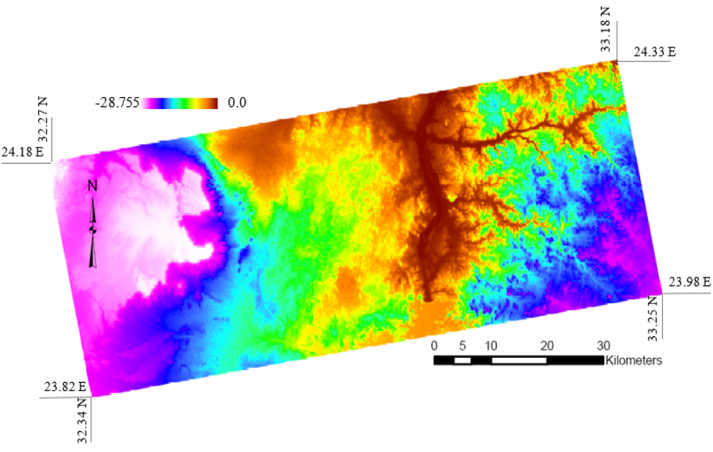 | Figure 7. Topographic phase from 10 and 16 October 2016 images |
|
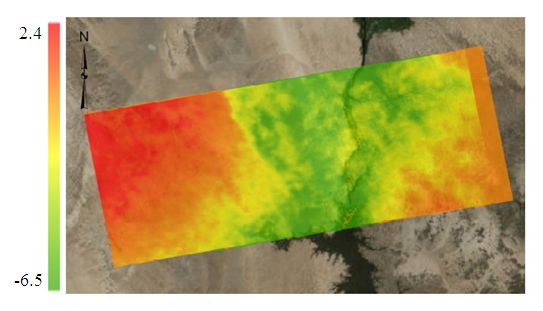 | Figure 8. Surface elevation changes (10 October 2016 - 30 August 2017) |
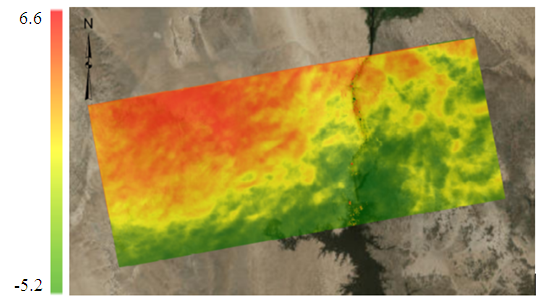 | Figure 9. Surface elevation changes (10 October 2016 - 06 October 2018) |
5. Conclusions
- In this study the interferometric processing of the sen-tinel-1 TOPS data was presented, a straight forward ap-proach was followed to reach the goal of determining the surface elevation changes in the area near Aswan High Dam, Egypt. All interferograms performed have high coherence values, while the pixels represent water sur-face had low coherence values. High coherence permit-ting the retrieval of a time-series of displacement in a good manner. Based on the results, the surface elevation changes range between -6.5 cm and +2.4 cm in 2017, while in 2018 it ranges between -5.2 cm and +6.6 cm. The maximum height removed in differential interferogram due to topography was 28.755 m. However, a long-er observation time period is necessary because these data do not permit so far to estimate the annual rates of movement. The low spatial resolution of the DEM used prevent of reveal many spatial details and possibility to identify non-uniform motion became difficult. It is recommended that, a specific in-situ experiments are need-ed, and it should be well planned to validate the InSAR results. For further work, it will be better to use three-pass interferometry to give the independence of the external low-resolution DEM.