-
Paper Information
- Paper Submission
-
Journal Information
- About This Journal
- Editorial Board
- Current Issue
- Archive
- Author Guidelines
- Contact Us
American Journal of Geographic Information System
p-ISSN: 2163-1131 e-ISSN: 2163-114X
2019; 8(2): 39-54
doi:10.5923/j.ajgis.20190802.01

Assessing Forest Cover Change and Deforestation Hot-Spots in the North Kivu Province, DR-Congo Using Remote Sensing and GIS
 Abstract
 Reference
 Full-Text PDF
 Full-text HTML
Musumba Teso Philippe1, Katcho Karume1, 2
1Faculty of Environmental Sciences, Université Evangélique en Afrique (UEA), Bukavu, DR, Congo
2Goma Volcano Observatory, Department of Geochemistry and Environment, Goma, DR, Congo
Correspondence to: Musumba Teso Philippe, Faculty of Environmental Sciences, Université Evangélique en Afrique (UEA), Bukavu, DR, Congo.
| Email: |  |
Copyright © 2019 The Author(s). Published by Scientific & Academic Publishing.
This work is licensed under the Creative Commons Attribution International License (CC BY).
http://creativecommons.org/licenses/by/4.0/

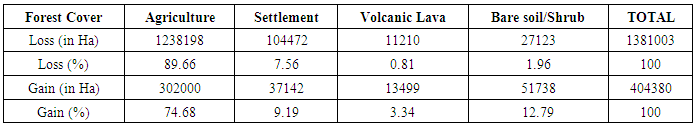
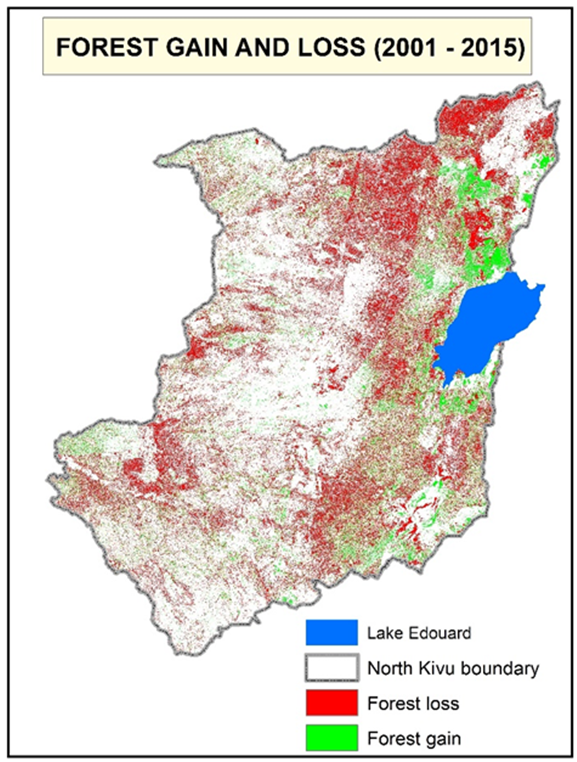
Since the advent of plant and animal domestication, humans have been alternating the land cover to satisfy their needs. In many developing countries, the forest patterns have been reduced in replacement to non-forest areas such as agriculture land. This study assessed the change in the land cover/use and analysed the deforestation hot-spots of the North Kivu province in the Eastern part of the Democratic Republic of Congo (DRC). Landsat 7 ETM+ and Landsat 8 OLI/TIRS images were used to quantify temporal change between 2001 and 2015. Supervised classification techniques were performed using ArcGIS 10.3 ESRI software and Change Detection was performed with the Remote Sensing software ERDAS Imagine 2014. Getis–Ord (Gi*) spatial statistics tool of ArcGIS 10.3 software was used to identify deforestation hot-spots whose presence was confirmed by the Spatial Autocorrelation (Global Moran I). With reference to forest cover change, the results reveal an overall change, from 2001 to 2015, of 1,381,003 ha (30%) for forest loss and 404,380 ha (9%) for forest gain. The study concluded that agriculture is the major factor impacting 89.66% of the forest loss due to agriculture expansion. It also revealed the presence of hot-spots areas with a Z score of 92 and P-value of 0.0000 especially along the main roads and major towns.
Keywords: Land use/cover, Change detection, Forest, Remote Sensing, GIS, Hotspot analysis, North Kivu
Cite this paper: Musumba Teso Philippe, Katcho Karume, Assessing Forest Cover Change and Deforestation Hot-Spots in the North Kivu Province, DR-Congo Using Remote Sensing and GIS, American Journal of Geographic Information System, Vol. 8 No. 2, 2019, pp. 39-54. doi: 10.5923/j.ajgis.20190802.01.
Article Outline
1. Introduction
- Humans have been alternating the Land cover, since the advent of plant and animal domestication, through clearance of land for agriculture and livelihood [1, 2]. The last decade human impacts on land cover have increased with effects on natural resources, hydrological cycle and climate [1]. Economic, institutional, technological, cultural and demographic variables have been affecting the land cover, especially the forest cover [3]. The population growth affects the humans’ demand of food, energy and other economic interests [4, 3] and has negative or positive impacts on the forest cover.Humans are recognized as the key factor of global environment change. Land cover change, especially the conversion of forested areas to other use, has been a consequence of human activities and they are identified as a contributing factor to climate change and loss of biological diversity [1]. Currently, there is a growing necessity of studying the land use/cover change as part of the global environment study [5]. Thereby various studies relating to land cover change have been conducted using different techniques [6]. Some of these studies concern understanding key factors driving change in the land cover [1] to improve resources management and decision making [6]. For instance, modelling is used to simplify the complexity of socio-economic and biophysics factors that influence the change in the land cover [7]. The strong interest in land use / cover results from their direct relationship to many of the planet’s fundamental characteristics and processes including the productivity of land, the diversity of plant and animal species, and the biochemical and hydrological cycles [1]. Remote sensing techniques have been used to classify and map the land cover change using satellite images such as Landsat, which have played an important role in identifying change [7, 8].The change in the land cover, especially the conversion of forested areas to other use, does not have the same magnitude over the world. Some developing countries in the tropical forest regions are known to possess the highest rate of deforestation although they have possibility of interring the carbon market [1].The North Kivu was selected for change detection for this study being one of the DRC provinces with an important area of tropical forest. In addition, except Kinshasa city-province, the North Kivu had the highest annual population growth rate in DRC in 2010 [9] and its population increased by more than 15% between 2010 and 2015 [10]. Consequently, the agricultural activity, which is the major economic activity of North Kivu [11], has increasingly lead to the forest cover loss. Assessing forest cover change requires remote sensing and geographic information system (GIS) techniques. Multi-temporal and multi-spectral satellite images are processed to map the forest cover and monitor the forest patterns dynamics over a period of time. It allows the forest cover change to be observed spatially and historically [5] for a better decision-making. Remote Sensing data helps to monitor change and its driving factors [12].Hot-spot analysis known also as Getis-Ord Gi* [13] is a method used to analyze the location related tendency (clustering) in the attribute of spatial data [14]. The method focuses on calculating the value of each feature (polygon or points), taken in the context of neighboring features, in a dataset. The neighboring features which return the highest value of the Getis-Ord Gi* statistic is considered as the hot-spot area. The hot-spot analysis method has been used in rainfall, epidemic and agriculture modelling and has been recently applied in assessing spatio-temporal patterns in forest cover loss [14, 15]. The objective of the present study was to use Remote Sensing and GIS techniques to map the land cover and assess its forest cover change occurring in North Kivu province, Eastern part of DRC for 2001 and 2015. The study also aimed at identifying and analyzing the deforestation hot-spots that should be the forest conservation priority regions in the study area.
2. Study area
2.1. Location of the Study Area
- The North-Kivu province is located in the Eastern part of the DRC at latitude 0° 58’ - 2° 3’ and Eastern longitude 27° 14’ - 29° 58’ (Figure 1). It is one of the provinces of DRC that extends on both sides of the Equator in East of the country.
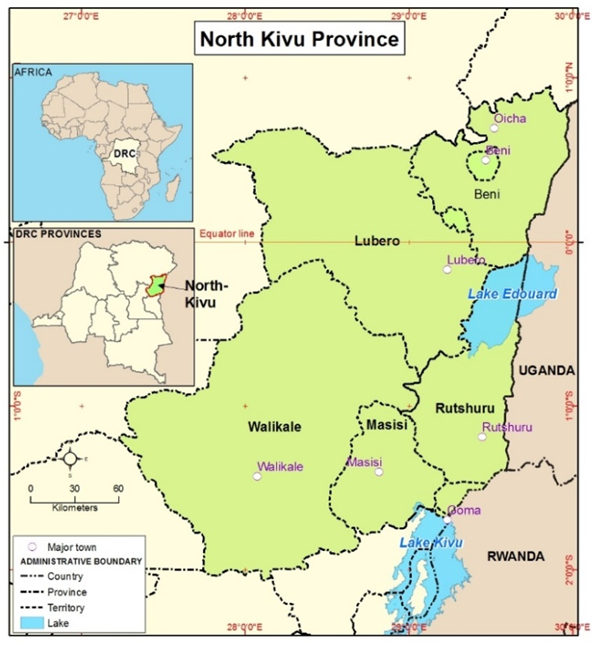 | Figure 1. Location map of the North-Kivu province |
2.2. Relief, Climate and Hydrography of North-Kivu
- The North-Kivu topography varies between 800 and 2,500 meters of altitude. However, some mountains raise up to 2,500 meters such as mount Ruwenzori (5,119 m), Nyamulagira volcano (3,056 m) and Nyiragongo volcano (3,470 m) [16]. The physiology of North Kivu is the result of the rifting and seismicity in the Albertin Rift valley that created low and up lands from Lake Albert in North-East DRC to Lake Malawi [17].The diversity of climate in North Kivu is a result of the heterogeneity of the topography. Below 1,000 meters the average temperature is 23°C, around 1,500 meters the temperature is close to 19°C and around 2,000 meters the temperature is close to 15°C. The average annual rainfall varies between 1,000 mm and 2,000 mm. The lowest monthly precipitation is recorded between January and February and July and August. The North Kivu climate is characterized by four seasons: two wet seasons and two dry seasons. The first wet season appears between mid-August and mid-January and the second in mid-February to mid-July. However, the two dry seasons appear in a very short time. The first is observed between mid-January and mid-February and the second between mid-July and mid-August [16].The North Kivu main hydrographic network includes the Lake Edouard, which is one of the African great lakes and four lakes inside the province (Ndalaha, Lukulu, Mbalukia and Mbila). The Lake Kivu makes border of the southern part of the province. Apart from these lakes, the province has the following big rivers: Rutshuru, Rwindi, Semliki, Osso and Lowa [16].
3. Material and Methods
3.1. Data Acquisition
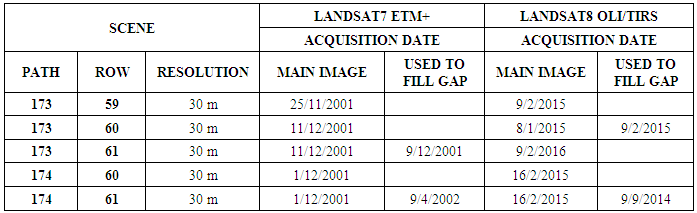
- LANDSAT 7 ETM+ for 2001 and LANDSAT 8 OLI/TIRS for 2015 satellite images covering the study area were downloaded from http://earthexplorer.usgs.gov. The five scenes used are described in Table 1. The data extracted from LANDSAT 7 ETM+ and LANDSAT 8 OLI/TIRS satellite images acquired on 2001 and 2015 were used to assess the dynamics of the land use of North Kivu province. A total of ten scenes over the space of two years was downloaded considering their cloud cover rates less than 15%. Four additional scenes (Table 1) were downloaded to fill the areas covered by the cloud. Table 1 shows the details of the acquired images including the path and row information. All the images are on the scale of 30 meters of resolution.
|
3.2. Image Pre-Processing and Classification
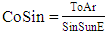
- It is advised to perform pre-processing techniques for satellite imagery prior classification and analysis. The pre-processing operations helps to reduce errors due to solar, topographic and atmospheric effects. Before applying atmospheric correction to enhance the quality of the images, different scenes were mosaicked and clipped by the GIS polygon representing North-Kivu boundaries. We implemented the atmospheric correction to the near infrared, red and green bands separately using Equations 1 and 2 applied in the Raster Calculator (Spatial Analyst) tool of ArcGIS 10.3 software. For Equation 1, DN2ToAr is Digital Numbers to Top of Atmosphere, B_Mult_B is Band specific of multiplicative bands, DN_V is Digital Numbers value and Ref-Add is Reflectance Additive and for Equation 2, CoSun is correction for sun elevation, ToAr is Top of atmospheric reflectance and SinSunE is Sinus of sun elevation.
 | (1) |
 | (2) |
|
3.3. Land Cover Change Detection and Modeling
- After the Supervised classification of Landsat images, a post-classification change detection was performed using ERDAS IMAGINE 2014 software to determine changes. The changes concerned only the forest spatial extent converted to other types of Land cover to determine the forest cover loss. At the end, table describing the forest gain and loss was generated as result for discussion. ArcGIS 10.3 data Management tool was used to create a fishnet, which is a polygon feature class of rectangular cells that was cropped to the North Kivu boundary for statistical analysis (Figure 2). A total of 6812 cells of 3000 meter by 3000 meters, except the cropped ones, were generated for this fishnet covering the study area. Moreover, the Zonal statistics as table tool were used to calculate the value of pixels of forest cover loss (Figure 3-C) within each cell of the fishnet. The output was a table with values of forest cover loss listed in a field and whose data were added to the North Kivu fishnet feature using “joint table” tool of ArcGIS 10.3.
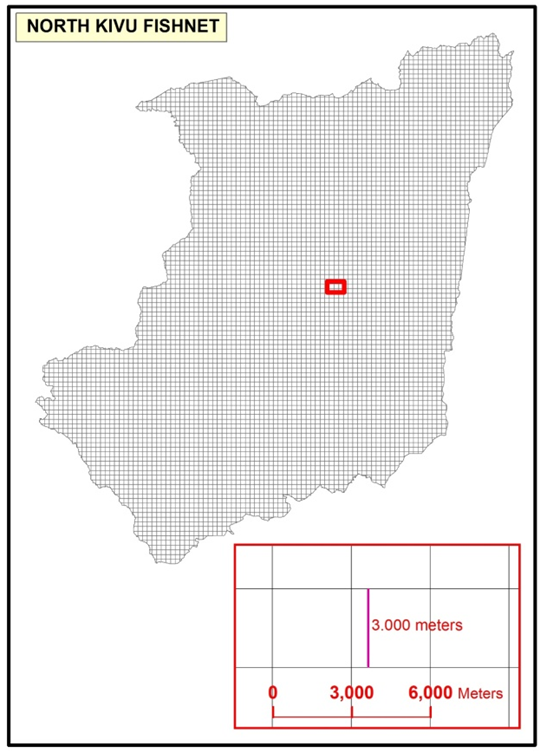 | Figure 2. Fishnet map of North Kivu |
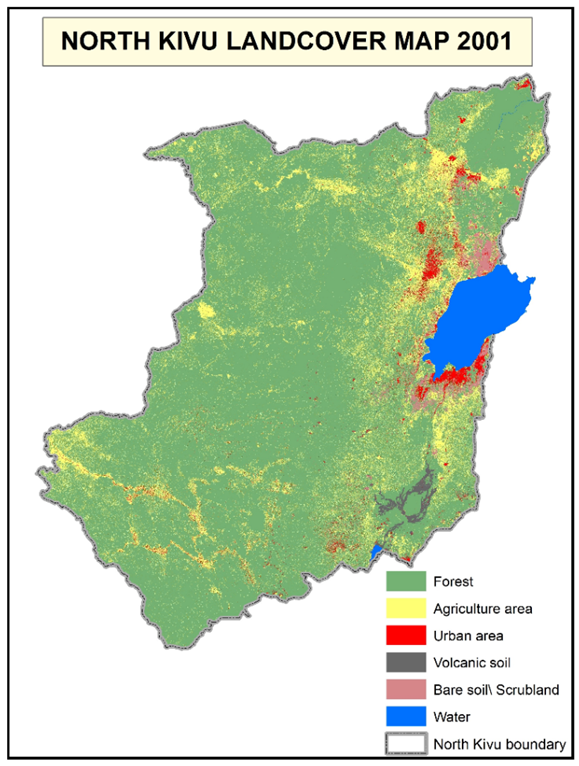 | Figure 3. Land cover/ use map of North Kivu 2001 |
3.4. Hotspot Analysis Assessment
- Prior to perform hop-spots analysis, a feature class containing a rectangular cells (fishnet) covering the study area was created using the “create fishnet” tool from ArcGIS 10.3 software. The cell size has been set to 3 km x 3 k m before the fishnet map was clipped to fit the study area (Figure 2). Each polygon (cell) in the fishnet has an attribute used to record percentage of pixels representing forest loss which occurred inside between 2001 and 2015. The pixels containing forest cover loss were counted from change detection map using the “Zonal Statistic as a table” tool of ArcGIS 10.3 and output values were integrated in the fishnet map for analysis. The fishnet mapping approach is a grid thematic mapping in which data are related to within a spatial weighted matrix. This quadrat-based technique is appreciated by many researchers because it avoids problems associated with different sizes and shapes of administrative geographical zones [24]. The approach uses uniform comparable grids over the study area drawn as a GIS layer, which leads to an easy identification of hotspots. Especially for the North Kivu province, administrative geographic zones (collectivities or health areas), which could be used to perform hotspots analysis, have sizes and shapes which are so irregular that could negatively affect the analysis results.High or low distribution of geographic can be identified visually or using statistic tests. However visual identification can lead to wrong information [26]. Thus, the Z-scores and P-value statistic test are very important to detect the presence of hot-or-cold spots [27]. The Spatial Autocorrelation is a statistic test used for study of map patterns and geostatistics [25]. For this study, Getis-Ord hotspots analysis was used to investigate critical areas and test the deforestation spatial autocorrelation over the study area. Its output results a Z-score and a P-value which confirm statistically significant hot and cold spots across the study area. The approach told where fishnet cells with either high or low values of forest cover loss where clustered spatially, looking at each cell in the context of neighboring feature [26]. Because a fishnet cell with high value of forest cover loss should also be surrounded by other cells with high value as well to be considered as hotspot.A P-value is a probability associated with a Z-score, which are defined before launching a hot-spots analysis algorithm. With “< -1.65 or > +1.65”, < -1.96 or > +1.96 and < -2.58 or > +2.58 as critical Z-values, are associated 0.10, 0.05 and 0.01 theoretical P-values for 90, 95 and 99 percent confidence levels respectively. A Z-score above 2.58 means that the spatial autocorrelation of Moran I shows a statistically significant hot-spots (high values) and a Z score below −2.58, a statistically significant cold-spot (low values) at a significance of P < 0.01 [28]. If a P-value of 0.05 is considered, the statistically significant hot-spot are tested with a Z score of 1.96. Developed in 1990’s, the hotspots analysis approach was commonly applied in rainfall and epidemic modelling. In recent years, the method has been used in many research fields [14] including deforestation modelling [29, 30, and 31]. Since then, it has been integrated in many GIS software such as ArcGIS (version 10.3) used for the current study to identify the presence of spatial clustering of forest cover loss for the period 2001-2015 in North Kivu province. The confirmation of hot-spots of deforestation was tested using the Complete Spatial Randomness (CSR) of 2.58 to confirm the deforestation hot-spots in the study area at a 99% confidence interval. The function used to calculate the Getis-Ord Gi* statistics using ArcGIS software is represented by the Equation 3 Ord JK [24] where
 statistic is the Z-score,
  is the attribute value for feature j,
  is the spatial weight value between feature i and j and n is equal to the total number of features [25, 28, 32].
 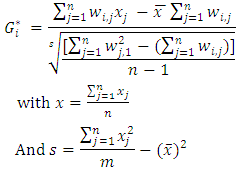 | (3) |
4. Results and Discussion
4.1. Land Cover/ Use Patterns
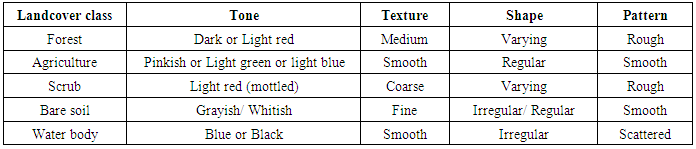
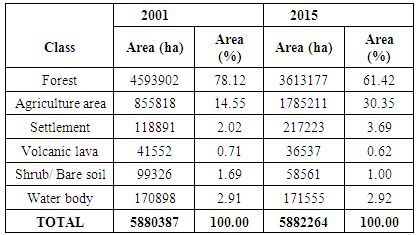
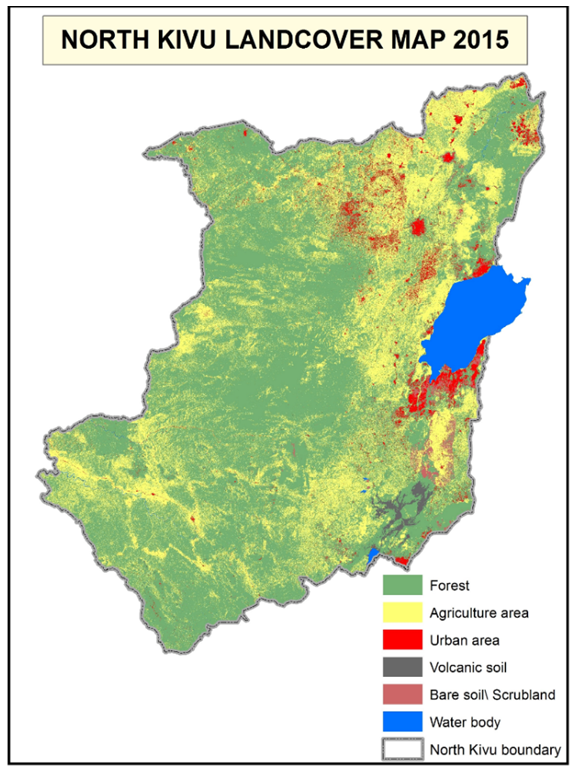
- Using LANDSAT 8 OLI/TIRS and LANDSAT 7 ETM+ six major land cover types viz: Forest, Agriculture, Settlement, Volcanic lava, Shrub/bare soil and Water body delineated as described in Table 3 and illustrated in Figure 3. Comparing the A, B and C maps on Figure 3, the agriculture was the main driver of forest loss in North Kivu province. In 2001 the forest cover of North Kivu was accounted to 4,593,902 hectares (78.12%) and was changed to 3,613,177 (61.42%) in 2015 (Table 3).
|
|
|
4.2. Forest Loss and Deforestation Hotspots
- The study revealed the loss of forest during the period between 2001 and 2015, and 89.66% of this forest cover loss was converted to agriculture area. In the Panama Canal corridor, Ghislain R. [34] found that 86% of forest loss was explained by agriculture expansion. Helmut J. G. and ERIC F. L. [3] found that agriculture expansion is the leading land use change and is associated to 96% of deforestation cases in the whole tropical forest. During a 2002 actor-based survey, Agriculture was reported as the second cause of deforestation after charcoal extraction in North Kivu province and the first cause in all the ten other DRC provinces [35]. However, in the same report agriculture is reported as the main cause of deforestation in Lubero and Masisi territories, North Kivu province.Results obtained by the Getis-Old algorithm allowed identification of cold and hot-spots in the study area. The algorithm indicated the spatial entities (fishnet cells) with high and low values which tend to cluster in a geographic area (Figure 4). This means that the occurrence of grid cells with high or low values, for a specific attribute in the North Kivu fishnet, are surrounded by other cells with high or low values for that attribute. However, for the result to be statistically significant, a Z-score and P-value had to be calculated.
 | Figure 4. Land cover/ use map of North Kivu 2015 |
 | Figure 5. Land cover/ use change map of North Kivu 2001-2015 |
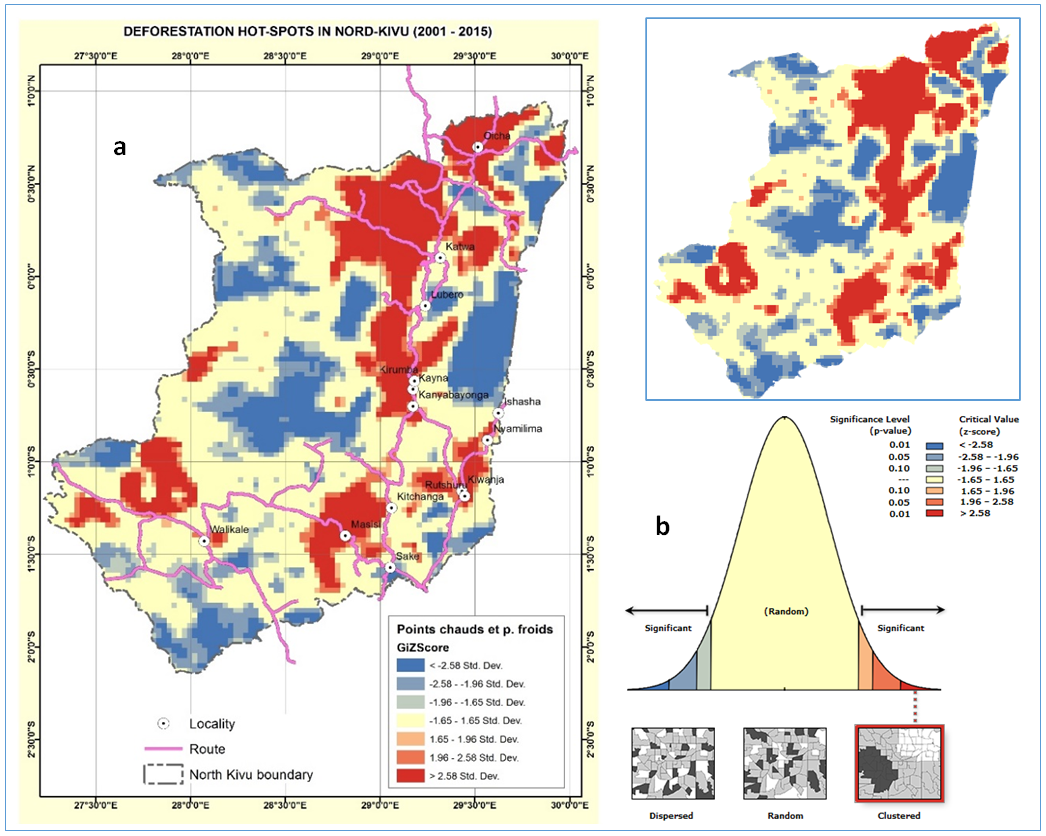 | Figure 6. North Kivu province a) hot and cold-spots and b) Normal distribution of the p-values and z-scores |
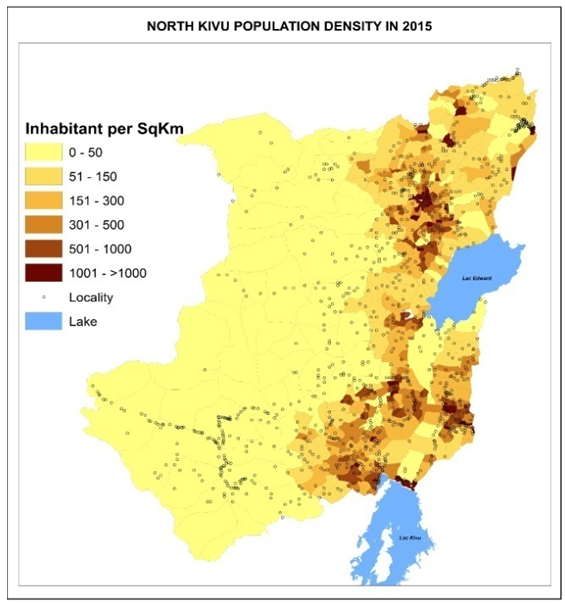 | Figure 7. North Kivu population density per Square Km in 2015 |
4.3. Forest Loss and Gain Driving Forces
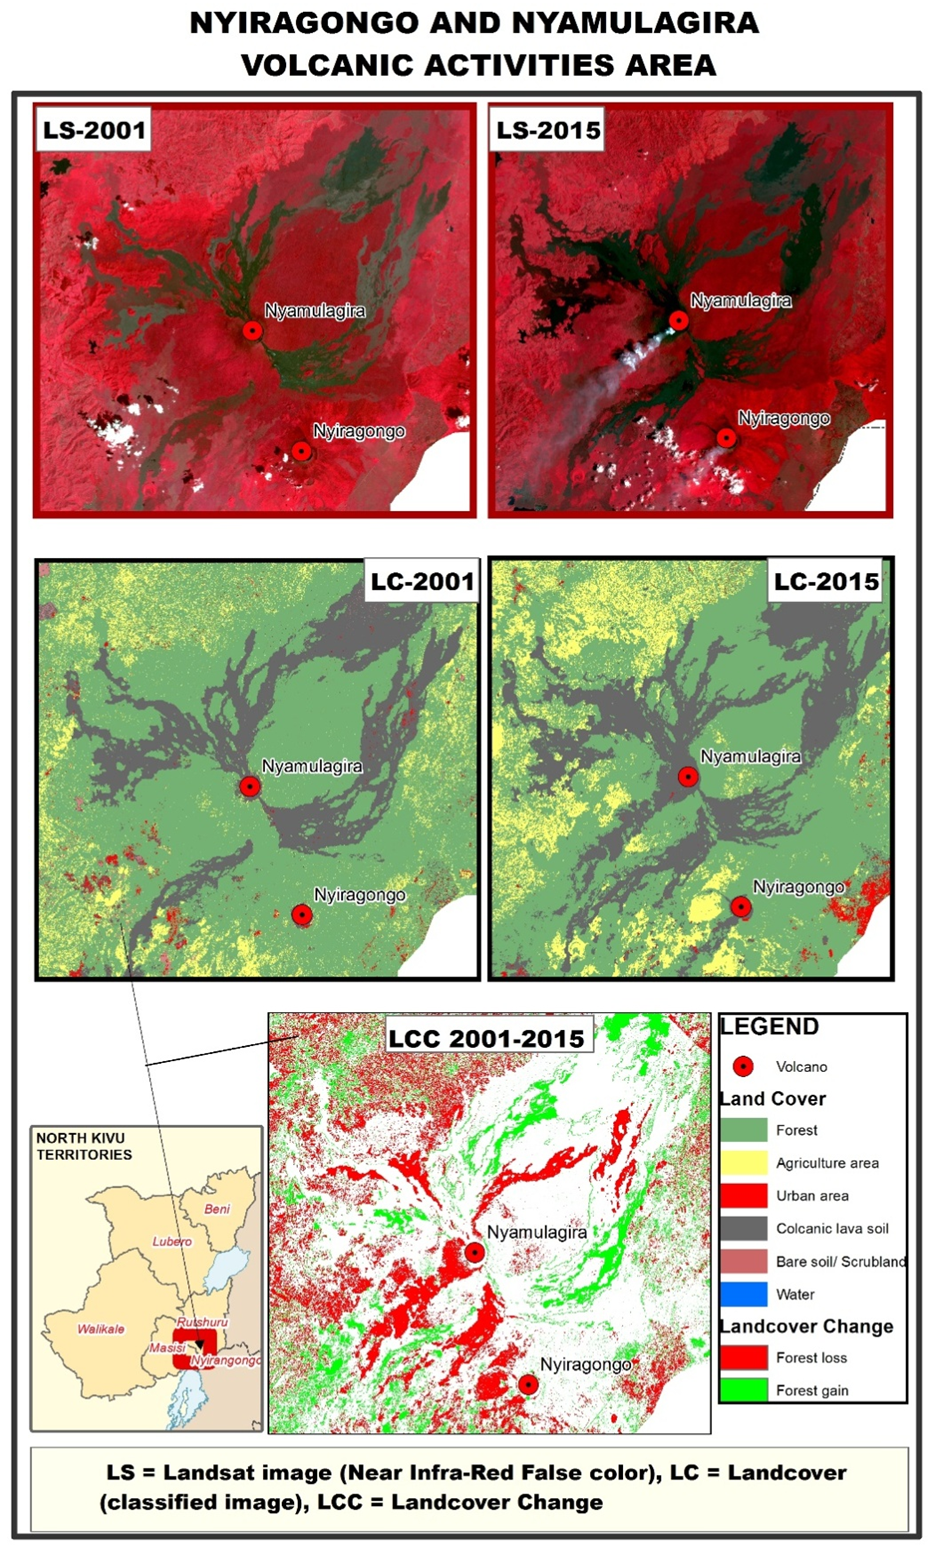
- During the period 1984-2010, the North Kivu population annual growth was 3, 59 percent, the highest of all DRC provinces, except Kinshasa. The population growth dynamics passed from 894,838 capita in 1958 to 6,090,723 in 2010 [9]. In 2015 the number of people inhabiting the province was estimated to 7,754,196 while more than 60 percent relies on agriculture [11]. The overall density which was 15 inhabitants per Sqkm in 1984 increased to 130 inhabitants. Thus, more change occurred in areas with high population density (Figure 7) especially around main cities due to the expansion of urban and agriculture areas. The Figure 7 illustrates change occurred around Oicha city in Beni territory in seven maps with a scale of 1: 65,000. The landcover change map (LCC 2001-2015) shown was detected from landcover maps (LC-2001 and LC 2015) classified using false color Infrared composition of Landsat images acquired in 2001 (LS-2001) and 2015 (LS-2015). Similar situation occurred around many towns where forest cover was converted to urban and agriculture area.Change areas are also located alongside main roads (Figure 8). Forest cover near principal roads is more exposed to deforestation than inaccessible forest areas. Moreover, the same Figure 8 reveals a decrease in settlement area far from the road. This can be explained by insecurity caused by “Mai-Mai Simba” and “Raia-Mutomboki” armed groups, which have been influencing that area. Thus, population is forced to move from isolated settlements toward more populated and relatively secured localities around main roads.
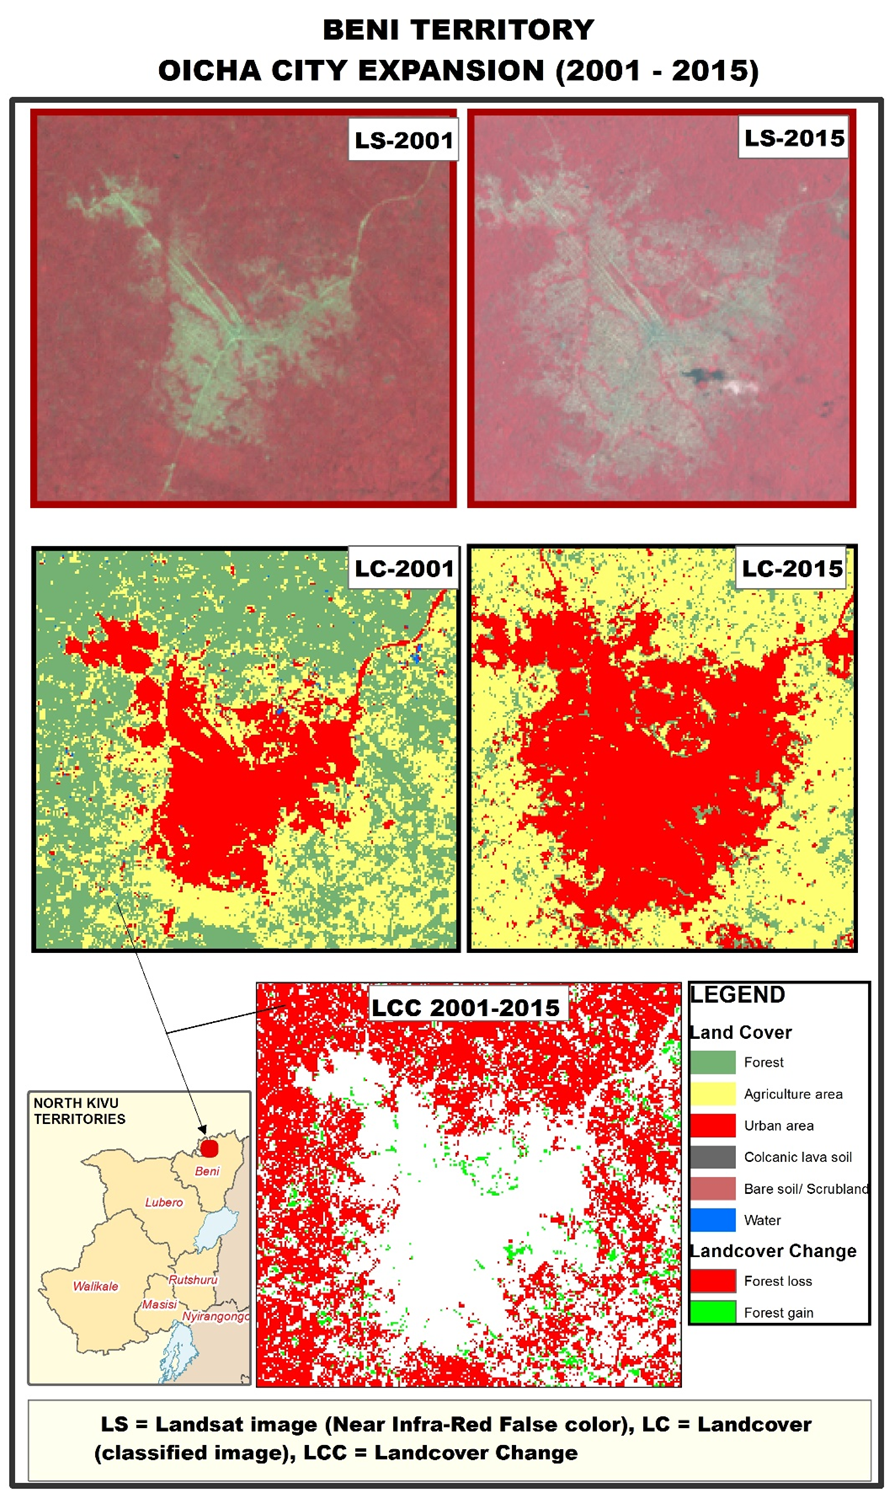 | Figure 8. North Kivu: Oicha city expansion for 2001-2015 periods |
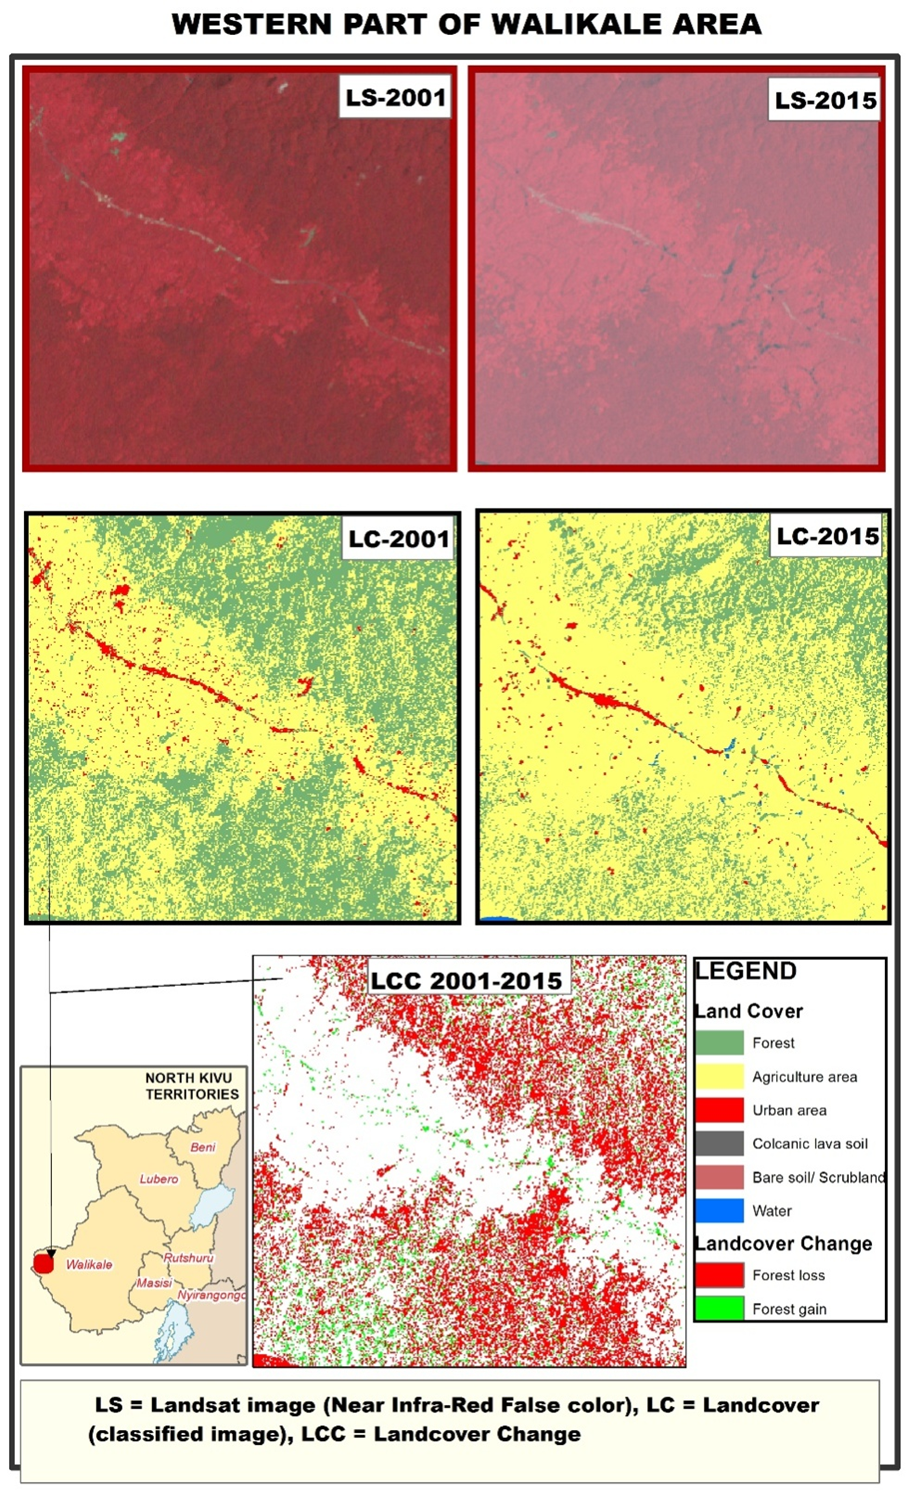 | Figure 9. North Kivu: agricultural land expansion around main road in Walikale territory |
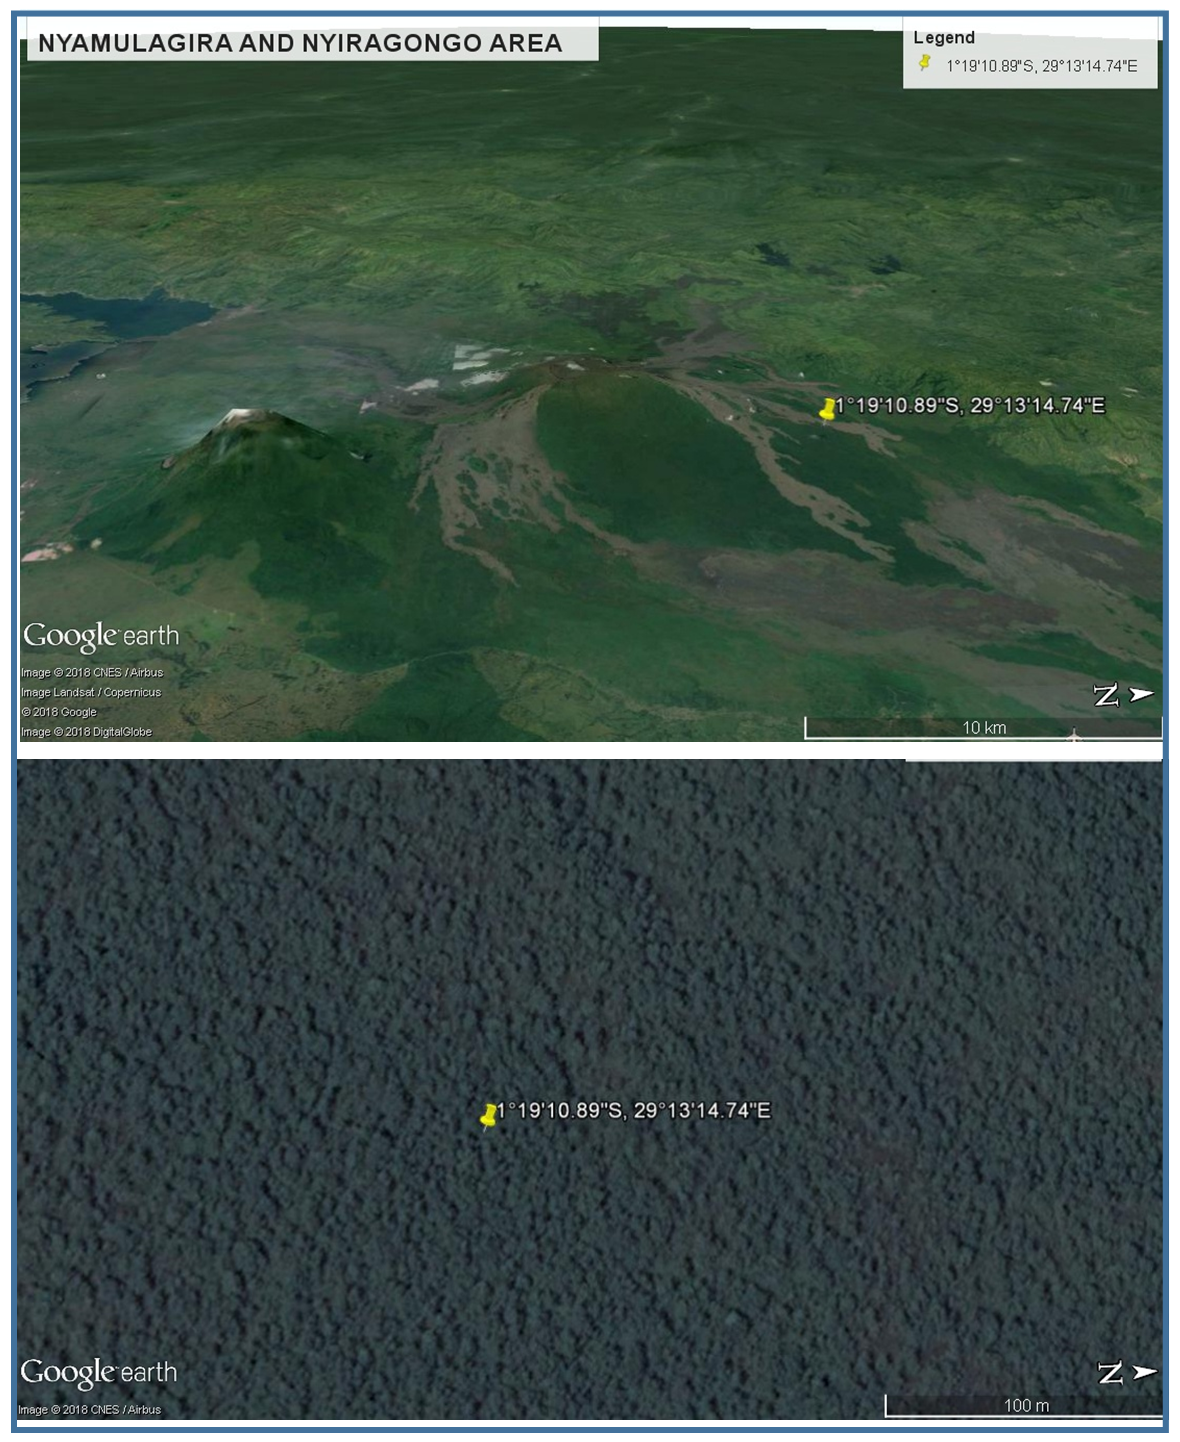
 | Figure 10. North Kivu: change around volcanoes area during 2001-2015 periods |
 | Figure 11. North Kivu: regenerated forest around volcanoes area during 2001-2015 periods |
 | Figure 12. Change in the North-Eastern part of North Kivu during 2001-2015 periods |
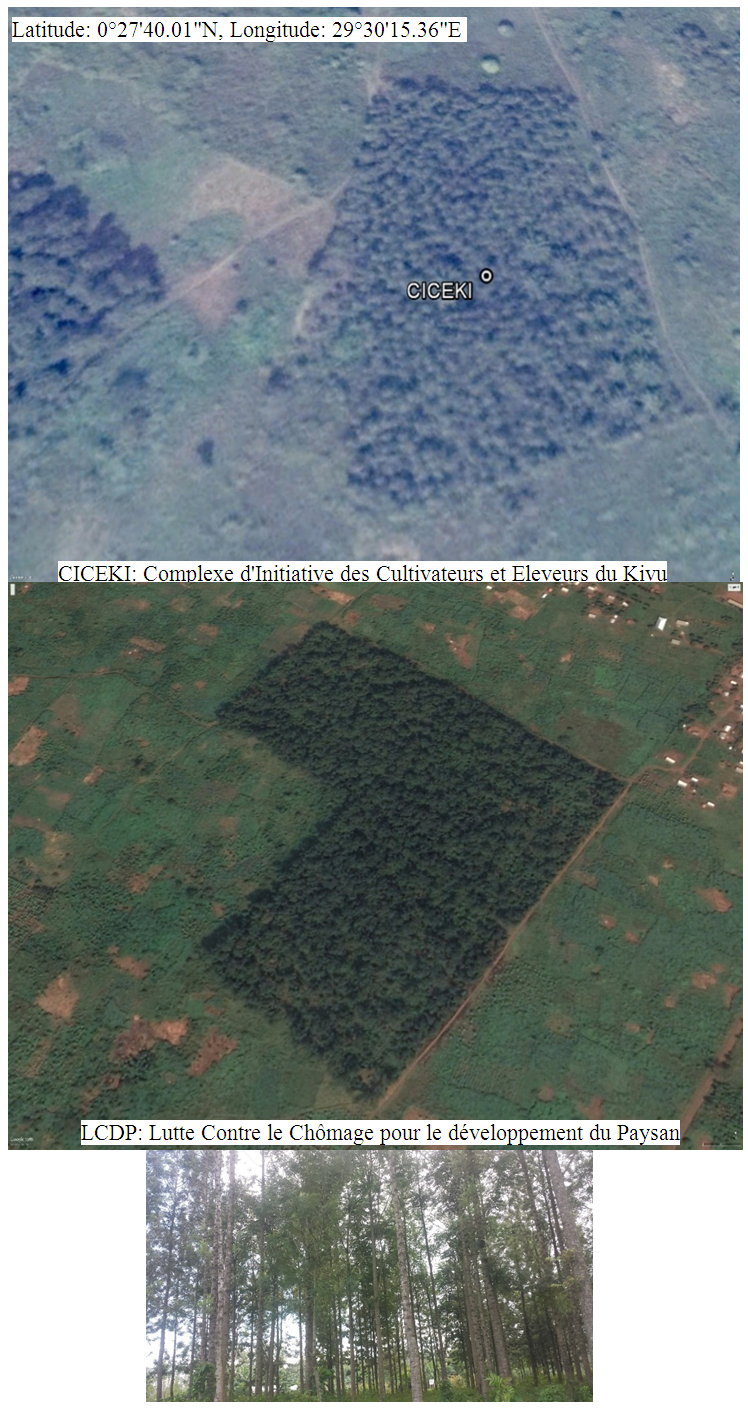 | Figure 13. North Kivu: some planted forests during 2001-2015 period |
5. Conclusions
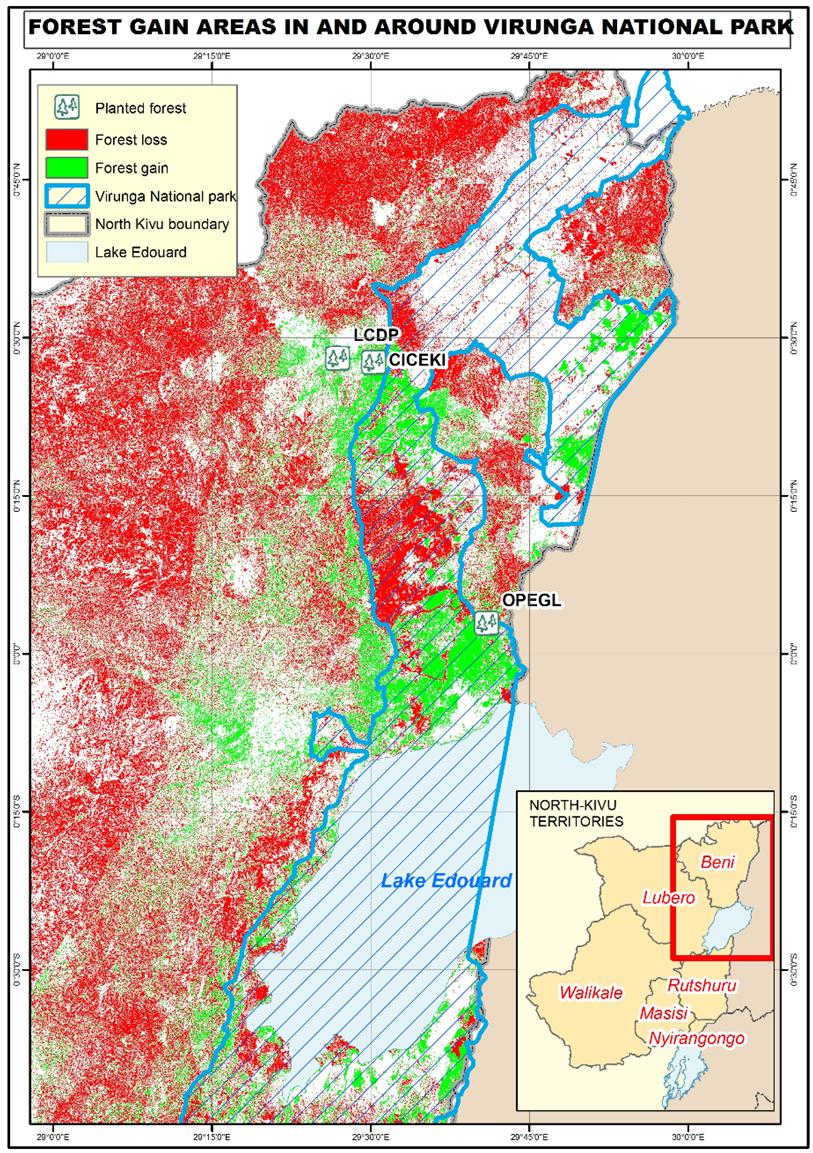
- This study assessed the land use/ cover change and identified the hot-spots in North Kivu province. The study was carried out in the province of North Kivu, Eastern DRC for 2001-2015 period. Using ArcGIS 10.3 and ERDAS IMAGINE 2014 software, Findings reveal the overall change, in reference to the 2001 forest cover, of 1,381,003 ha (30%) for forest loss and 404,380 ha (9%) for forest gain. In 2001 the forest cover of North Kivu was assessed to 4,593,902 ha (78.12%) and to 3,613,177 (61.42%) in 2015.Among the six classes: Forest, Agriculture, Settlement, Volcanic lava, Shrub/bare soil and Water body delineated for the study, agriculture expansion was revealed as the main driver of forest cover loss. Eighty-nine-point six percent of forest cover loss was due to agriculture expansion while 7.56%, 0.81% and 1.96% were due to Settlement, Volcanic lava and bare soil or Shrub expansion respectively. The findings revealed the presence of deforestation hot-spots in the North Kivu province. These hot-spots presence were confirmed using Getis–Ord (Gi*) spatial statistics algorithm. The Moran I spatial autocorrelation returned a P-value of 0.0000 and a Z score of 92. With a P value greater than 0.01 and a Z score greater than 2.58 the hot-spots confirmation is statistically significant with 99% of confidence level. Many of these hot-spots are located along the main roads and major towns in the eastern part of the study area. The study also showed some forest gain reforestation and forest regeneration in the areas around the Virunga National Park. Shifting and burning agriculture techniques should change to intensive agriculture to avoid the observed huge forest cover loss due to agriculture expansion. And the hot-spots regions should be given the first priority for forest conservation activities in the study area.