-
Paper Information
- Paper Submission
-
Journal Information
- About This Journal
- Editorial Board
- Current Issue
- Archive
- Author Guidelines
- Contact Us
American Journal of Geographic Information System
p-ISSN: 2163-1131 e-ISSN: 2163-114X
2019; 8(1): 26-38
doi:10.5923/j.ajgis.20190801.03

Location Allocation Analysis for Urban Public Services Using GIS Techniques: A Case of Primary Schools in Yeka Sub-City, Addis Ababa, Ethiopia
 Abstract
 Reference
 Full-Text PDF
 Full-text HTML
Wondwossen Mindahun1, Bedasa Asefa2
1Department of Geodesy & Geomatics Engineering, Adama Science and Technology University, Adama, Ethiopia
2Department of Surveying Engineering, Debre Berhan University, Debre Berhan Ethiopia
Correspondence to: Wondwossen Mindahun, Department of Geodesy & Geomatics Engineering, Adama Science and Technology University, Adama, Ethiopia.
| Email: |  |
Copyright © 2019 The Author(s). Published by Scientific & Academic Publishing.
This work is licensed under the Creative Commons Attribution International License (CC BY).
http://creativecommons.org/licenses/by/4.0/

The main topic of this study is entitled as Location Allocation Analysis for Urban Public Services Using GIS techniques; A Case of Yeka Sub-City, Addis Ababa, Ethiopia. Yeka Sub-City is geographically found at north-eastern part of Addis Ababa, having dynamic topography. Based on CSA population projection for the year 2016, Yeka Population is estimated 424,217. The 127 primary schools give service to 60095 students enrolled in the same year. The main Purpose of the study is to increase the coverage level of the primary schools in the Sub-City to enhance access of all school age population in the same area. The general objective set to deal with the problem is to make analysis and find results on balancing the distribution of primary schools and demands of the society for the services in the entire area of Yeka. Both qualitative and quantitative approaches are followed with an applied type of research in the study. The effort employed data which comprise empirical and theoretical works of different individuals and organizations. The secondary data are supplemented with primary data for consistent findings. GIS Location allocation analysis technique in network analyst and spatial analyst tools are used. In the result it is identified that schools are not evenly distributed resulting in densely situated around infrastructures such as transport facility, road network and population, Schools are not properly separated from sources of noises, Existing Schools have been adequate for the current demand if they would have been constructed based on plan, Road network of the Sub-City is not properly structured so that it affected the analyses made on the network analyst in GIS.
Keywords: ArcGIS, Network Analyst, Spatial Analyst, Location Allocation (LA), Service Area (SA), Primary school, facility (service), Demand, Location, Yeka Sub-City
Cite this paper: Wondwossen Mindahun, Bedasa Asefa, Location Allocation Analysis for Urban Public Services Using GIS Techniques: A Case of Primary Schools in Yeka Sub-City, Addis Ababa, Ethiopia, American Journal of Geographic Information System, Vol. 8 No. 1, 2019, pp. 26-38. doi: 10.5923/j.ajgis.20190801.03.
Article Outline
1. Introduction
- Public policy makers and city planners need to design mechanisms of providing services especially in developing countries. From the present day situation, where world is facing the rapidly growing population contradictory to unalterable size of land to survive on, there must be a special means of resolving the challenges of providing services and facilities such as schools, health institutions (Clinics, healthcare centers, Hospitals, Ambulance stations etc.), water supply, market centers, power supply, infrastructures, fuels etc. in both urban and rural areas.Education is an outstanding economic and social investment for long-term development, and a vital building block for weathering and recovering from crisis (Global Campaign for Education (GCE), 2010). Since 1990, targeted actions by a number of countries and their development partners have helped to reduce by half the number of out-of-school children around the world. Yet 61 million children today are not in school—and there is abundant evidence that learning outcomes in many developing countries are alarmingly low, especially among disadvantaged populations. This global learning crisis is a major impediment to expanding both individual opportunity and national development (World Bank, 2013). The Global Out-of-School Children Initiative, launched by UNICEF and the UNESCO Institute for Statistics in 2010 to accelerate efforts towards universal primary education by 2015, now operates in 26 countries (United Nations, 2013). Africa is the leading continent to be noticed in which educational problems are devastating. Kevin Watkins (2013) states that, there are still some 30 million primary school-age children out of school one in every four in the region and progress towards universal primary education has stalled. Instead of hitting the Millennium Development Goals (MDGs) target of universal primary education by 2015, the out of school number could rise by 2 million. The combined effects of restricted access to education and low learning achievement should be sounding alarm bells across Africa (http://www.brookings.edu).The political focus of primary education and its related implementation have placed Africa on track to achieve full enrollment by 2015. A significant number of African countries have excelled in this regard through committed policy interventions and adequate resource allocations. Ethiopia had a low initial net enrollment rate (50 percent in 1990), but this now stands at 86.5 percent (2009/2010). This robust progress is based on, among other measures, the construction of classrooms: 16,000 in 2004 and 25,000 in 2008/09, of which 80 percent are in rural areas. In addition, education is emphasized in public policies and prioritized in public spending (MDGs Report, 2011). The market study shows that the present supply gap of education facility at primary level is 1,184 sections and at secondary level 1,116 sections. If additional primary and secondary schools are not materialized the supply demand gap will increase to 1,669 sections for primary school and 1,576 sections for secondary schools by the year 2018 (Addis Ababa City Government, 2002 E.C.). For instance in Ethiopia, the Ministry of Finance and Economic Development (MoFED, 2002 E.C.) quantified, Primary education, tertiary education and technical and vocational training are given high priority in the resource allocation and account for 46.4%, 22.9% and 15.9% of the overall Program cost, respectively. Formal primary education alone accounts for 41.7% of the total Program cost. This shows that primary education is number one priority. Besides, over 50% of the recurrent budget will go to finance formal primary education leaving only 7.4%, 6.8%, and 17.7% to secondary, TVET and tertiary educations, respectively. Other sub-programs of education and administration account only for less than 18% of the total estimated recurrent expense (P. 96).The purpose of proceeding with this research problem is not to elaborate the primary education crisis in our capital but to raise mechanisms on leveling accessibility and coverage so that each primary school is accessible to the student population in the city at proper space with minimum distance cost particularly of the interest area.
1.1. Background of the Research Problem
- The trend of public services delivery upon realistic scientific studies is not yet fully developed in Ethiopia. The demographic explosion in developing world countries has created a tremendous pressure on resources and public facilities (Ahmed M. W. Abdel-Latif, 2007). This paper work particularly aimed at the emphasis on how the formerly constructed primary schools in Yeka Sub-City of Addis Ababa City are seen after location-allocation analysis in demand and service setup; where and how many new schools shall be established to achieve the objectives anticipated in the study; what maximum distance shall be covered by a student to get to the school nearest to him or her etc. Location allocation problem is implemented in ArcGIS software extension of network analyst. Among the problem type to be dealt in this analysis, minimizing impedance problem type is specifically chosen to undergo through existing and newly established primary schools to customer request location in the entire area. Service areas for the school facilities are generated to identify populations that are accessible to the facilities from the others based on the limited distance taken to reach the school destinations. A technique of finding suitable areas for schools using spatial analyst extension tools from ArcGIS is applied to determine the most optimal location of the new schools to be established as a supplemental part of the Location allocation analysis.
1.2. Objectives
1.2.1. General Objective
- The main objective is to make analysis and find results on how to balance distribution of the primary schools in Yeka-Sub-City that provide services for the demands of the society in the area based on the norm that people tend to use more at nearby facilities than distant ones.
1.2.2. Specific Objectives
- × To add new primary schools in the study area so that the transportation cost (distance to the facilities from the demand population) is minimized× To select the most accessible candidate sites from among the added schools such that the longest distance is reduced× To validate location of the newly proposed schools using suitability analysis. × To assess location of existing schools using suitability analysis in Spatial Analyst Tools of ArcGIS extension× To develop justifiable frames of service distribution for government stakeholders or decision makers.
3. Methodology
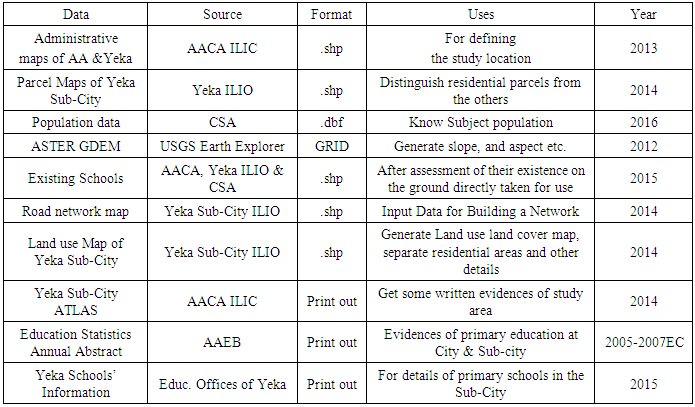
3.1. Details of Data
- As quantified in statistics of 2014/15 academic year by Yeka Sub-City Education Office (2015), 62552 regular students were enrolled in all ages from grade 1 – 8 in a total of 127 primary Schools.
3.2. Location-Allocation of Primary Schools
- The ArcGIS location allocation analysis layer offers only six problem types to answer specific kinds of questions which are minimize impedance, maximize coverage, minimize facilities, maximize attendance, maximize market share and target market share. In this case it is tried to undergo the former one (or Minimize Impedance problem type). Three important input datasets are required for location allocation analysis to work see Fig. 1.
3.3. Finding Optimum School Locations Using Spatial Analysis
- Further analysis is made from the suggested school locations result from the Location allocation and service area analysis as input using the ArcGIS Spatial Analyst extension tool. This is done because in the former methods only rough suggestions are given regarding locations that are recommended to be candidate.
|
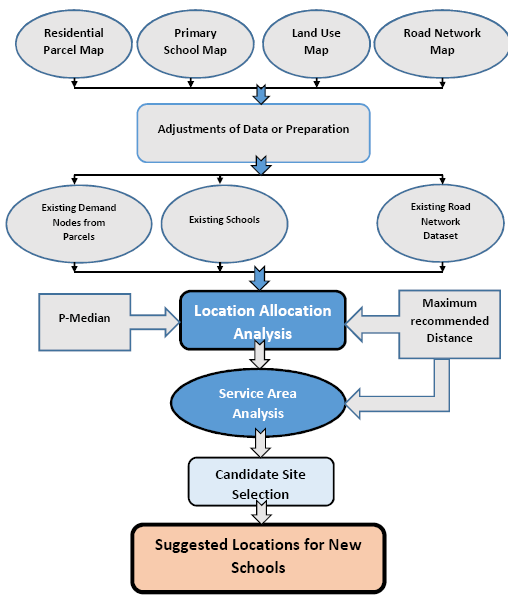 | Figure 1. Methodology Workflow I |
4. Data Analysis and Results
- Data analyses in combination with the results are consequently and clearly provided in this section. The predefined methodologies (Fig. 1 and Fig. 3) are followed for location allocation analysis and finding optimum school sites in spatial analysis respectively to solve locational problems of schools in Yeka Sub-City.
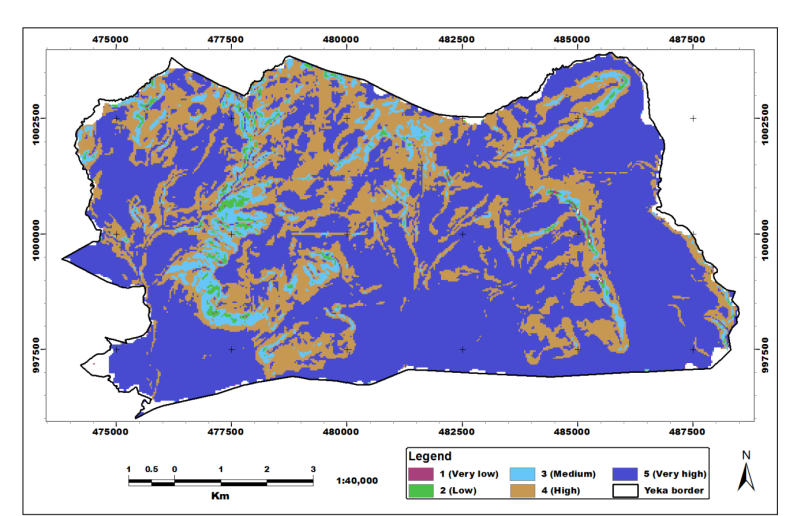
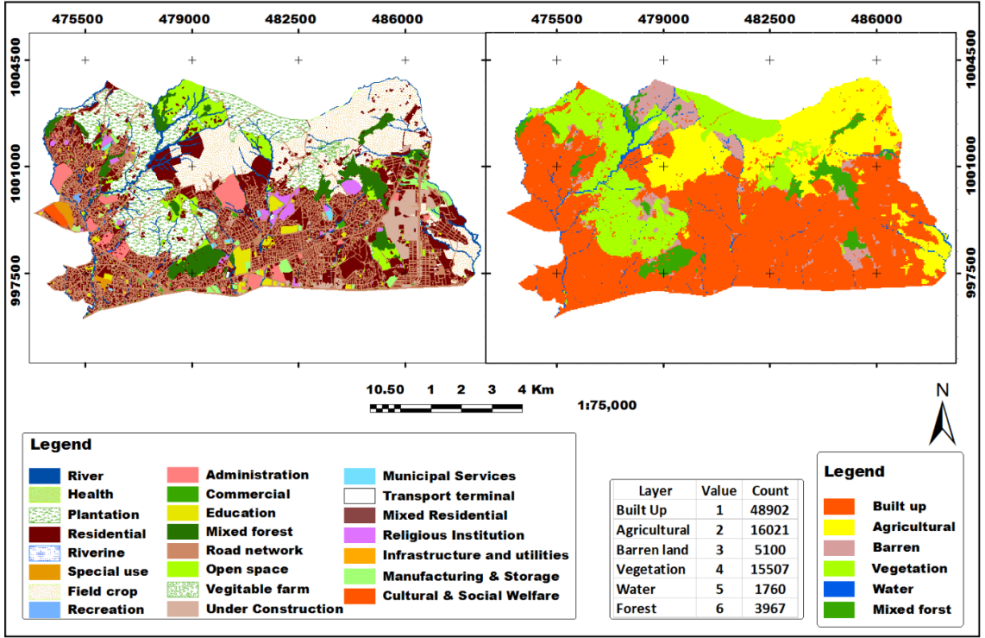 | Figure 2. Land Use Land Cover Map of Yeka Sub-City |
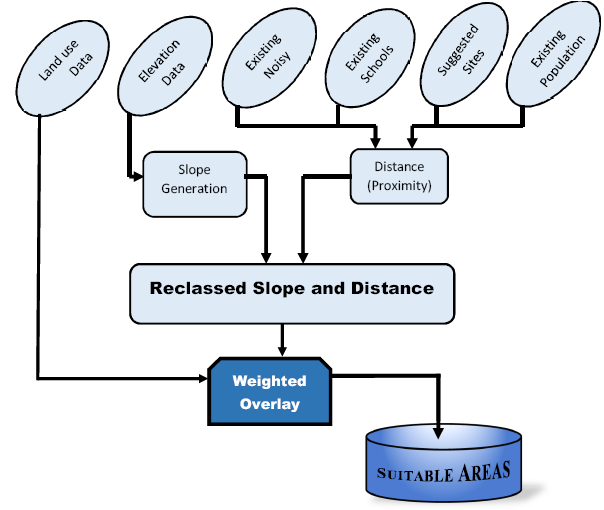 | Figure 3. Methodology Workflow II |
4.1. Distance Based Location Allocation Analysis
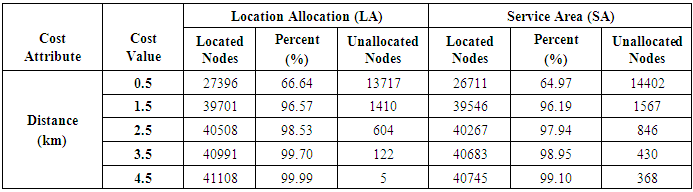
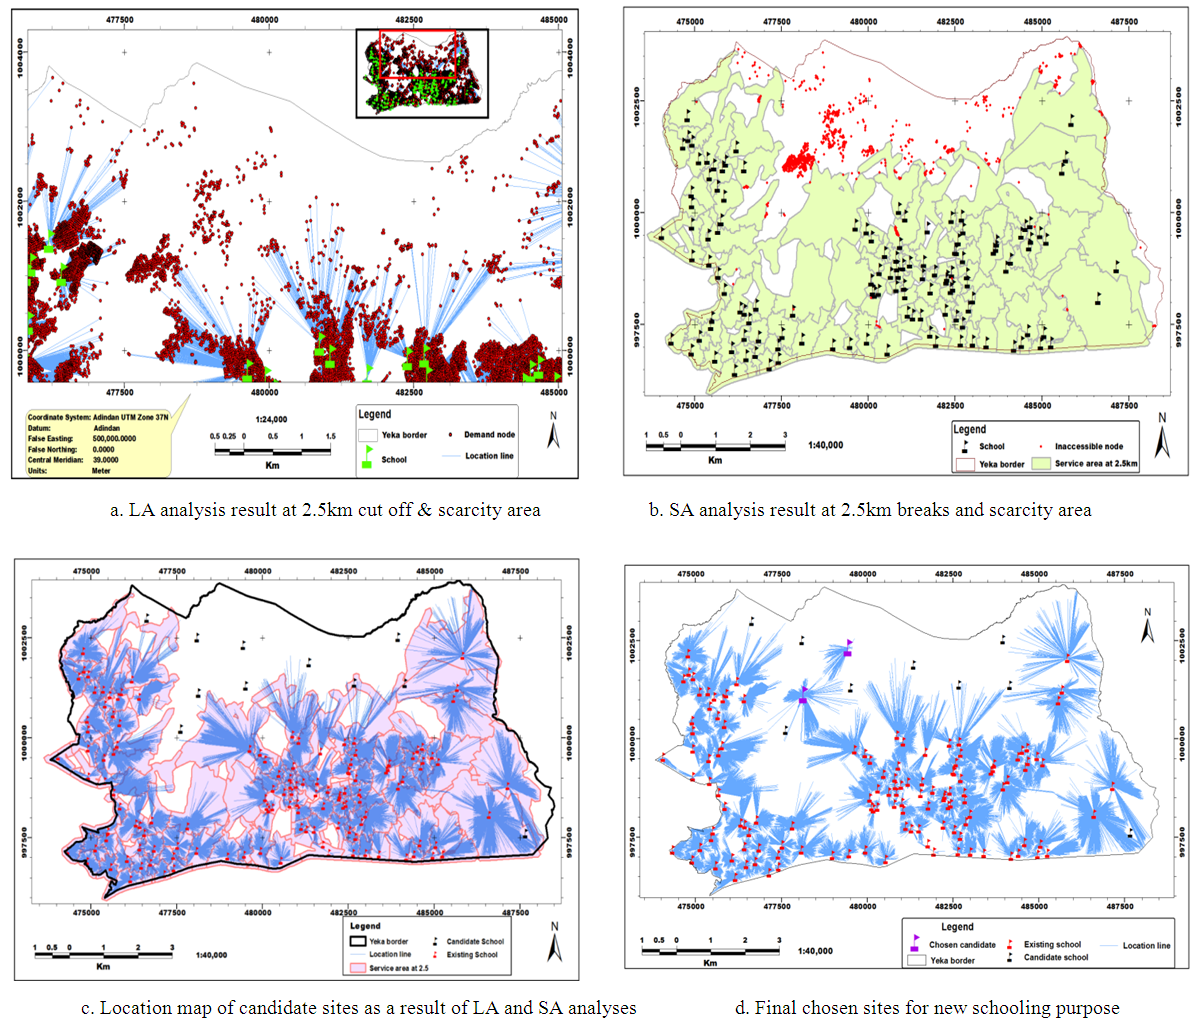
- Distance is a cost attribute used as impedance for the network analysis settings. The analysis investigated the state of demand-facility interrelationship in terms of distance in five scenarios (0.5km, 1.5km, 2.5km, 3.5km, 4.5km distances) and comparison of results are organized to solve location and access problems in order to meet the objectives set at the very beginning of the study.Two of the impedance cut off values 0.5km and 1.5km which are below the allowable search radius 2.5km set by Educational Sector Development plan (ESDP) while the rest two are 3.5 and 4.5 above the radius. On this basis the 0.5km impedance cost is set between the demand nodes and school services and solving for this resulted 27396 demand nodes allocated (66.64%) within the given limit from the school facilities. Similar progress is followed to the rest distance variables and 39701 nodes at 1.5km, 40508 at 2.5km, 40991 at 3.5km and 41108 at 4.5km are located to the nearest schools.From (Fig. 4), each line in blue color with hidden demand node at one of its end and symbolized school node at another shows the gap between the service and the demand node (student home) that attend the service. The lines are at different lengths and those with short lengths describe that the students are close to the services while the longer distances show students are far from the services. It is also observed that nodes with long lines are frequently seen in the central, Northern and Eastern part of the area where primary school provision is low. Th reverse is true where the schools are abundant and as a result the students can get their school near to them. Longer lines show longer distances taken by students along roads from the area to school sites that are in the 2.5km limit. Students beyond this limit are left unallocated to the facility. Therefore based on these in Fig. 6a, the central and northern parts of the sub-city population because they are beyond the set limit, they are left unallocated nodes. This intern implies that there is need for new schools to be built in these areas.
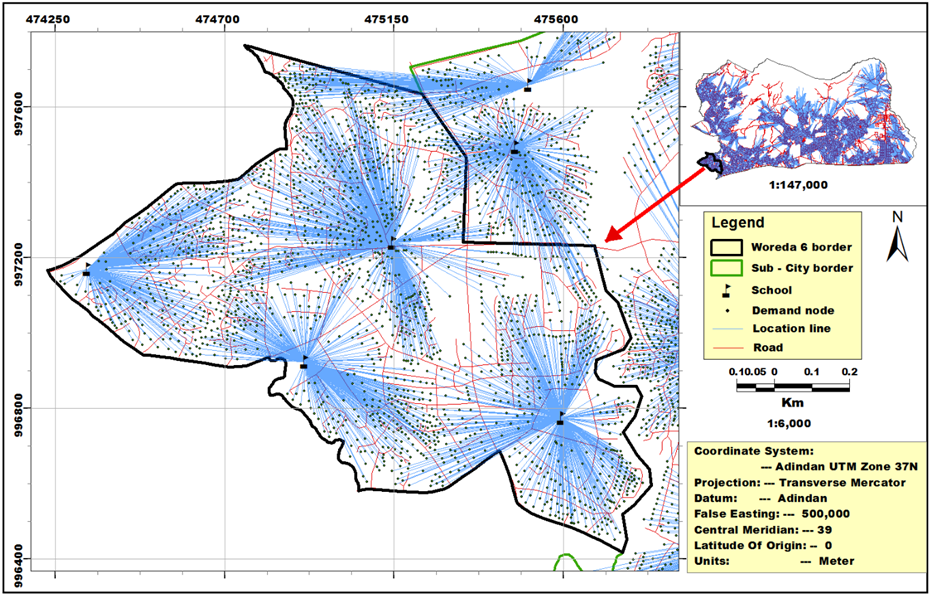 | Figure 4. Detailed LA Analysis Result at 2.5km Impedance Cut Off |
4.2. Distance Based Service Area
- Five scenarios are laid here the same way made for the distance based analysis of location allocation in the above by taking the nationally recommended distance of 2.5 km into consideration. Based on this, 0.5 km for the first, 1.5km for the second, 2.5km for the third, 3.5km for the fourth and 4.5km for the fifth scenario are selected to generate the results. In the 0.5km service area, 26711 population parcels are included from the total that amounts 64.97%. Therefore, it tells that above 3/5 of population can access the existing 127 schools in a walking distance along the preferable road network (road that takes to proximate school destination). Secondly, a 1.5km distance scenario is used and after solving for the problem the result implies there are 39546 (96.19%) population nodes are enclosed in it. The remaining 1567 nodes are left over to the third distance scenario where the median value 2.5km is used as the default break (impedance) value. Then solving for 2.5km outstretched service area, 40267 (97.94%) population nodes are bounded and only 846 nodes are not trapped to the service area that expands 2.5km away from the facility along the existing road network (Fig. 6b).The main objective of analyzing these situations is, to find areas that are left faraway from nearest primary schools in Yeka Sub-City and as a result to introduce additional primary schools in the scarcity area. Finally the results from the two analyses each in five distance scenarios are generalized as follows in Table 2 and bar graph in Fig. 5.
|
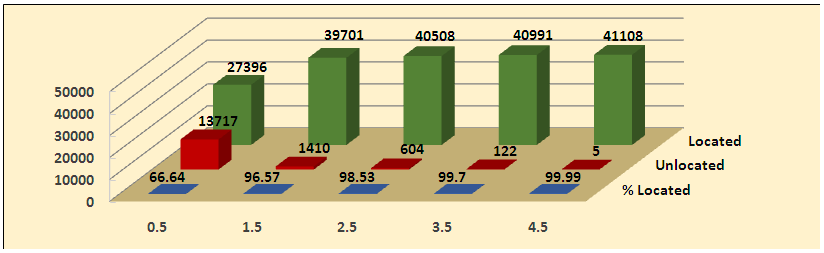 | Figure 5. Graphical Representation of LA distance based Analysis |
 | Figure 6 |
4.3. Optimizing School Sites Using Spatial Analysis
- The chosen sites as a result of LA and SA might be disallowed if they are evaluated in terms of suitability due to elevation (slope) factors, land use land cover factors, noise factors and population factors etc. Therefore studying from these aspects is compulsory to either validate or relocate the sites. The mechanism used for solving this problem is provided by spatial analyst extension of ArcGIS.
4.3.1. First Stage
- Spatial analyses methods of decision making require the input data to be changed in a valid format to come to the desired result. Therefore rasterizing is the process from which participating data are converted from either vector or from raster to a raster form that is required.
4.3.2. Second Stage
- Terrain slope is reclassified into constant intervals of five 1 (0°-17°), 2 (18°-35°), 3 (36°-53°), 4 (54°-71°), and 5 (72°-90°). Intervals those are at high degree values show mountainous or escarpment areas and are not comfortable to build schools. Because of this, areas of such slope values are not selected. On the other hand areas from zero to gentle slope will be the most suitable. This implies suitability increment is the reverse of slope increment. Straight line distance between the listed input datasets is already prepared. Reclassification is made by giving similar intervals (scale values) of slope for each (Fig. 7).
 | Figure 7. Slope in Terms of Suitability |
 | Figure 8 |
4.3.3. Weighted Overlay
- Overlay of several raster inputs using a common measurement scale and weights of each according to its percentage influence is prepared. The reclassed results obtained above are all combined through the weighted overlay toolset from spatial analyst tools (Fig. 9). In addition to this the land use land cover map shown in Fig. 2, is also supplemented. Each land Cover class influence the suitable areas differently from the other and due to this, the land cover classes are also given scale values. Based on this, for this study, Built up Area is given a value of - 1, Agricultural – 4, open Space – 5, Vegetation – 3, Mixed Forest – 2, and water is restricted because water bodies are not suitable to build schools. Land use is given a weight of 10%.
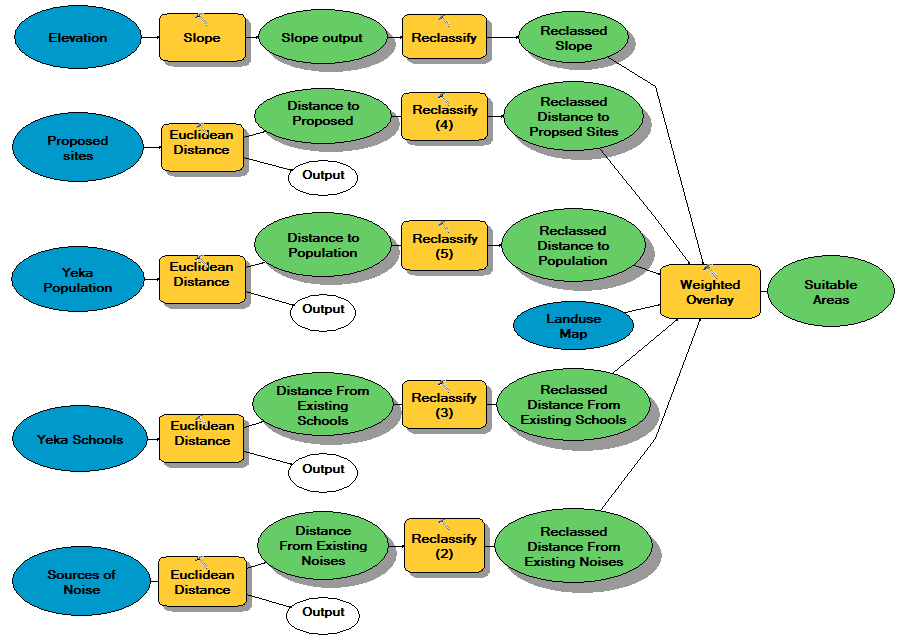 | Figure 9. Work flow of the spatial Analysis |
5. Discussion
5.1. The Location Allocation (LA) and Service Area (SA) Analyses
- The main objective of conducting the research is to find results on how to balance distribution of the primary schools and how to establish the school services near to the population (customer) environment. Various factors are investigated in order to achieve the intended goals and objectives set for this study. It is seen that distribution is not uniform and instead they followed dense patterns of road networks and residential areas. Due to these reasons, on these figures school services are very dense or closely built in southern and western edges of the sub-city while the northern, central and eastern parts where peoples live sparsely are very rare or none. The development of these services should of course follow these dimensions but it does not mean that population groups that are dispersed do not share the service opportunities. Students from these societies are attending their education by covering distances that are beyond the customary in the District of Yeka. This distance variation could be observed from the LA and SA analyses results (Fig. 6) so that there are student population that are yet moving for more than 2.5km from their home to reach school destination whereas there are other areas where schools are established within less than 100 meters apart from each other particularly the Southern and Western edges of the Sub-City. These mainly affected students in lower grades at their official primary school age (children that inter grade 1 at age 7 and grade 2 at age 8 etc.). This intern is against Ethiopia’s role to achieve the UPE and Adult Literacy because of the fact that both children and Adults refrain from attending their education at the right time due to distance cost. ESDP has set 2.5km distance to be the minimum allowable cost value that is recommended to exist between two school facilities nearest to each other. But from the current situation where the limit is not currently practical in the Sub-City, schools are unevenly distributed. The first part of analyses compares results drawn from LA and SA of the same basic data set in five distance scenarios that is 0.5km, 1.5km, 2.5km, 3.5km and 4.5km variables between school services and demand points in Yeka Sub-City. From this, above half (27396 nodes in LA and 26711 nodes in SA analysis) are allocated to the facilities from the 41113 total demand nodes within 500 meters. The limit value (i.e. 2.5km) is used and the result provided 40508 points are allocated which equals to 98.53%. This implies the services can be taken as enough supply for the demand from the population of the Sub-City. In addition they are found close to one another and demand nodes at high density. But the un-allocated demand nodes 604 and 846 for LA and SA respectively are outside this limit. The main intention therefore is to make this population accessible to primary school services within this limit or standard distance. The Last 4.5km search radius reduced the un-allocated points to 5 and 368 For LA and SA respectively. This is achieved after increment of the distance approximately by two folds of the limit. Based on this, the area in which un-allocated population beyond the limit distance lives is identified as Scarcity area.
5.2. The Spatial Analysis
- While some solution sites are more stable (Fig. 10) than others, the results show that almost all locations can be shown to be “optimal” for the school facility location. The optimality of a set of sites obtained from LA analysis only pertains to a general set of zonal demand data and not necessarily to the true underlying demand structure. When optimality is discussed, therefore in relation to the solution of LA analysis using combined data, it has a limited sense. Thus it has clear implications for the use of spatial analysis technique to find the most reliable sites for school depending on the optimized sites by LA and SA analyses.The purpose of using the p-median problem type in LA in this study is to maximize primary school coverage in the focus area so that the walking distance for each student attending school is minimized. This possibly be achieved using Euclidean distances, or network distances as explained in Abdel-Latif’s study in 2007. Abdel-Latif in his research has used the former one but in this study however the Euclidean distance method is used because of its simplicity and beside it helps to find the minimum possible distance and maximize efficiency in solving allocation of demand to facility problem in the vicinity area as to Abdel-Latif explanation.
5.3. The Final Selected Suitable Areas
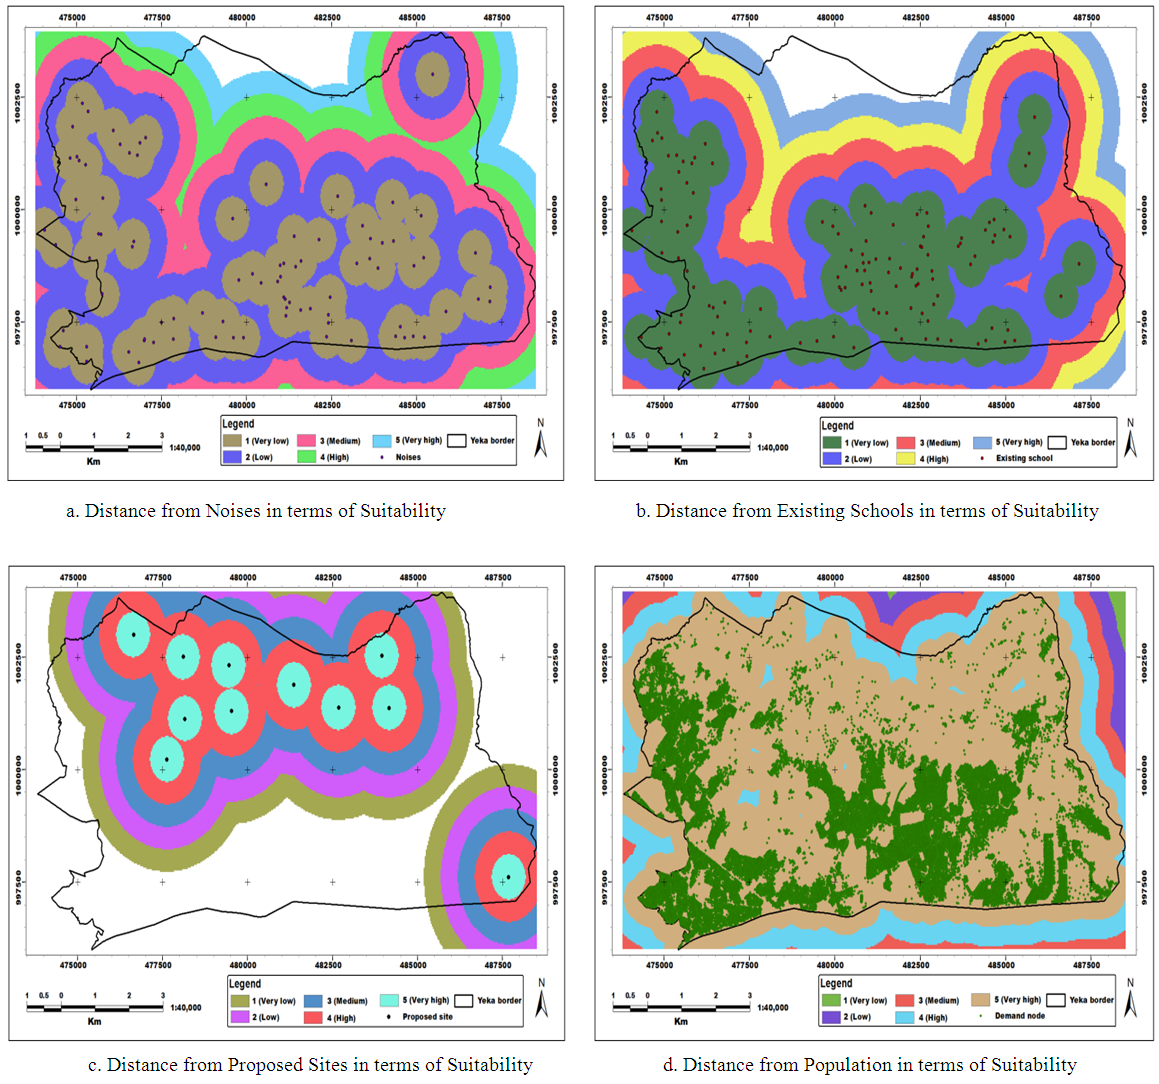
- These are areas that are free from the limiting factors listed above (i.e. slope is safe for constructing houses, land use type is the most preferable for school, distance from noises, distance from existing school, distance from population and distance from suggested sites is the most suitable). This is achieved after each raster output is further reclassified into common measurement scale values in order to let each participant factor have equal influence in creating the most suitable areas. For this study case, as can be observed from the consecutive figured maps displayed above a common measurement scale of 5 is assigned for all participating inputs. Combination of the factors by means of overlay analysis resulted the final output aimed to be acquired. The result is thus affianced or suitable areas for school buildings as displayed below in Fig. 10.
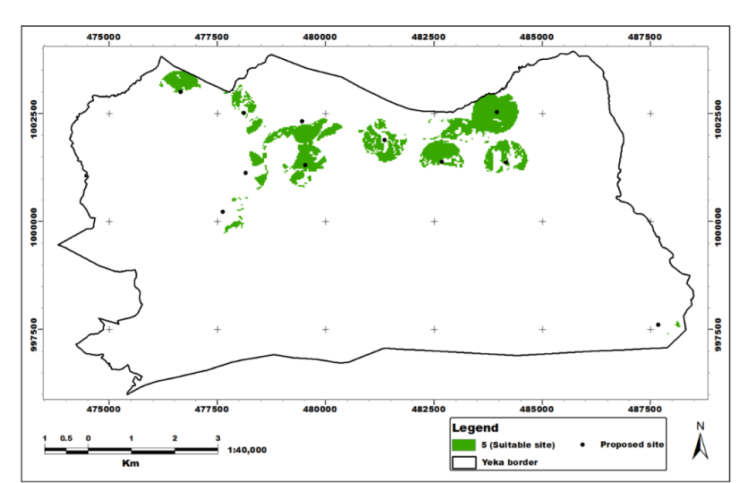 | Figure 10. The Final Output of the Suitable Areas for New Schooling |
5.4. Vulnerability of the Final Selected Sites from Flood Hazard Aspect
- Vulnerability of a particular area to flood of course depend highly on the topographic nature of the terrain. It is broadly discussed in the background chapter of the study area that the topographic surface of Yeka Sub-City is characterized by slopes at various degree of steepness. The focus area of the solution on the other hand is found on almost upper plateau part of the Sub-City where the rain drops rapidly rundown the surface. The flow accumulation probability is very low. Thus it can possibly be decided that almost all parts of the Sub-City is not susceptible to flood hazard. In contrast to this, some neighboring sub-cities like Bole and Kirkos are found on low and flat landscape where the probability of flood incidence is high. Thus Flood hazard risk assessment for Yeka Sub-City is not given any consideration in this study.
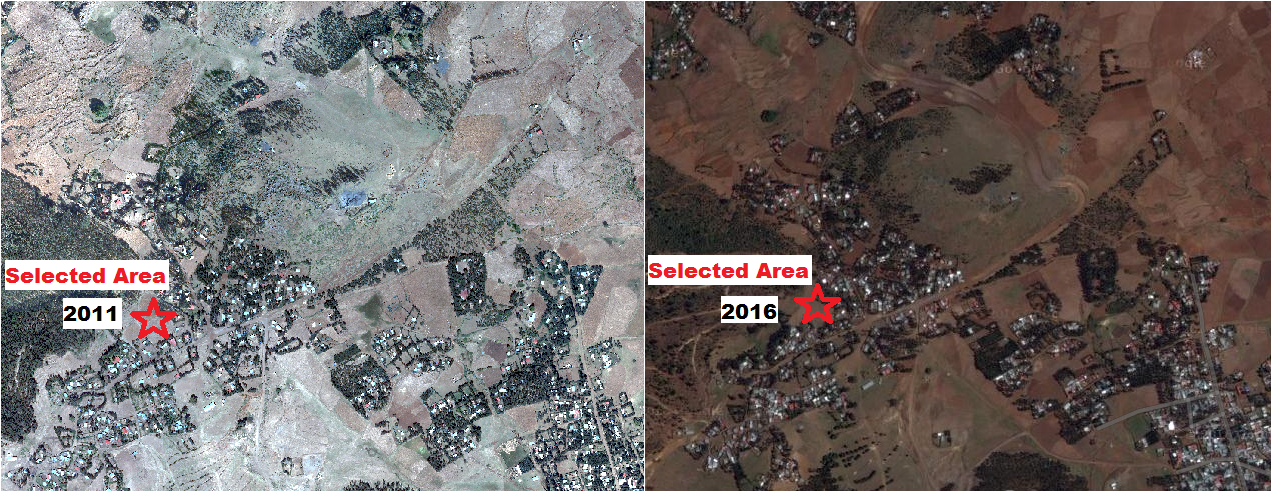 | Figure 11. The past experience of the selected area in the present time |
5.5. The Selected Areas in the Past Time
- It is clear that Addis Ababa is the outgrowing city from the central area of foundation which lies in sub-cities located at the center. Yeka is one of the recently emerging sub-cities of the City which covers northern most part of Addis Ababa. Therefore it is easy to have imagination of the past background of the Sub-City. Urbanization as seen from the emerging situation of the City is taking place through an increase in the number of urban places. This takes place by conquering rural territories and changing the life standards to urban. The current visual surface of the Sub-City particularly the selected area to be suitable for development of the schools because of scarcity shows the area was very rural few years before now. There were no infrastructures as per plan, no transportation means except the traditional, No utilities like electricity and manmade water pipes and tanks.
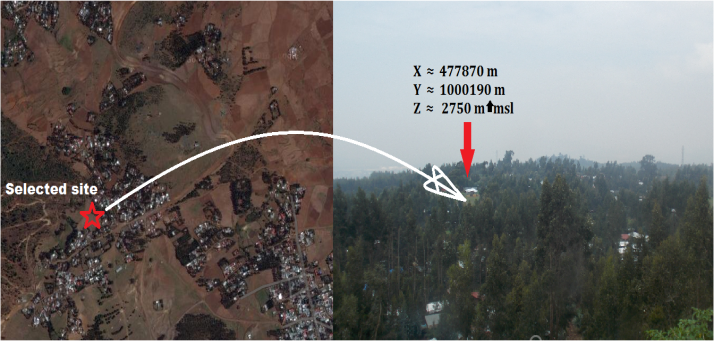 | Figure 12. Approximate vertical and Horizontal View of Sampled Selected Site |
5.6. The Selected Areas in the Current Time
- Nowadays little area is covered by people leaving in settlement being too far from urbanized area of Yeka. Due to this the life style of most of these people is dependent on agriculture. Rural lifestyle is revealed from the environment. No more services like school, water and health, limited road infrastructures with no transportation facility and utilities such as electricity and telecom service. But Number of inhabitants in the settlement that need supply of these services is increasing.
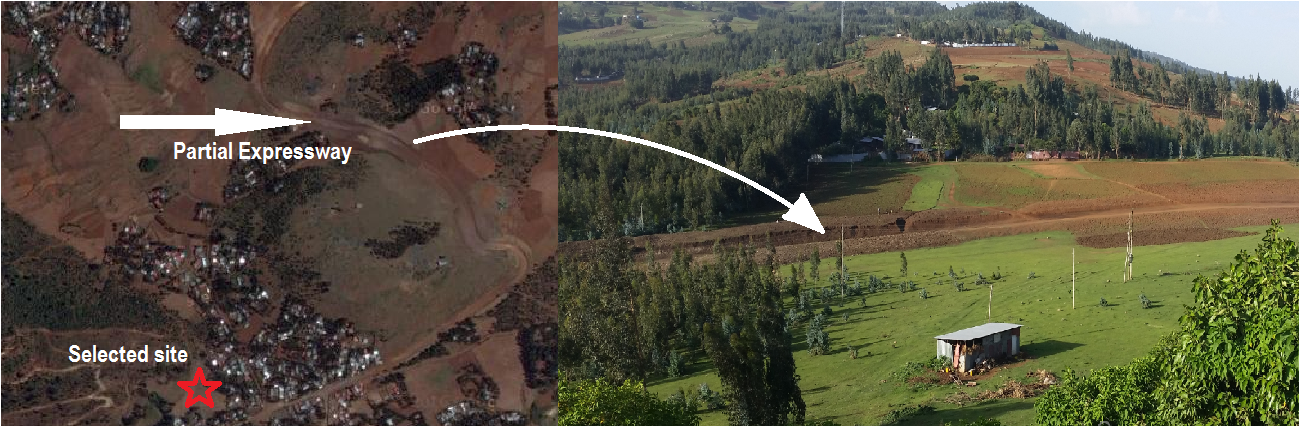 | Figure 13. Selected Site with Road Infrastructure |
5.7. Future Point of View of Selected Areas
- The area is going to be developed in infrastructure especially road according to the structural road plan prepared at City level. In addition to this, a site is selected for construction of a condominium houses for city residents. This intern increase value of the land and therefore the future chance of existing free spaces to be covered by different economic activities will be high.In the research work the author combined two Location finding methods to identify the best location of new primary schools services. The first approach is combined LA and SA modeling analysis which is used to identify candidate sites and highlight approximate or chosen location from the candidate sites for new schools in the underprivileged area, while the second approach is spatial analysis technique of optimizing and relocating the chosen candidate sites in the first approach as well as examining the existing ones for predicting the future. Of course there might be several techniques of introducing such services and other social common goods in the community. But the researcher found these techniques easily help towards finding better result in the problem solving procedures. For instance the study conducted by Abdel-Latif (2007) comprises Multi-criteria Modeling for identification of the candidate sites for principal schools in an urban area and the second approach to identify the optimum sites among the candidate sites chosen in the first approach is location allocation modeling. The weakness in this research is the methodology could not be able to locate the demand population to the school services on the basis of the capacity of the services and interests of the demands whereas the methodology used by Abdel-Latif is the distance calculations depend on the proximity of nodes to actual demand points as per the researcher’s description. Apart from the drawbacks indicated, application of the research methodology is not only used for establishment of primary school services but also for distribution and evaluation of other related urban public services such as hospitals, public healthcare centers, warehouses, market centers and other public goods etc.
6. Conclusions
- LA and SA analyses result indicated in Fig. 6 and series of suitability analyses show that within distance cost of 2.5km more than 97% of the school population are accessible to school services currently existing in Yeka. There is no planned mode of school distributions in the demanding environment of the community so that schools are highly concentrated at infrastructure and utility filled areas where as rare number of schools are seen in other areas of population. This situation intern caused some parts of the population remain unreachable while the others are bounded by high potential of coverage and accessibility.Additional School facilities are required in the northern parts of Yeka Sub-City whose cost attribute values (distance and time) are beyond the recommended. Area that surrounds the proposed site locally known as Danse or Wello Sefer is partially populated and needs developments of infrastructures, utilities and social services such as health, water, public transport along with school requirements. From evidences seen on the geographical location of schools and random conversation the researcher made with school community, there is no firm separation of schools from sources of noises recognized in Ethiopian educational standard. Therefore city government is responsible to facilitate religious primary schools that provide regular education by providing separate area for schooling and on behalf, taking the nearest extra land portions owned by Religion Centers. It is apparently that GIS analysis has shown how much miss-planning of primary school locations along the populated community and can effectively help MoE decision makers to take an immediate action towards distribution of primary schools and the urgent needs for either establishing new schools or relocation of others to provide complete services and easy accessibility to the community. And Therefore GIS based LA and Spatial analysis are the best methods of finding locations that are most suitable for new school sites and other related public services. Governments can consider such scientific studies before the area is developed to districts, towns and cities etc. Road network available in the Sub-City is not uniform and as well at very low standard. In the ArcGIS special function, one of the main inputs for network analyst is road network. This could negatively affect the LA and SA analysis because the road network in Yeka Sub-City is irregularly developed. This created a big disorder in locating demand nodes to nearest facilities.