Bedasa Asefa1, Wondwossen Mindahun2
1Department of Civil Engineering, Debre Berhan University, Debre Berhan, Ethiopia
2Department of Surveying Engineering, Debre Berhan University, Debre Berhan, Ethiopia
Correspondence to: Wondwossen Mindahun, Department of Surveying Engineering, Debre Berhan University, Debre Berhan, Ethiopia.
| Email: |  |
Copyright © 2019 The Author(s). Published by Scientific & Academic Publishing.
This work is licensed under the Creative Commons Attribution International License (CC BY).
http://creativecommons.org/licenses/by/4.0/

Abstract
Floods are probably the most recurring, widespread, disastrous and frequent natural hazards of the world. However, human activities in many circumstances change flood behavior. Kewet District is one of the most severely flood affected areas in Southeast Amhara region in general and Robit Catchment in particular. Hence, in order to manage such problem, a complete understanding of hazard identification and risk assessment is very crucial. Therefore, the present study was carried out to assess the flood risk in Kewet District with the application of Multi Criteria Evaluation (MCE) technique in GIS environment. To do this causative factors were developed in the GIS and Remote Sensing environment. The findings of the study revealed that 37.62% of the District is under high and very high (extreme) flood risk. Thus, the study will help the concerned authorities to formulate their development strategies according to the available flood risk to the area.
Keywords:
Flood, Hazard, Risk, GIS, Remote Sensing, MCE, Kewet District, Robit Catchment
Cite this paper: Bedasa Asefa, Wondwossen Mindahun, Geospatial Based Flood Risk Assessment: The Case of Kewet District, Amhara Region, Ethiopia, American Journal of Geographic Information System, Vol. 8 No. 1, 2019, pp. 1-10. doi: 10.5923/j.ajgis.20190801.01.
1. Introduction
According to DPPA (2006) topographically, Ethiopia is both a highland and lowland country. It is composed of nine major river basins, the drainage systems of which originate from the centrally situated highlands and make their way down to the peripheral or outlying lowlands. The country experiences two types of floods: flash and river floods. Flash floods are the ones formed from excess rains falling on upstream watersheds and gush downstream with massive concentration, speed and force. The recent incident that the Dire Dawa City experienced is typical of flash flood. On the other hand, much of the flood disasters in Ethiopia are attributed to rivers that overflow or burst their banks and inundate downstream plain lands. Due to the rapid increase of population in Kewet District, people are exploiting natural vegetation and extending cultivation, which have led to land degradation and deterioration of the ecosystem. As a result, the area has become susceptible to erosion and flood events. Most rivers as well as their numerous tributaries in the Kewet District initiate their courses from relatively higher elevations and the immediate Catchment areas are poorly covered exposing the flat areas to heavy flood during the rainy season. Geographical Information Systems (GIS) is one of the techniques that can be used flood level forecasting and management in order to assist in the reduction of human and economic losses through the delineation of the areas at risk of being flooded. This was in mind, this study was conducted to assess the flood risk of Kewet District by using multicriteria evaluation technique in Geographical Information Systems (GIS) environment.
2. Statements of Problem
Soil erosion, land degradation, vegetation loss, over utilization of fuel wood and ground water pollution, exotic weeds and trees and rainy season flooding are some of the environmental problems in the Kewet District and its surrounding are facing. Accordingly, rainy season flooding is one of the major environmental problems of the people living in Robit Catchment. High flood, which is normally due to the intensive rainfall in the up lands of the Catchment, steep slopes and low infiltration capacity of the ground surface, is a major threat to the people living down in Kewet District. Kewet District is totally lies in the Robit Catchment. The District is found in the downstream part of the Robit and Jewha rivers. Overflow of these rivers frequently flooded this District than other Districts in the Catchment, and therefore the District selected for detailed flood hazard and risk study. Overflow of rivers in Kewet District has affected and displaced about 900 people in Kewet District (UNOCHA, 2006). Especially during the rainy season (June-September), the Robit, Jewha, Sawor, and Kobo rivers as well as their numerous tributaries forming the Kewet District’s drainage systems carry their peak discharges. Some people said that several months of excessive rain has flooded rivers and stranded families in low-lying areas. While others said it is severe environmental degradation of specially the highlands that cause floods of this District. This issue needs research in order to design long lasting solutions for the safety of the population and the natural environment as well. Despite the aforementioned problems, assessment and analysis of flood hazard and identification of potential flood risk areas in the Kewet District is a timely issue for appropriate management interventions to tackle the major causative factors at their specific locations. Therefore, this research attempted the relevant database in a spatial framework to evolve a flood risk map for Kewet District in particular and flood hazard map Robit Catchment in general with the application of Multi Criteria Evaluation (MCE) technique in GIS environment.
3. Objectives of the Study
The general objective of this study is to assess the flood risk in Kewet District with the application of Multi Criteria Evaluation (MCE) technique in GIS environment. The specific objectives in connection with the above general objective are to:ü develop factors controlling flood hazard of Catchment and flood risk in the study areaü develop flood hazard map of the Robit Catchment and study areaü develop flood risk map of the study areaü identify which kebeles of Kewet District are susceptible to flood hazard and riskü Recommend prevention strategies and techniques for the recurrent flood risks.
4. Materials and Methods
4.1. Materials
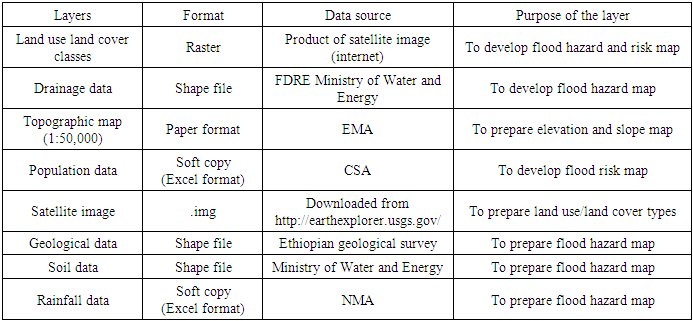
The data and their sources used to generate flood hazard of Robit Catchment and flood risk map of Kewet District are reported below (Table 4.1).Table 4.1. Data and their sources
 |
| |
|
4.2. Software
Software used in this study is selected based on the capability to work on the existing problems in achieving the predetermined objectives. Hence, software package like ERDAS 9.2 was used for image processing activities on satellite images for the preparation of landuse/landcover types. The factor map development was carried out using ArcGIS10 software package. The factors that are input to for multi-criteria analysis should be preprocessed in accordance to the criteria set to develop flood hazard analysis. So using Spatial Analyst, some relevant GIS analyses were undertaken to convert the collected shape files. Eigen vector for the selected factor was computed using Weight module in IDRISI32 software.
4.3. Methods
Flood risk of the District was analyzed from the following general risk equation Shook (1997).Risk = (Elements at risk)*(Hazard*Vulnerability)Considering the degree of loss to be total for the study area, the vulnerability is assumed to be one. Finally to generate flood risk map of the District, elements at risk layer (land use/landcover and population density) and the flood hazard map were overlaid using weighted overlay analysis technique in Spatial Analyst tool of ArcGIS10 environment. The general workflow showing the methodology to delineate flood hazard and flood risk area explained in the Figure 4.1.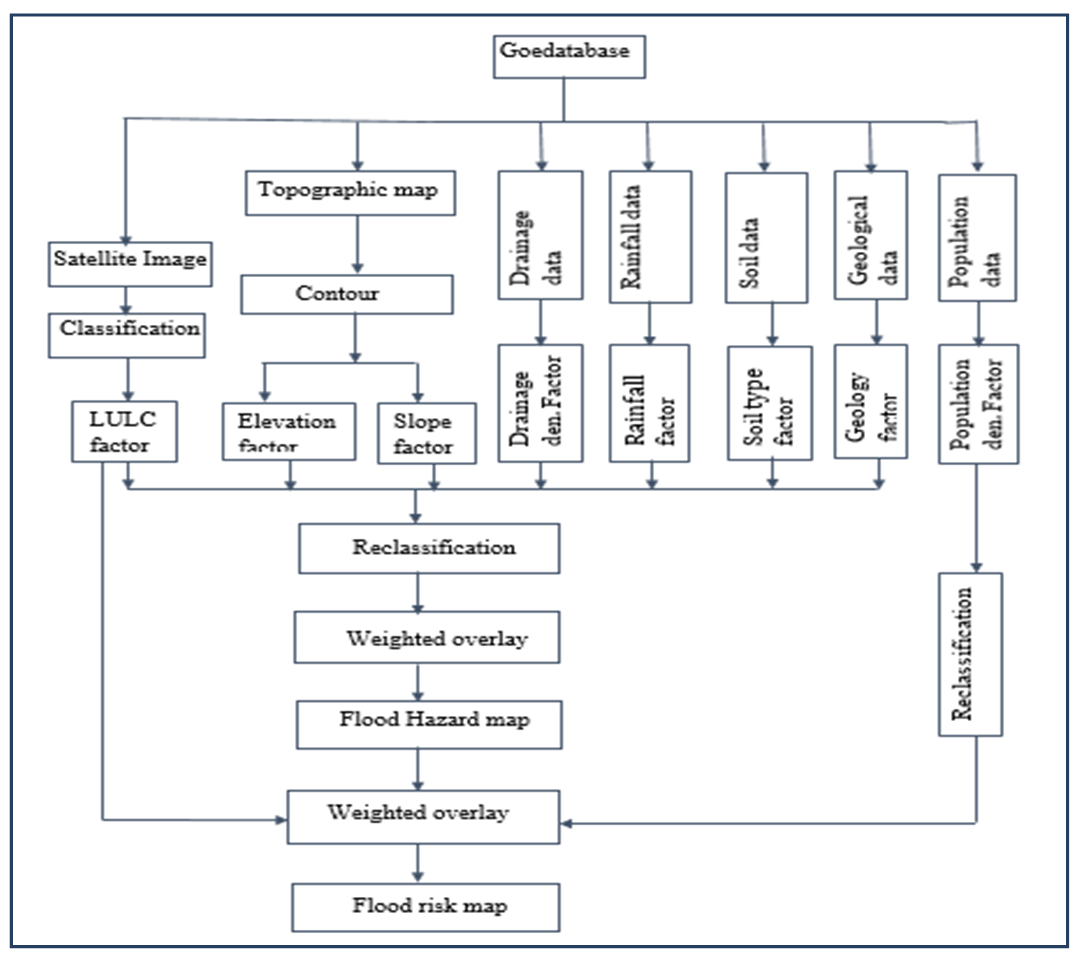 | Figure 4.1. Technological scheme of research work |
5. Data Processing and Analysis
5.1. Introduction
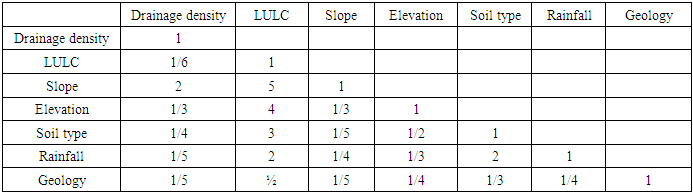
In order to generate flood hazard and risk map, eight interrelated components of the environment were used as input data sets (factors). Prior to combining the factors, weights have to be given based on Satty’ s Analytic Hierarchy Process (AHP), where a pair-wise comparison matrix will be prepared for each map using a nine point importance scale (table 5.1). Weighting is used to express the relative importance of each factor to other. The larger the weight, the more important is the factor in overall utility. The relative comparisons between the eight data layers were performed by asking experts comprising of hydrologists, engineers, end-users and reviewing of literature to give the assessments and judgments regarding the variables related to flooding and their significances in terms of weights.The Eigen vector of the weight of the factors was computed in IDRISI32 software in Analysis menu Decision Support/ Weight module as shown in appendix 1. It also calculates consistency ratio that shows if the given pair-wise weights are accepted or if another arrangement is necessary. The comparison conducted indicated that highest weighting for the slope data layer followed by the drainage data layer, elevation data layer, rainfall data layer, soil data layer, land use / landcover data layer and geology data layer.Table 5.1. The Pair Comparison Matrix of the factors affecting Flood hazard
 |
| |
|
The computed the eigenvector of weights is: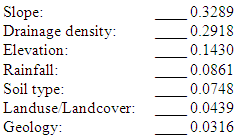 The critical ratio of the calculated Eigen vector is 0.05 which is acceptable.The computed Eigenvector of weighted is used as a coefficient for the respective factor maps to be combined in Weighted Overlay analysis in Arc GIS environment for Flood hazard assessment, whereas in Flood risk assessment all the factors remained to be equally important in Weighted Overlay.
5.2. Factors Development
Before the factors are merged in weighted overlay analysis, all the input parameters were made to be uniformly scaled. In addition, all the factors have been classified which ranging in accordance with their influence to the flood susceptibility and all the parameters have been reclassified to a similar scale values.
5.2.1. Drainage Density
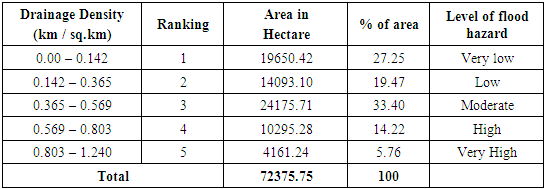
Drainage is an important ecosystem controlling the flood hazard as its densities denote the nature of the water. This means that the higher the density, the higher the Catchment area is susceptible to flood, resulting inundation at the lower grounds (Strahler, 1999). Drainage networks of the Catchment were collected from FDRE Ministry of Water and Energy. And using the spatial analyst, line density module, drainage density of Robit Catchment was calculated. The drainage density layer was further reclassified in five sub-groups using the standard classification Schemes. Areas with very high drainage density are categorized as higher rank because of an area with a higher drainage density is very highly affected by flood and those with very low drainage density were categorized as lower rank because an area with a lower drainage density is very lowly affected by flood as depicted in the table 5.2. Table 5.2. Reclassification of drainage density of Robit Catchment
 |
| |
|
5.2.2. Slope
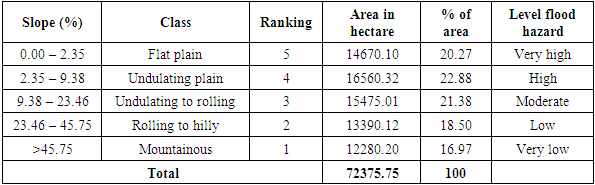
Table 5.3. Reclassification of slopes Robit Catchment
 |
| |
|
Slope play an important role in governing the stability of a terrain. Slope has a dominant effect on the contribution of rainfall to stream flow. It controls the duration of overland flow, infiltration and subsurface flow (Krumbien, 2002). The slope of the Robit Catchment is derived from a 20 meter contour interval feature class which is digitized from topographic map of 1:50,000 scale and further rectified in GIS environment. This feature was converted to 3d shape file using 3D Analyst in convert facture to 3D module by interpolating contour using an attribute as a source. The slope raster layer was further reclassified in five sub group using standard classification schemes. The reclassified slope is given a value 1 to 5 with the higher value, 5 showing high influence in resulting very high flood rate, while the lower value, 1 showing very low influence in resulting very low flood rate. Therefore, the slope classes having less values was assigned higher rank due to almost flat terrain while the class having maximum value was categorized as lower rank due to relatively high run-off.
5.2.3. Elevation
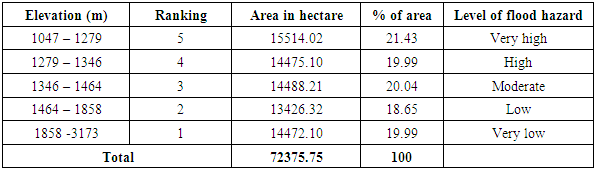
Elevation, as an intensifying factor, plays an important role in flood severity and for the determination of a flood prone area (Krumbien, 2002). The elevation of the Robit Catchment is derived from 20-meter interval contour feature class which is digitized from the topographic map 1: 50,000 scale and further rectified in ArcGIS environment. This feature was converted to 3d shape file using 3D Analyst in Convert feature to 3D module by interpolating contour using an attribute as a source. The elevation raster layer was further reclassified in five sub groups using standard classification schemes. In this classification process an area at lowest elevation is strongly affected by flood and hence ranked to 5 while an area at relatively higher elevation is the least to be affected by flood and hence ranked to 1. Table 5.4. Reclassification of elevation Robit Catchment
 |
| |
|
5.2.4. Land Use/Land Cover
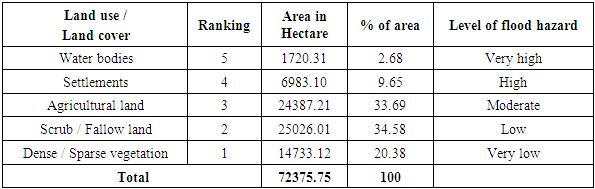
Table 5.5. Reclassification of Landuse /Landcover Robit Catchment
 |
| |
|
The land use/land cover of the area is also one of the primary concerns because this is one factor which not only reflects the current use of the land, pattern and type of its use but also the importance of its use in relation to the living population and its relationship with the existing development. (Nelson, 2007). The land use /land cover of the Robit Catchment was prepared by classifying Landsat 8 ETM+ acquired on 09/16/2015, having path and row of 169/55. A supervised classification method was adopted using ERDAS Imagine 9.2 software and later analyzed using ArcGIS spatial analyst tools. The land use/land cover pattern of the Robit Catchment has been classified into five categories, namely Dense/Sparse vegetation, Scrub/fallow land, Agricultural land, Settlements and Water Bodies. To assess the classification accuracy, confusion matrix was used. An overall accuracy of 87.63% was achieved in accuracy assessment. Land use/land cover types were ranked into different categories based on sensitivity to flooding. The higher rank values were assigned to Settlements and water bodies’ category and lower values were assigned for dense and sparse vegetation areas.
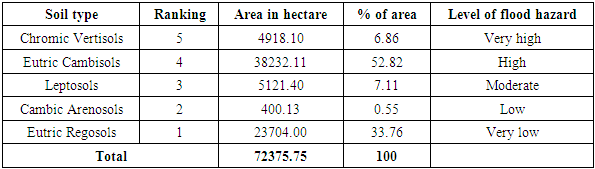
5.2.5. Soil Type
According to FAO (2001) the highest infiltration rates or water holding capacity are measured on Chromic Vertisols that have a considerable shrink/swell capacity. Eutric Cambisols are medium-textured and have a good structural stability, a high porosity, a good water holding capacity and good internal drainage. Leptosols are normally free from noxious levels of soluble salts. However, their shallowness and/or stoniness, and implicit low water holding capacity. Cambic Arenosols have a high proportion of large pores that account for their good aeration, rapid drainage and low moisture holding capacity. Very low water holding capacity and high permeability to water make most Eutric Regosols sensitive to flooding.From the above soil characteristics which is based on water holding capacity, Chromic Vertisols are assumed to have a very high flooding capacity and ranked as very high class. Eutric Cambisols are assigned as high class, Leptosols are assigned as moderate, Cambic Arenosols are assigned as a low class, and Eutric Regosols are assumed to have a very low flooding capacity and ranked as very low class (table 5.6). The soil type that has a very high capacity to generate a very high flood rate is ranked as class 5, high ranked as class 4, moderate ranked as class 3, low ranked as class 2 and very low ranked as class 1. Table 5.6. Reclassifications of soil type Robit Catchment
 |
| |
|
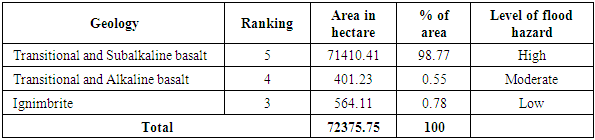
5.2.6. Geology
According to Daniel Meshesha, (2010) Transitional and sub alkaline Basalt are medium-textured and have a good structural stability, a high porosity, a good water holding capacity and good internal drainage. Transitional and Alkaline basalt have a high proportion of large pores that account for their good aeration, rapid drainage and low moisture holding capacity. Ignimbrite have a very low water holding capacity and high permeability. Therefore, Transitional and Subalkaline basalt are assumed to have a very high flooding capacity and ranked as high class. Transitional and Alkaline basalt are assigned as moderate and Ignimbrite are assumed to have a low flooding capacity and ranked as low class. Table 5.7. Reclassification of geology Robit Catchment
 |
| |
|
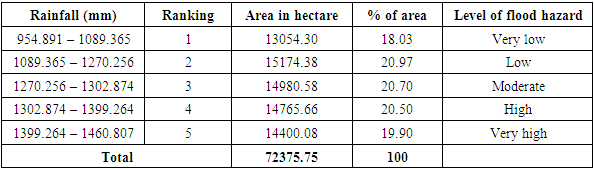
5.2.7. Rainfall Intensity
Heavy rainfalls are one of the major causes of floods. Floods are associated with extremes in rainfall, any water that cannot immediately seep into the ground flows down slope as runoff (Nicholls, 2001). The long year rainfall data has been collected from the NMA within the Robit Catchment and outside the Catchment, of five station. The annual rainfall data from each Metrologic station was calculated and interpolated from the point data using Kriging techniques. Then the interpolated surface was converted to raster layer, which was finally reclassified into five classes. In the reclassification process an area with higher rainfall, is very highly affected by flood and then ranked as class 5. Following the very high hazard class, there is a class high ranked as class 4, moderate ranked as class 3, low ranked as class 2 and very low ranked as class 1.Table 5.8. Reclassification of Rainfall Robit Catchment
 |
| |
|
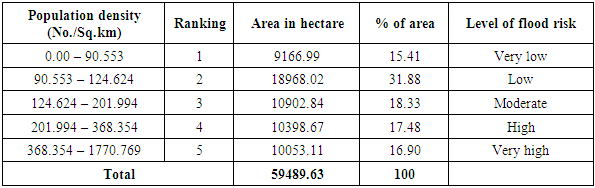
5.2.8. Population Density
Population data was collected from census of Central Statistical Agency (CSA, 2007). Gross population density calculation method was used to calculate the number of person per square kilometers per kebeles. Right after updating, population shape file was converted to raster layer using Conversion Tools/ Feature to Raster. Then further the data layer was reclassified in five sub-groups using the standard classification Scheme. In this classification process an area of high population density is strongly affected by flood and hence ranked to 5, while an area of relatively low population density is the least to be affected by flood and hence ranked to 1 as depicted in the results table 5.9. Table 5.9. Reclassification of population density Kewet District
 |
| |
|
5.3. Flood Hazard Analysis
Multi-Criteria Evaluation technique was used to assess flood hazard of the Robit Catchment using GIS. It is most commonly achieved by one of two procedures. The second procedure which was used in the study is known as weighted linear combination (WLC) where continuous criteria (factors) were standardized to a common data model that was raster layer with a resolution of 30 m cell size, and then combined by means of a weighted overlay. At this stage, all the factor layers are ready to be combined in order to assess the flood hazard zones in the Catchment. It was done systematically using ArcGIS model builder.
5.4. Flood Risk Analysis
As the flood hazard result of the Robit Catchment revealed in the next chapter, almost of the very high (96.96%) and high (98.58%) hazard areas of the Catchment fall in Kewet District. Therefore, it is found important to do the flood risk assessment for this District. Flood risk assessment was done for Kewet District using the flood hazard layer and the two elements at risk, namely population density and land use /land cover. Vulnerability was assumed to be one. These three factors remained to be equally important in the Weighted Overlay process.
6. Results and Discussions
6.1. Flood Hazard Assessment
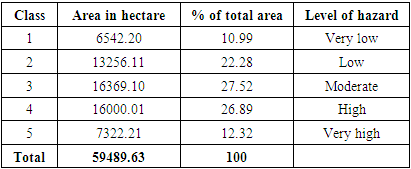
The flood hazard analysis was computed using multi criteria evaluation (MCE). To run MCE, the selected factors were developed and weighted. All of these processes, the compilation of contributing factor maps, the overlaying of all maps (factors) and the calculation of flood hazard areas were obtained by using Weighted Overlay in ArcGIS Spatial Analyst tool. If all datasets were equally important, it could be possible to combine them simply. Therefore, the higher the weight, the more influence a particular factor will have in the flood generation. In this study, The flood hazard maps (Fig 6.1) below shows that 16431.63, 14487.48, 17671.13, 16231.33, 7551.18 hectare of Robit Catchment, and 6542.20, 13256.11, 16369.10, 16000.01, 7322.21 hectare area of Kewet District were subjected respectively to very low, low, moderate, high and very high flood hazards as shown in Table 6.1.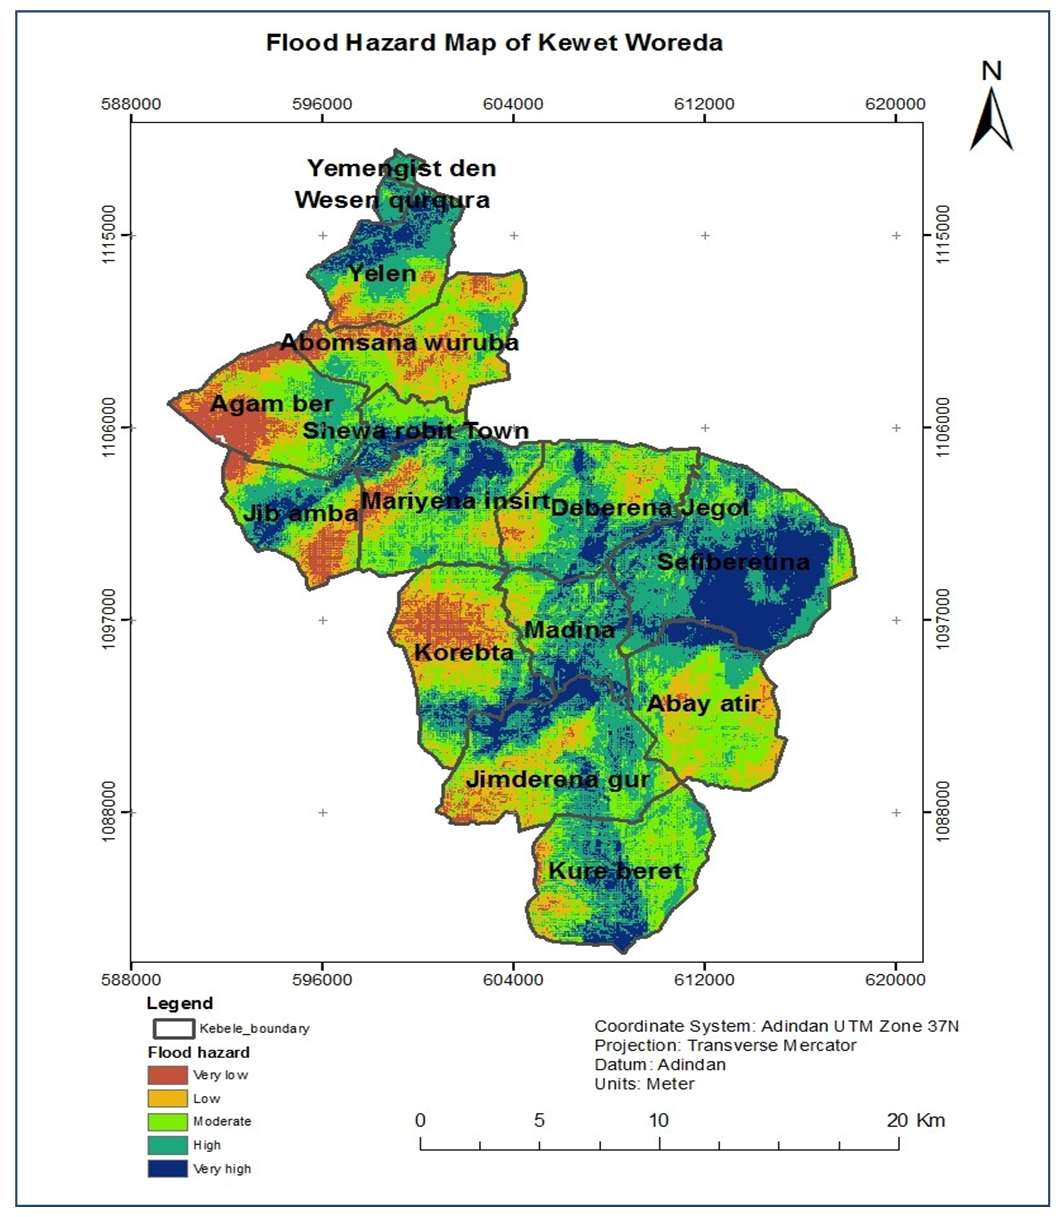 | Figure 6.1. Flood hazard map of Kewet District |
Table 6.1. Areas coverage of Flood hazard analysis of Kewet District
 |
| |
|
Finally, the results of interpretation and analysis show that areas about 7322.21 hectares (12.32 percent of the total area) of Kewet District is falls under very high flood hazard zone. Of the total study area, about 27.52 falls under the category of moderate flood hazard potential which covers 16369.10 hectare; while the area covered under the very low (6542.20 hectare) and low (13256.11 hectare) flood hazard potential category, which occupied approximately 33.27% area of the Kewet District. Moreover, the results indicated that 10.99, 22.28, 27.52, 26.89 and 12.32 percent of the study area was under very low, low, medium, high and very high flood hazard zones respectively. Since 39.21% of the District is under high and very high (extreme) flood hazard, adoption of suitable conservation measures seems to be inevitable. Kebeles in the Kewet District that are more than half of their area falls under high to very high flood hazard include Shewa Robit Town (76.36%), Debrena jegol (52.1%), Tere (65.2%), Yemengist den (97.3%), Wesen qurqura (96.4%), and Sefiberetina Hedi (92.6%) as shown in appendix 1. Hence these kebeles needs immediate attention for alleviating potential future flood hazard.
6.2. Flood Risk Assessment
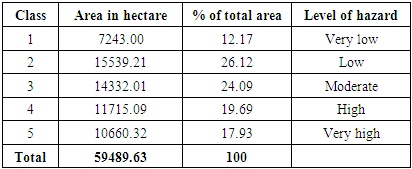
Flood risk of the District was analyzed from the following general risk equation (Shook, 1997). Risk= (Elements at risk)*(Hazard*Vulnerability).Considering the degree of loss to be total for the study area, the vulnerability is assumed to be one. Finally to generate flood risk map of the District, elements at risk layer (land use/landcover and population density) and the flood hazard map were overlaid using weighted overlay analysis technique in Spatial Analyst tool of ArcGIS10 environment (Fig 5.2). These three factors remained to be equally important in the Weighted Overlay process.Table 6.2. Areas coverage of Flood risk analysis of Kewet District
 |
| |
|
According to the flood risk map (Figure 6.2), it was estimated that 10660.32, 11715.09, 14332.01, 15539.21 and 7243.00 hectare areas of Kewet District were subjected respectively to very high, high, moderate, low, and very low flood risk. Finally, the results of interpretation and analysis show that areas about 17.93 percent of the total area of Kewet District is falls under very high flood risk zone. Of the total study area, about 24.09 percent falls under the category of moderate flood risk potential; while the area covered under the very low and low flood risk zone category, which occupied approximately 38.29 percent area of the Kewet District. Since 37.62% of the District is under high and very high (extreme) flood risk, adoption of suitable conservation measures seems to be inevitable.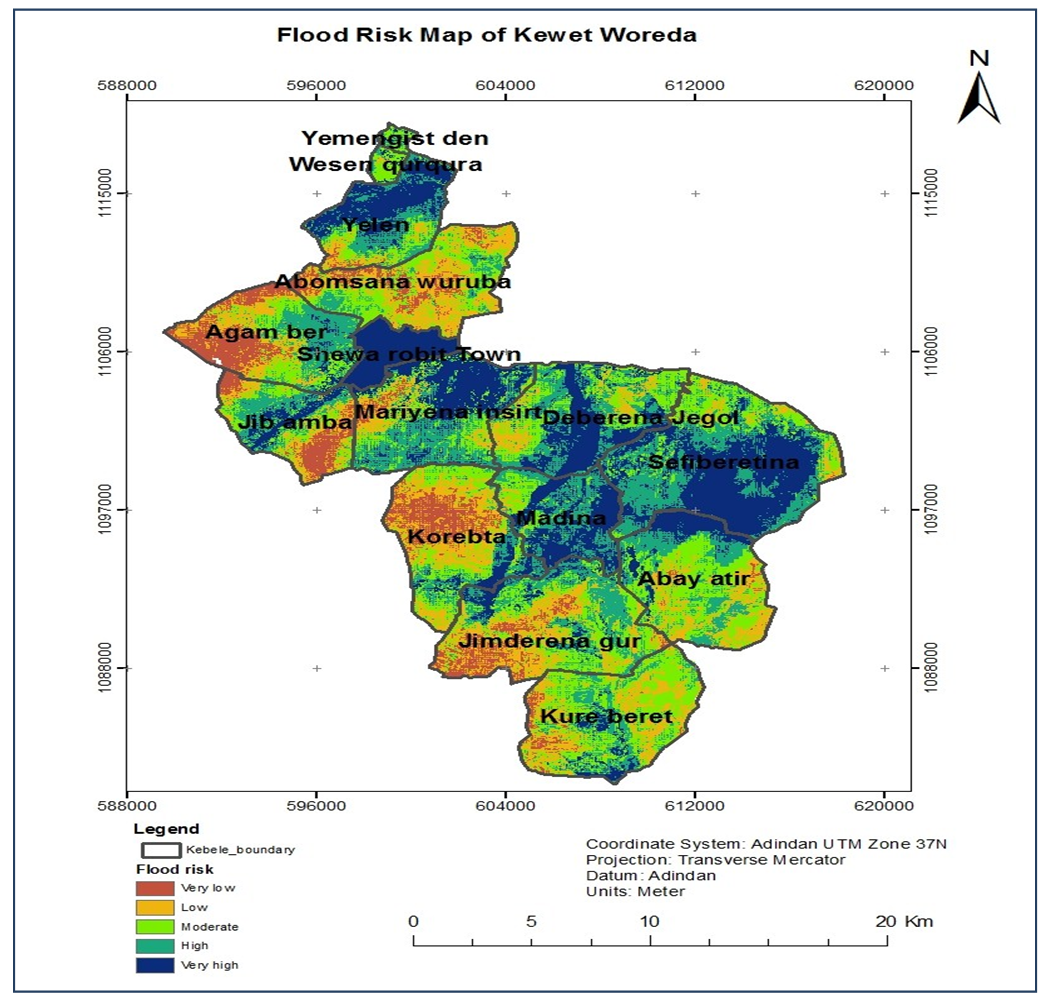 | Figure 6.2. Flood risk map of Kewet District |
7. Conclusions
The basic idea of flood hazard and risk assessment and mapping as undertaken in this study is to regulate land use by flood plain zoning in order to restrict the damages. In the light of above discussion, it can be said that flood risk mapping, being an important non-structural flood management technique, will go long way in reducing flood damages in areas frequented by flood. In this study, areas that can be affected by different flood hazard and risk levels are delineated by using Multi Criteria Evaluation techniques in GIS environment. Those main factors for flood hazard assessment are analyzed and their weight is computed by pair wise comparison methods and the factors are overlaid by the Weighted Overlay analysis in Spatial Analyst tool in ArcGIS environment. Using this method, flood risk map for Kewet District in particular and flood hazard map Robit Catchment in general was generated which could be used by different pertinent decision makers to act up on the current land use policy for reducing flood disaster. The study indicated that 12.32% and 17.93% of the area of the Kewet District is very high flood hazard and risk zone respectively. Therefore, Managers and decision makers should make use of the information from this techniques, as a decision support for a better design of natural resource management.
8. Recommendations
This investigation provides information on flood hazard at a Catchment and District level and flood risk at District level that could be used for reducing vulnerability to flood disaster in Kewet District in particular and that of the Robit Catchment at large with the following recommendations: v Kewet District blessed with ample land resources, which is one of the most agricultural development areas in Ethiopia, but its proper agricultural development has been hindered by inundation, floods and poor drainage condition. Therefore, the responsible bodies of the District as well as the region should use this flood hazard and flood risk map for better management of their agricultural development.v The flood hazard and risk map can assist in policy decisions during a land use planning as it shows the environmental risk zone of flood. Therefore local planners and policy makers should make use of hazard and risk zone model out puts as a decision support.v Creating awareness among the society concerning optimum use of natural resources, conservation systems and their benefits by concerned bodies and NGOs could play significant role in minimizing of environmental risk zone. In addition, since most important factor for the landcover change in the Ethiopia, particularly in the study area is the increase in population, continuing the current efforts of introducing family planning to make the people aware of consequences of population pressure should be carried out intensively.
References
| [1] | Daniel Meshesha, (2010). Geology of Debre Birhan Area (NC 37-11). Geologiacal survey of Ethiopia, Addis Ababa. |
| [2] | DPPA, (2006). Joint Government and Humanitarian Partners: Flash appeal for the 2006 flood disaster in Ethiopia. |
| [3] | Ken Granger, (2002). Community Risk Assessment in Mackay: A Multi-Hazard Risk Assessment. |
| [4] | Lillesand, M. Thomas and W. Ralph Kiefer. 2000 and 2004. Remote Sensing and image Interpretation: 4th ed. John Wiley & Sons, Inc. 750 pp. |
| [5] | Miller, J.B., (1997). FLOODS: People at Risk, Strategies for Prevention. United Nations Publication. New York and Geneva. |
| [6] | Myers, M. F. and White, G. F., (1993). The challenge of the Mississippi flood. Environment 35. |
| [7] | Nelson, S.A., (2007). Flood Hazards, Prediction and Human Interventions. Tulane University. Intute: Science, Engineering and Technology. http://www.tulane.edu/sanelson/geol204/floodhaz.htm. |
| [8] | Nicholls. N., Natural Hazards, 2001, 23: 137-155. |
| [9] | Saaty, (1999). GIS and Multicriteria Decision Analysis, John Wiley and Sons, New York, NY. |
| [10] | Shook, G. (1997). An assessment of disaster risk and its management in Thailand Disasters 21 (1): 77-88. |
| [11] | Strahler, A.N., (1999). Quantitative Geomorphology of Drainage basins and Channel network. In Handbook of Applied Hydrology; Mc Graw Hill: New York, NY, USA; pp. 39–76. |
| [12] | UNOCHA, (2010). Weekly humanitarian highlights in Ethiopia. |
| [13] | Vilanculos, A.C.F., (2006). MSc Thesis: Towards Improving Flood Forecasting and Early Warning Systems through Integrated Technology in the Limpopo Basin. Department of Civil Engineering. University of Zimbabwe. Unpublished. |
| [14] | World Bank, (2001). ‘Flood Control in Bangladesh; A Plan for Action’, World Bank Technical Paper number 119, Asia Region Technical Department. |
| [15] | World Meteorological Organization, (2010). Associated Programme Flood Management Technical Document No. |

 Abstract
 Reference
 Full-Text PDF
 Full-text HTML