-
Paper Information
- Paper Submission
-
Journal Information
- About This Journal
- Editorial Board
- Current Issue
- Archive
- Author Guidelines
- Contact Us
American Journal of Geographic Information System
p-ISSN: 2163-1131 e-ISSN: 2163-114X
2018; 7(5): 133-144
doi:10.5923/j.ajgis.20180705.02

Analysis of Vegetation Dynamics and Responses to Inter-annual Changes of Climatic Variables in Dry Afromontane Forest Fragments, Northern Ethiopia
 Abstract
 Reference
 Full-Text PDF
 Full-text HTML
Zenebe Girmay Siyum1, 2, J. O. Ayoade3, M. A. Onilude4, Motuma Tolera Feyissa2
1Pan African University, Life and Earth Sciences (Including Health and Agriculture) Institute, University of Ibadan, Ibadan, Nigeria
2Hawassa University, Wondo Genet College of Forestry and Natural Resource, Shashemene, Ethiopia
3Department of Geography, University of Ibadan, Ibadan, Nigeria
4Department of Agricultural and Environmental Engineering, University of Ibadan, Ibadan, Nigeria
Correspondence to: Zenebe Girmay Siyum, Pan African University, Life and Earth Sciences (Including Health and Agriculture) Institute, University of Ibadan, Ibadan, Nigeria.
| Email: |  |
Copyright © 2018 The Author(s). Published by Scientific & Academic Publishing.
This work is licensed under the Creative Commons Attribution International License (CC BY).
http://creativecommons.org/licenses/by/4.0/

Understanding the current changes and dynamics of different vegetation communities under the background of climate change provides basis for ecological restoration in drylands. The spatiotemporal variations of vegetation growth and their relationships with climatic variables across the arid and semi-arid parts of northern Ethiopia have not yet been well researched. This study analyzed the trends (changes) in vegetation greenness of the dry Afromontane forests of northern Ethiopia and examined their relationships with the climatic variations for the period 2000-2016, based on space-based vegetation index derived from the Moderate Resolution Imaging Spectroradiometer (MODIS13Q1) product and gridded high-resolution climate datasets. A simple linear regression model, correlation analysis, and trend analysis (using Mann-Kendall test and Theil-Sen median trend analysis) were used to assess vegetation dynamics and their responses to climate variability. Results of the study showed a general decreasing trend in vegetation greenness and slight warming trends, with considerable spatiotemporal variations. The NDVI-rainfall relationships were positive in both study sites, implying that rainfall is the main factor which determines vegetation growth in the study region. Future works may need to concentrate on time-series data with better quality (e.g. high resolution) and incorporate land use change and other eco-climatological factors into the study to better account for the spatiotemporal vegetation variability.
Keywords: Climate Change, Dry Afromontane Forest, Normalized Difference Vegetation Index, Trend Analysis, Vegetation Dynamics
Cite this paper: Zenebe Girmay Siyum, J. O. Ayoade, M. A. Onilude, Motuma Tolera Feyissa, Analysis of Vegetation Dynamics and Responses to Inter-annual Changes of Climatic Variables in Dry Afromontane Forest Fragments, Northern Ethiopia, American Journal of Geographic Information System, Vol. 7 No. 5, 2018, pp. 133-144. doi: 10.5923/j.ajgis.20180705.02.
Article Outline
1. Introduction
- Dryland vegetation has enormous socio-economic and ecological benefits. Nevertheless, they are already at greater risk mainly due to threats from climatic and anthropogenic factors [1, 2]. Recent studies claimed that the effects of anthropogenic disturbances on forest ecosystems seem to outweigh the climate-induced impacts [3, 4]; but, projections into future scenario also show serious repercussions of climate change in the dry tropics [5]. In addition to the human-induced land use changes, climate will continue to play an important role in the dynamics of dryland systems [6, 7]. Climate change may directly affect the growth and population dynamics of trees growing in drylands [8, 9], mainly through variations in rainfall and temperature [10]. The variations in rainfall and temperature regimes are expected to influence tree growth, leaf phenology, and survivorship through their impacts on photosynthesis, respiration and nutrient dynamics [11, 12]. [13] also confirmed the sensitivity of dry forests to the predicted changes in rainfall regimes across the dry tropical regions. But, the future of these ecosystems remains uncertain in the face of the changing climate. The effects of climate change are expected to be even pronounced in the dry tropics given their high sensitivity to the climate anomalies, such as frequent occurrences of extreme heat, increasing aridity and erratic rainfall patterns. The climate in the tropics and sub-tropics will get warmer and drier, with some exceptions in East Africa, the Sahel, the Guinean coast and southern Sahara where there is a likelihood of increment in rainfall, but with a high level of uncertainty [14]. This will likely result in various drastic transformations, including losses of biodiversity, species range shifts, altered tree productivity, and an overall extinction risks to the already endangered species living in the highly fragmented environments [15, 12, 16]. This will possibly alter the balance and functioning of the ecosystem, with subsequent negative impacts on the livelihoods of the forest-dependent people. Many dry forests and woodlands in the tropics are expected to be highly vulnerable to climate-induced forest dieback [17, 18]. This is particularly true for countries such as Ethiopia, where much of its landmass (over 72% of the total land area) is categorized under dryland area [19]. Therefore, understanding the response of dryland vegetation to climate change is emerging as a major research agenda [20]. In this regard, knowledge of the current changes and dynamics of various vegetation communities in the face of climate change has crucial roles in planning sustainable forest management strategies. A common approach used to detect the response of vegetation to climate change is the satellite-derived vegetation index (VI). The Normalized Difference Vegetation Index (NDVI) is among the most widely used VI [21, 22]. The NDVI, a normalized ratio of the near-infrared and red spectral reflections, is often directly related to percentage of ground cover, photosynthetic activity of plants, surface water, leaf area index and amount of biomass [23]. Thus, analysis of NDVI trend and its relationships with climatic variables help in understanding the temporal trend of vegetation’s biophysical characteristics at different spatial scales and hence have crucial implications for research on climate and vegetation dynamics [24]. Previous studies have proven the wide applicability of undertaking correlation analyses between NDVI time-series and climatic variables for examining vegetation dynamics and their responses to climate change in varied bioregions [25-29, 20]. Although these several studies conducted hitherto demonstrated the existence of close relationship between vegetation dynamics and climate change, such studies have to be replicated across various spatial and temporal scales. This helps to investigate the emerging complex relationships and to properly understand the extent to which climate change is affecting ecosystem structures and functioning. In general, the NDVI has been used as a proxy for analysing vegetation dynamics and it is expected to show large temporal and spatial variations in different climatic regions and for different vegetation types [30-32, 29]. NDVI data derived from NOAA/AVHRR have been widely used to quantify vegetation activity [33, 22]. Recently, the NDVI dataset derived from the Moderate Resolution Imaging Spectroradiometer (MODIS) improved the spatial resolution of the previous products and enabled a thorough examination of vegetation dynamics at various scales [34, 35]. Thus, this study examined vegetation dynamics in the dry Afromontane forest remnants of northern Ethiopia using the MODIS NDVI (2000-2016) and further investigated if such vegetation trends can be explained by the long-term climate trends. Since the decline in dryland forest productivity can be interpreted as a sign of widespread drought stress, we expected NDVI to be positively correlated with moisture availability.
2. Materials and Methods
2.1. Study Area
- The study was conducted in Desa’a (13°40′ to 13°50′ N, 39°47′ E) and Hugumburda (12°38′ N, 39°32′ E) forests, the two major dry Afromontane forest remnants in northern Ethiopia. These forests are mainly located along the western escarpment of the Great Rift Valley facing the Afar depression [36]. The area falls in the semi-arid agro-ecological zone of Tigray region (Figure 1) where the climate is influenced by topography and exposures to rain-bearing winds [37].
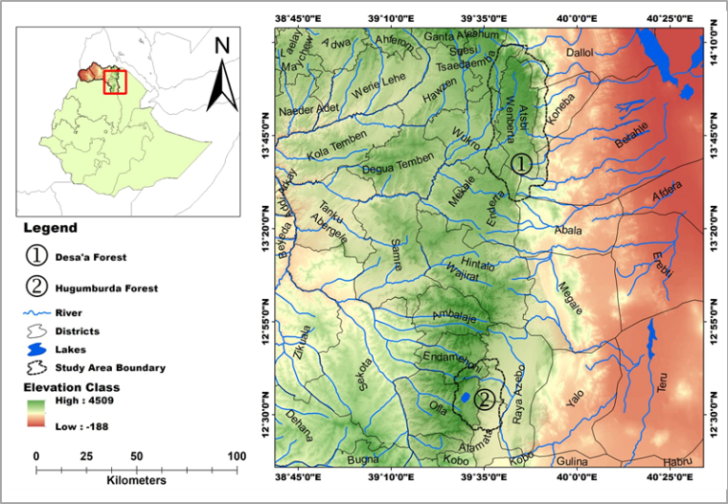 | Figure 1. Location of the Study Area |
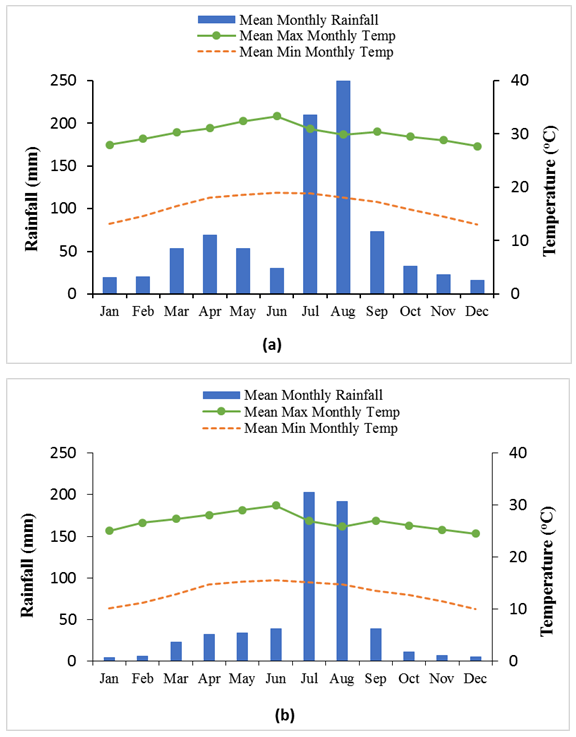 | Figure 2. Mean Monthly Rainfall and Mean Monthly Temperature (Maximum and Minimum) Records (1980-2016) of the Study Areas, (a) Hugumburda and (b) Desa’a, Northern Ethiopia |
2.2. Data Sources and Processing
2.2.1. NDVI Data
- NDVI data derived from the Moderate Resolution Imaging Spectroradiometer (MODIS13Q1) product from NASA (USGS) was used for the period 2000-2016 as a proxy for vegetation growth and change detection. The MODIS NDVI product has a spatial resolution of 250 m and a temporal resolution of 16 days composites and was downloaded from http://earthexplorer.usgs.gov/. This product is based on the MODIS sensor on-board NASA’s Terra (EOS AM) and Aqua (EOS PM) satellites. The land imaging component of the MODIS sensor combines characteristics of AVHRR (Advanced Very High Resolution Radiometer) and Landsat sensors to provide improved monitoring of the earth’s surface at global scales. The NDVI data acquired from the MODIS 16-days composite datasets from 2000 to 2016 were calculated by the amount of reflectance in near-infrared (ρ2: Band 2, 858 nm) and red (ρ1: Band 1, 645 nm) portions of the electromagnetic spectrum. These have a spatial resolution of IFOV 250 m.
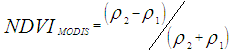 | (1) |
2.2.2. Climate Data
- The availability of weather stations in the study sites is extremely low and the existing climate records were fragmentary (i.e., short climatic records containing missing values for several months and/or years). This imposed difficulties for understanding the temporal and spatial climate variability of the study region, which is characterized by a complex topography. Therefore, high-resolution climate datasets from AgMERRA (at 0.25-degree resolution) [41] and the latest version of the Climate Research Unit time-series (CRU TS 4.01) datasets (at 0.5-degree resolution) [42] were used in this study. These global grid datasets are widely used climate data sources in several studies. Especially, the climate data developed by the Climate Research Unit (CRU) of the University of East Anglia have been widely used in several studies given its global coverage, long temporal scale (since 1901) and abundance of climatic variables [43]. These global grid datasets were used to derive temperature (minimum and maximum) and rainfall data and to supplement any fragmentary climate data. The combined climate data spans the period 1901-2016. For the NDVI-climate analyses, the climate data from 2000 to 2016 was used in accordance with the MODIS NDVI data.
2.3. Data Analysis
2.3.1. Trend Analysis
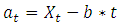
- The study employed a combination of three commonly used methods of trend analysis, the least-square linear regression, the Mann-Kendall test, and the Theil-Sen’s slope trend test, to detect and characterize the trends in vegetation dynamics and climatic variables in the study region. These methods are widely used in analysing patterns of directions and magnitude (rates of changes) of the trends of NDVI and climatic time-series datasets [44, 30, 31]. The slope of the regression equation (developed using the linear least square fitting of the long-term NDVI series) was applied to analyse the direction of vegetation change [45, 46, 39, 20].
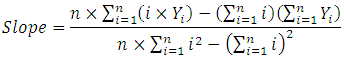 | (2) |
 | (3) |
 | (4) |
 | (5) |
 | (6) |
 | (7) |
 | (8) |
2.3.2. NDVI-Climate Relationship
- After estimating the trends in NDVI, rainfall, and temperature, the study further analysed the relationships between NDVI values and climatic variables (rainfall and temperature). The correlations between NDVI and climatic variables were analysed during 2000-2016. The strength of the linear association between NDVI values and climatic variables was assessed by calculating the Pearson’s product moment correlation coefficient [30, 31, 20, 45, 40, 44]. The formula for the Pearson’s r is given as follows:
 | (9) |
 and
and  are the corresponding average values. rxy is the coefficient for the two samples, which indicates the degree of correlation between the two factors, and its value is in the range of [-1, 1]. When r > 0, it means that they are positively correlated, whereas when r < 0, they are negatively correlated. In general, the larger the absolute value of the correlation coefficient, the stronger is the correlation between each variable.A 95% significance level was used to determine the strength of the relationships. Various studies revealed that correlation analyses between NDVI time-series and climatic variables are widely applied for examining vegetation dynamics and their responses to climate change in varied bioregions [25-29, 20]. Before undertaking the analyses, each time-series data was standardized by subtracting the mean of the time-series and dividing by the standard deviation. R programming language software (mainly in R commander) was used for all the statistical data analyses. R programming language is powerful and license free software capable of performing a wide variety of statistical tests ranging from simple to sophisticated analyses with little programming. It is highly extensible with user-submitted packages for specific functions. A script developed in the R environment allows easy reproducibility of analysis. It has a lot of functionalities and vast package ecosystem making it highly flexible and powerful for dealing with data management, analysis and graphic presentations. In general, R software is a well-developed, simple and effective programming language which is compatible with all computer operating systems. It includes an integrated suite of software facilities for data manipulation, calculation and graphical display. Therefore, R programming language remains the best analytical tool for various statistical tests, including linear and non-linear modelling, classical statistical tests, time-series analysis, classification, and clustering, among others. Consequently, R software was chosen for analysing the time-series datasets used in this study. Accordingly, this study used specific functions in the trend package within the time-series package for the data analyses. The mathematical basis for these analyses are presented in the aforementioned equations. In general, analyses results are statistically significant at P<0.05 unless stated otherwise.
3. Results
3.1. Trends in Vegetation Greenness
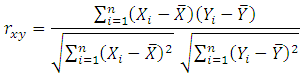
- Table 1 presents a summary of descriptive statistical parameters of the NDVI values in both study sites for the period 2000-2016. The mean NDVI values recorded were 0.6878±0.0155 (± SE) and 0.5800±0.0244 (± SE) in Hugumburda and Desa’a, respectively (Table 1). The variability of annual NDVI values, as measured by the coefficient of variation, was higher in Desa’a site than Hugumburda site.
|
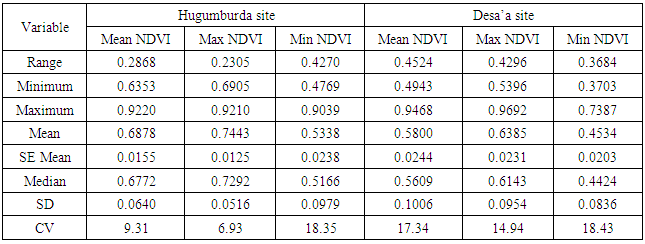
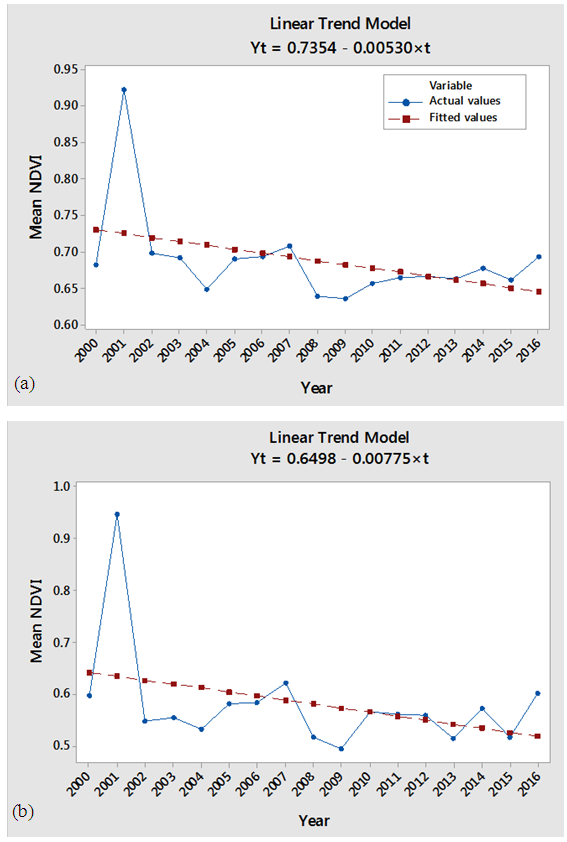 | Figure 3. Trend Analysis Plot (2000-2016) for Mean Annual NDVI Changes in two Sites, (a) Hugumburda and (b) Desa’a Sites, in Northern Ethiopia. The Dotted Lines Represent LOWESS Smoothing Line |
|
3.2. Trends in Climatic Variability
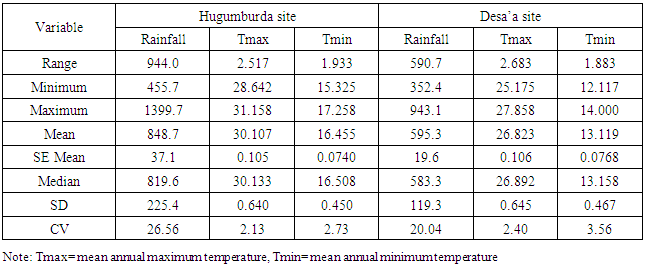
- Table 3 presents a summary of descriptive statistics of the climatic variables in both study sites for the period 1980-2016. Higher amount of mean annual rainfall (848.7 mm) was recorded in Hugumburda site than in Desea site. The coefficient of variation (CV), which measures dispersion around the mean, was also computed to determine the variability of annual rainfall and temperature in the study sites. The variability of annual rainfall was higher in Hugumburda compared to that of Desa’a site, whereas the variation for both maximum and minimum temperature was higher in Desa’a site (Table 3).
|
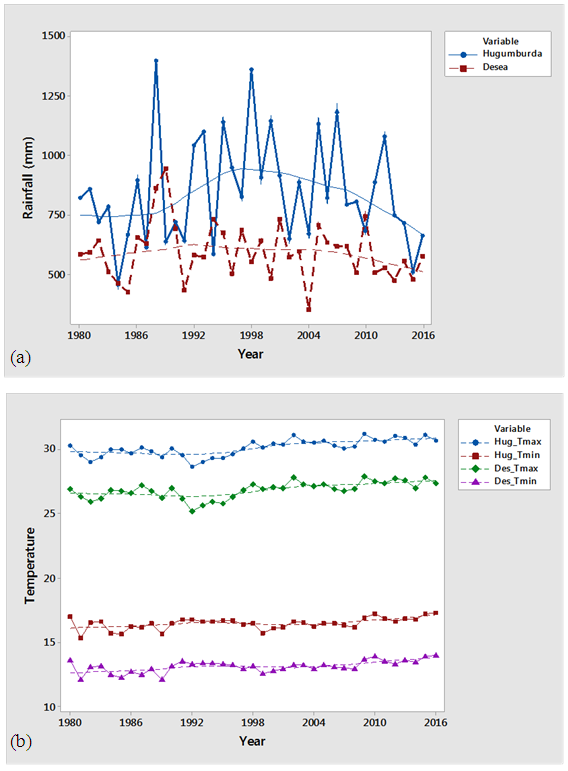 | Figure 4. Trend Analysis Plot (with LOWESS Smoothing Curves) for (a) Mean Annual Rainfall and (b) Mean Annual Temperature (Maximum and Minimum) in Hugumburda and Desa’a Sites of the Dry Afromontane Forest Remnants in Northern Ethiopia for the Period 1980-2016 |
|
3.3. Relationships between NDVI Trends and Climatic Variables
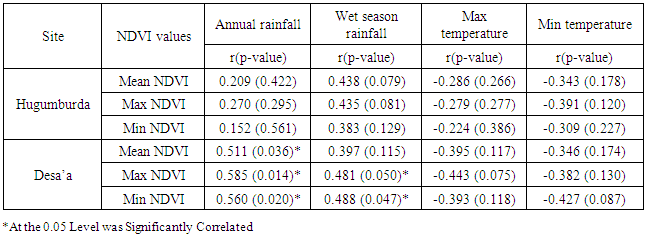
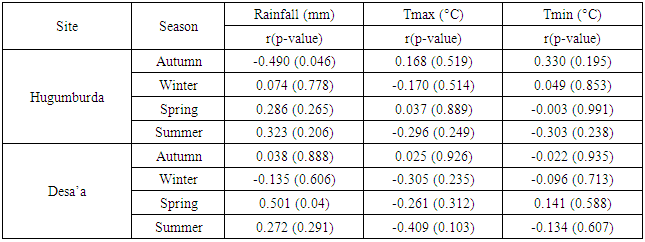
- The study analysed the relationships between NDVI trends (2000-2016) and changes in climatic variables (rainfall and temperature) in the semi-arid region of northern Ethiopia. Results of the correlation analysis between the area-averaged mean NDVI values and climatic variables in both study sites are presented in Table 5.The correlations showed considerable variations spatially over the study periods. Positive correlations were found between the mean NDVI values and rainfall in the vegetated areas of both study sites. The correlations in Desa’a site were significant (P<0.05) (Table 5). But, the NDVI values correlated negatively with temperature, and significant correlations (at 5% significance level) were found in April and June-September.
|
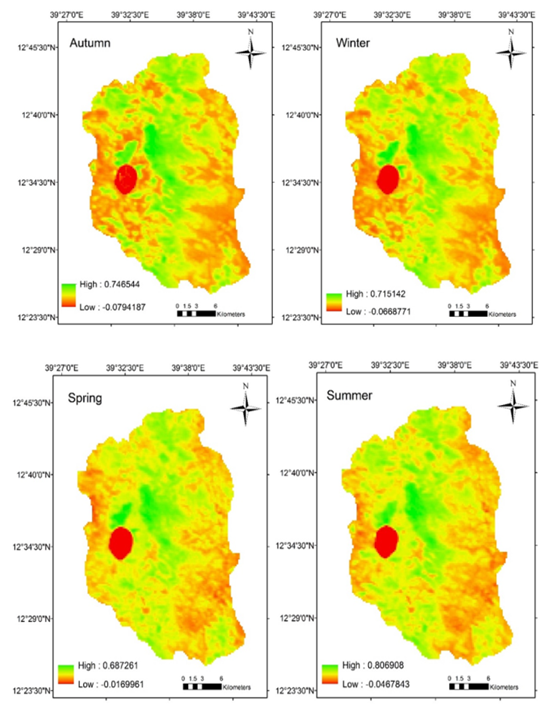 | Figure 5. Spatial Distribution of Seasonal NDVI Changes from 2000 to 2016 in Hugumburda Site, Northern Ethiopia |
4. Discussion
- This study analysed the trends in vegetation greenness and climatic variables in the semi-arid region of northern Ethiopia. Besides, correlation analyses were undertaken between the climate datasets and NDVI time-series to analyse vegetation responses to climate variability in the study region. The results showed an overall decreasing (browning) trend of vegetation cover, with considerable spatiotemporal variability. Rainfall remained an overriding factor in determining the spatiotemporal variability in NDVI trends.
4.1. Analyses of Trends
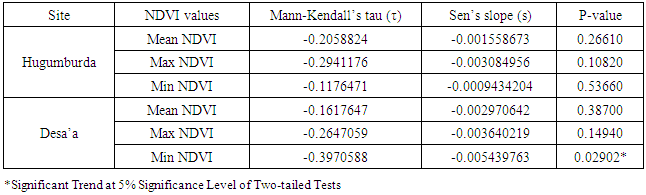
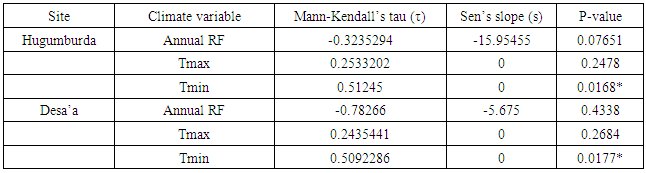
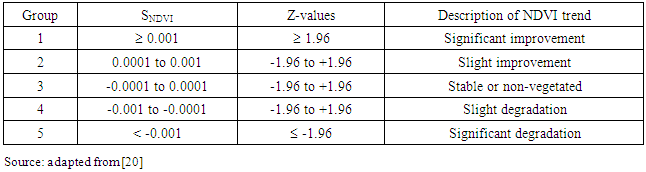
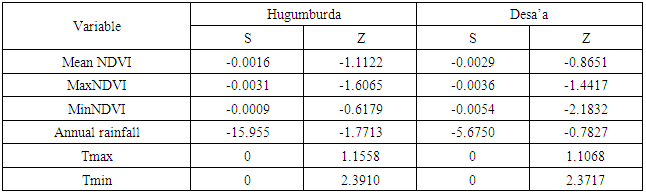
- Using a combination of a least-square linear regression analysis, Mann-Kendall test and Theil-Sen median trend analysis, this study examined the changes in trends of NDVI values and the main climatic variables in the dry Afromontane forests of northern Ethiopia. Previous studies [e.g. 44, 20] confirmed that the changes in NDVI trends can best be described using the results of the Mann-Kendall test and the Theil-Sen median trend analysis. Accordingly, the significance level of the changes in NDVI trends was determined using the Z-values at 5% significance level. The results of the Mann-Kendall test were classified into insignificant changes (if -1.96 < Z < 1.96) or significant changes (if Z ≥ 1.96 or Z ≤ -1.96). Besides, the patterns of trends in NDVI values and climatic variables were classified following the approach of [20] (Table 7).
|
|
4.2. Relationships between Vegetation Dynamics and Climatic Variables
- Previous studies have already proven the wide applicability of undertaking correlation analyses between NDVI time-series and climatic variables for examining vegetation dynamics and their responses to climate change in varied bioregions [25-29, 20]. The spatiotemporal patterns of vegetation are continuously changing worldwide owing to the continuous upheavals from climatic and anthropogenic factors. Large temporal and spatial variations in NDVI trends are expected in different climatic regions and for different vegetation types [30, 31]. Thus, this study analysed vegetation dynamics over the past two decades and their responses to the changing climatic variables. In this study, the correlation between NDVI and climate variables were analysed in the semi-arid region of northern Ethiopia. Results of the correlation analyses revealed a general correspondence between vegetation dynamics and climatic variations. The study region experienced slight warming and decreasing rainfall, and this is congruent with the declining trend in vegetation growth. The decline in vegetation growth can, therefore, partly be explained by the recurrent drought events due to the changes in rainfall and temperature and the complex relation with other factors.
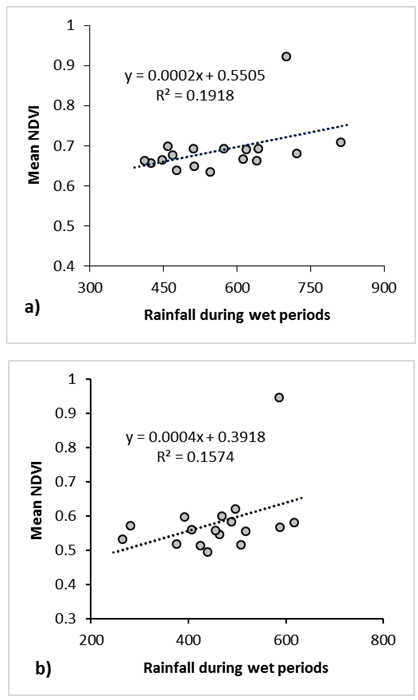 | Figure 7. Scatter Diagram of Relationships between Mean NDVI Values and Rainfall (mm) for the Period 2000 to 2016 in two Study Sites, (a) Hugumburda and (b) Desa’a, in the Dry Afromontane Forest Remnants, Northern Ethiopia |
5. Conclusions
- Understanding the spatiotemporal vegetation dynamics of a given region is crucial to provide baseline information for advocating ecological restoration and management endeavours, particularly in dry agro-ecologies. This study used simple linear regression model, correlation analysis, and trend analysis (using Mann-Kendall test and Theil-Sen median trend analysis) to assess vegetation dynamics and their responses to climate variability. For this purpose, the MODIS NDVI time-series data and gridded rainfall and temperature datasets were used for the common periods (2000-2016). Results of the study confirmed the general assumption about trends in vegetation greenness in most arid and semi-arid regions of the world; we found a general declining trend in vegetation greenness during the study period, but with considerable spatiotemporal variations. The vegetation change alternated between increasing (greening) and decreasing (browning) trends. Slight warming was observed (especially the minimum temperature showed a significant trend) in the study region, while rainfall showed a decreasing trend. Besides, positive NDVI-rainfall relationships were found in the vegetated areas of both study sites. This implies that the annual changes in NDVI were mainly affected by rainfall, and this conforms to the claim that moisture availability is the main factor in determining the growth of dryland vegetation. In general, this study confirms the utility of MODIS NDVI time-series data as an index to express vegetation dynamics at the landscape scale. But, it is assumed that the interplay of other factors with climatic variables may affect the estimates on NDVI changes. Therefore, more investigations are needed to accurately clarify and quantify the impacts of various interacting (natural and human-induced) factors on vegetation dynamics. To this end, future works may need to concentrate on time-series data with better quality (e.g. resolution) and incorporate land use change and other eco-climatological factors into the study to better account for the spatiotemporal vegetation variability. For instance, we suggest further studies emphasizing on the water requirements and drought tolerance of vegetation in this ecological region along with impacts of human-induced disturbance.The authors are grateful to the Pan African University (PAU), African Union (AU), Addis Ababa, Ethiopia for the financial support for this study. The authors would like to extend their gratefulness to all individuals who contributed for the successful accomplishment of this study. We also thank anonymous reviewers for their comments and suggestions.
References
| [1] | Miles, L., Newton, A. C., DeFries, R. S., Ravilious, C., May, I., Blyth, S., Kapos v., and Gordon, J. E. A global overview of the conservation status of tropical dry forests. Journal of Biogeography, 2006, 33(3), 491-505. |
| [2] | Blackie, R., Baldauf, C., Gautier, D., Gumbo, D., Kassa, H., Parthasarathy, N., Paumgarten, F., Sola, P., Pulla, S., Waeber, P., and Sunderland, T. Tropical dry forests: The state of global knowledge and recommendations for future research (Vol. 2). CIFOR. Bogor Indonesia. 2014. |
| [3] | Baccini, A., Walker, W., Carvalho, L., Farina, M., Sulla-Menashe, D., and Houghton, R. A. Tropical forests are a net carbon source based on aboveground measurements of gain and loss. Science, 2017, 358(6360), 230-234. |
| [4] | Manchego, C. E., Hildebrandt, P., Cueva, J., Espinosa, C. I., Stimm, B., and Günter, S. Climate change versus deforestation: Implications for tree species distribution in the dry forests of southern Ecuador. PloS one, 2017, 12(12), e0190092. |
| [5] | Serdeczny, O., Adams, S., Baarsch, F., Coumou, D., Robinson, A., Hare, W., Schaeffer, M., Perrette, M. and Reinhardt, J. Climate change impacts in Sub-Saharan Africa: from physical changes to their social repercussions. Regional Environmental Change, 2017, 17(6), 1585-1600. |
| [6] | Olson, J. M., Misana, S., Campbell, D. J., Mbonile, M., and Mugisha, S. The spatial patterns and root causes of land use change in East Africa. 2004. |
| [7] | Bongers, F., and Tennigkeit, T. (eds). Degraded forests in East Africa: Management and Restoration. 2010. Earthscan UK. |
| [8] | Bogino, S., Fernandez Nieto, M. J., and Bravo, F. Climate effect on radial growth of Pinus sylvestris at its southern and western distribution limits. Silva Fennica, 2009, 43(4), 609-623. |
| [9] | Scheiter, S., and Higgins, S. I. Impacts of climate change on the vegetation of Africa: an adaptive dynamic vegetation modelling approach. Global Change Biology, 2009, 15(9), 2224-2246. |
| [10] | Chidumayo, E., and Marunda, C. Dry Forests and Woodlands in Sub-Saharan Africa: Context and Challenges In: Chidumayo E N and Gumbo D J (Eds) The dry forests and woodlands of Africa: managing for products and services pp 1-10. 2010. |
| [11] | Wright, S. J. The future of tropical forests. Annals of the New York Academy of Sciences, 2010, 1195(1), 1-27. |
| [12] | Feeley, K.J., Rehm, E.M. and Machovina, B. Perspective: The responses of tropical forest species to global climate change: acclimate, adapt, migrate or go extinct? Frontiers of Biogeography, 2012, 4(2) 67-84. |
| [13] | Allen, K., Dupuy, J.M., Gei, M.G., Hulshof, C., Medvigy, D., Pizano, C., Salgado-Negret, B., Smith, C.M., Trierweiler, A., Van Bloem, S.J., Waring, B.G., Xu, X., and Powers, J.S. Will seasonally dry tropical forests be sensitive or resistant to future changes in rainfall regimes? Environmental Research Letters, 2017, 12(2), 023001. |
| [14] | IPCC. Climate change 2007: Impacts, adaptation and vulnerability Fourth Assessment Report Geneva. 2007. |
| [15] | FAO. Guidelines on sustainable forest management in drylands of sub-Saharan Africa Arid Zone Forests and Forestry Working Paper No 1 Rome. 2010. |
| [16] | Yin, Y., Ma, D., and Wu, S. Climate change risk to forests in China associated with warming. Scientific reports, 2018, 8(1), 493. |
| [17] | Allen, C.D. et al. "A global overview of drought and heat-induced tree mortality reveals emerging climate change risks for forests." Forest ecology and management 259, no. 4 (2010): 660-684. |
| [18] | Peng, C., Ma, Z., Lei, X., Zhu, Q., Chen, H., Wang, W., Liu, S., Li, W., Fang, X., and Zhou, X. A drought-induced pervasive increase in tree mortality across Canada's boreal forests. Nature climate change, 2011, 1(9), 467. |
| [19] | Lemenih, M., and Kassa, H. (Eds.). Opportunities and challenges for sustainable production and marketing of gums and resins in Ethiopia. 2011. CIFOR, Bogor, Indonesia. pp. 106. |
| [20] | Jiang, L., Bao, A., Guo, H., and Ndayisaba, F. Vegetation dynamics and responses to climate change and human activities in Central Asia. Science of the Total Environment, 2017, 599, 967-980. |
| [21] | Tucker, C. J. Red and photographic infrared linear combinations for monitoring vegetation. Remote sensing of Environment, 1979, 8(2), 127-150. |
| [22] | Chen, B., Xu, G., Coops, N. C., Ciais, P., Innes, J. L., Wang, G., Myneni, R.B., Wang, T., Krzyzanowski, J., Li, Q., Cao, L. and Liu, Y. Changes in vegetation photosynthetic activity trends across the Asia–Pacific region over the last three decades. Remote Sensing of Environment, 2014, 144, 28-41. |
| [23] | Wang, Y., Lu, R., Ma, Y., Meng, H., and Gao, S. Response to climate change of different tree species and NDVI variation since 1923 in the middle arid region of Ningxia, China. Sciences in Cold and Arid Regions, 2014, 6(1), 30-36. |
| [24] | Hao, F., Zhang, X., Ouyang, W., Skidmore, A. K., and Toxopeus, A. G. Vegetation NDVI linked to temperature and precipitation in the upper catchments of Yellow River. Environmental Modeling & Assessment, 2012, 17(4), 389-398. |
| [25] | Piao, S., Mohammat, A., Fang, J., Cai, Q., and Feng, J. NDVI-based increase in growth of temperate grasslands and its responses to climate changes in China. Global Environmental Change, 2006, 16(4), 340-348. |
| [26] | Chuai, X. W., Huang, X. J., Wang, W. J., and Bao, G. NDVI, temperature and precipitation changes and their relationships with different vegetation types during 1998–2007 in Inner Mongolia, China. International Journal of Climatology, 2013, 33(7), 1696-1706. |
| [27] | Li, Z., Chen, Y., Li, W., Deng, H., and Fang, G. Potential impacts of climate change on vegetation dynamics in Central Asia. J. Geophys. Res.-Atmos., 2015, 120, 2045–2057. |
| [28] | Zhou, Y., Zhang, L., Fensholt, R., Wang, K., Vitkovskaya, I., and Tian, F. Climate contributions to vegetation variations in central Asian drylands: Pre-and post-USSR collapse. Remote Sensing, 2015, 7(3), 2449-2470. |
| [29] | Xu, H. J., Wang, X. P., and Zhang, X. X. Decreased vegetation growth in response to summer drought in Central Asia from 2000 to 2012. International Journal of Applied Earth Observation and Geoinformation, 2016, 52, 390-402. |
| [30] | Qiu, B., Li, W., Zhong, M., Tang, Z., and Chen, C. Spatiotemporal analysis of vegetation variability and its relationship with climate change in China. Geo-spatial Information Science, 2014, 17(3), 170-180. |
| [31] | Liu, Y., Li, Y., Li, S., and Motesharrei, S. Spatial and temporal patterns of global NDVI trends: Correlations with climate and human factors. Remote Sensing, 2015, 7(10), 13233-13250. |
| [32] | Wang, H., Chen, A., Wang, Q., and He, B. Drought dynamics and impacts on vegetation in China from 1982 to 2011. Ecological Engineering, 2015, 75, 303-307. |
| [33] | Zhang, Y., Gao, J., Liu, L., Wang, Z., Ding, M., and Yang, X. NDVI-based vegetation changes and their responses to climate change from 1982 to 2011: A case study in the Koshi River Basin in the middle Himalayas. Global and Planetary Change, 2013, 108, 139-148. |
| [34] | Brown, M. E., Lary, D. J., Vrieling, A., Stathakis, D., and Mussa, H. Neural networks as a tool for constructing continuous NDVI time series from AVHRR and MODIS. International Journal of Remote Sensing, 2008, 29(24), 7141-7158. |
| [35] | Mao, D., Wang, Z., Luo, L., and Ren, C. Integrating AVHRR and MODIS data to monitor NDVI changes and their relationships with climatic parameters in Northeast China. International Journal of Applied Earth Observation and Geoinformation, 2012, 18, 528-536. |
| [36] | Aynekulu, E. Forest diversity in fragmented landscapes of northern Ethiopia and implications for conservation. 2011. PhD Thesis, Bonn University, Germany. |
| [37] | Nyssen, J., Vandenreyken, H., Poesen, J., Moeyersons, J., Deckers, J., Haile, M., Salles, C. and Govers, G. Rainfall erosivity and variability in the Northern Ethiopian Highlands. Journal of Hydrology, 2005, 311(1), 172-187. |
| [38] | Abegaz, A. Farm management in mixed crop-livestock systems in the Northern Highlands of Ethiopia. 2005. PhD dissertation. Wageningen University, Netherlands. |
| [39] | Qu, B., Zhu, W., Jia, S., and Lv, A. Spatiotemporal changes in vegetation activity and its driving factors during the growing season in China from 1982 to 2011. Remote Sensing, 2015, 7(10), 13729-13752. |
| [40] | Erasmi, S., Schucknecht, A., Barbosa, M. P., and Matschullat, J. Vegetation greenness in northeastern Brazil and its relation to ENSO warm events. Remote Sensing, 2014, 6(4), 3041-3058. |
| [41] | Ruane, A. C., Goldberg, R., and Chryssanthacopoulos, J. Climate forcing datasets for agricultural modeling: Merged products for gap-filling and historical climate series estimation. Agricultural and Forest Meteorology, 2015, 200, 233-248. |
| [42] | Mitchell, T. D., and Jones, P. D. An improved method of constructing a database of monthly climate observations and associated high-resolution grids. International journal of climatology, 2005, 25(6), 693-712. |
| [43] | Trouet, V., and Van Oldenborgh, G. J. KNMI Climate Explorer: a web-based research tool for high-resolution paleoclimatology. Tree-Ring Research, 2013, 69(1), 3-13. |
| [44] | Li, C., Qi, J., Yang, L., Wang, S., Yang, W., Zhu, G., Zou, S. and Zhang, F. Regional vegetation dynamics and its response to climate change—a case study in the Tao River Basin in Northwestern China. Environmental Research Letters, 2014, 9(12), 125003. |
| [45] | Herrmann, S. M., Anyamba, A., and Tucker, C. J. Recent trends in vegetation dynamics in the African Sahel and their relationship to climate. Global Environmental Change, 2005, 15(4), 394-404. |
| [46] | Peng, J., Li, Y., Tian, L., Liu, Y., and Wang, Y. Vegetation dynamics and associated driving forces in Eastern China during 1999–2008. Remote Sensing, 2015, 7(10), 13641-13663. |
| [47] | Verbyla, D. Remote sensing of interannual boreal forest NDVI in relation to climatic conditions in interior Alaska. Environmental Research Letters, 2015, 10(12), 125016. |
| [48] | Yang, X., Liu, S., Yang, T., Xu, X., Kang, C., Tang, J., Wei, H., Mihretab G. and Li, Z. Spatial-temporal dynamics of desert vegetation and its responses to climatic variations over the last three decades: a case study of Hexi region in Northwest China. Journal of Arid Land, 2016, 8(4), 556-568. |
| [49] | Bao, G., Qin, Z., Bao, Y., Zhou, Y., Li, W., and Sanjjav, A. NDVI-based long-term vegetation dynamics and its response to climatic change in the Mongolian Plateau. Remote Sensing, 2014, 6(9), 8337-8358. |
| [50] | Lin, X. S., Tang, J., Li, Z. Y., and Li, H. Y. Vegetation greenness modelling in response to interannual precipitation and temperature changes between 2001 and 2012 in Liao River Basin in Jilin Province, China. SpringerPlus, 2016, 5(1), 1173. |
| [51] | Breckle, S.W. Walter’s vegetation of the earth: the ecological systems of the geo biosphere, 4th Edn. 2002. Springer, Berlin. |
| [52] | Piao, S., Fang, J., Zhou, L., Zhu, B., Tan, K., and Tao, S. Changes in vegetation net primary productivity from 1982 to 1999 in China. Global Biogeochemical Cycles, 2005, 19(2). |