Mohammed El-Quilish1, Mohamed El-Ashquer1, Gomaa Dawod2, Gamal El Fiky1
1Construction Engineering and Utilities Department, Faculty of Engineering, Zagazig University, Zagazig, Egypt
2Survey Research Institute, National Water Research Center, Giza, Egypt
Correspondence to: Mohammed El-Quilish, Construction Engineering and Utilities Department, Faculty of Engineering, Zagazig University, Zagazig, Egypt.
| Email: |  |
Copyright © 2018 The Author(s). Published by Scientific & Academic Publishing.
This work is licensed under the Creative Commons Attribution International License (CC BY).
http://creativecommons.org/licenses/by/4.0/

Abstract
A high accuracy Digital Elevation Model (DEM) for the Nile delta region, Egypt is needed for several environmental applications, particularly for investigating the hazardous impacts of sea level rise and land subsidence phenomena. Since there is no official published national DEM for Egypt, an original high accuracy local digital elevation model (LDEM) for that region has been created using nine Spatial Interpolation Methods (SIMs) within a Geographic Information Systems (GIS) environment. The interpolation process took place after digitizing over than 220 topographic maps of scale 1:25,000, where more than 810,000 elevation (spot heights) points have been extracted from these maps. Multiple parameters and criteria for each SIM were applied to reach the optimal settings to produce a LDEM for environmental applications. The developed LDEMs have been compared against eight free Global Digital Elevation Models (GDEMs) using about 200 known GPS/levelling Ground Control Points (GCPs), where a statistical assessment has been accomplished for both GDEMs and LDEMs residuals after applying a vertical and horizontal datum matching for all the used data sets, and an outlier detection procedure. Also, a Reliability Index (RI) has been calculated to determine the best DEM for the Nile Delta region. The accomplished results showed that EARTHEnv-DEM90 attained the highest RI of 5.47 as the optimum global DEM. For local DEM's interpolation methods, it is concluded that the Kriging-based local DEM attained highest RI of 9.27. Consequently, it has been concluded that the new developed high accuracy LDEM improves the overall accuracy and reliability of the best available GDEM by almost 41%, and, hence, it is appropriate for geospatial, environmental, and GIS studies in Egypt.
Keywords:
Digital Elevation Model (DEM), Spatial Interpolation Methods (SIMs), GPS/levelling, GIS
Cite this paper: Mohammed El-Quilish, Mohamed El-Ashquer, Gomaa Dawod, Gamal El Fiky, Development and Accuracy Assessment of High-Resolution Digital Elevation Model Using GIS Approaches for the Nile Delta Region, Egypt, American Journal of Geographic Information System, Vol. 7 No. 4, 2018, pp. 107-117. doi: 10.5923/j.ajgis.20180704.02.
1. Introduction
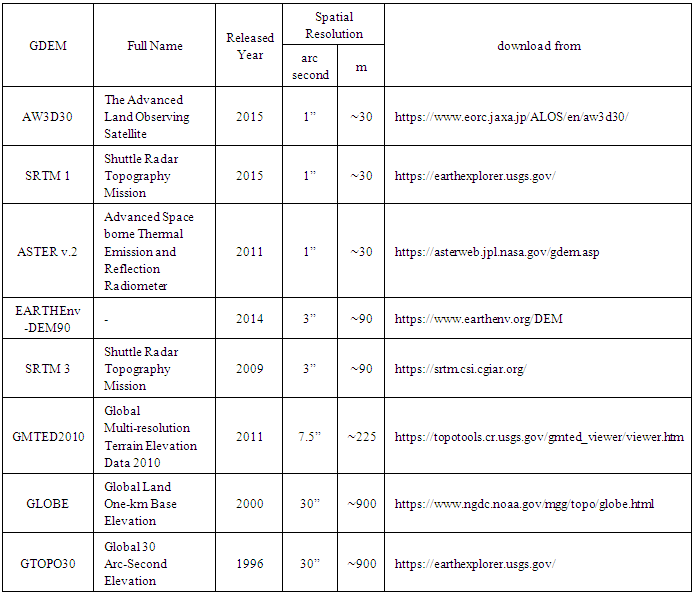
A Digital Elevation Model (DEM) is a digital cartographic representation of ground surface topography or terrain’s elevations with different accuracies for different field applications. It is also defined as a quantitative 3D representation of the Earth’s surface providing basic information about the terrain relief and considered one of the most popular data models used for the purpose of terrain modeling. DEM has been applied to a wide range of GIS, surveying, civil engineering and military planning tasks and applications depending on its accuracy such as: geomatics, geodetic, geological, hydrological, environmental, meteorological studies, and Mapping applications. Even though there are several available free global DEMs, their accuracy and spatial resolutions vary significantly, and a national DEM is required in several countries for national spatial Infrastructure and other accurate geospatial applications (e.g. Verhulp, 2015, and Kokkonen et al., 2017).For Egypt, it is a matter of fact that there is no official published precise LDEM, and several research studies have been carried out using global DEMs despite their poor accuracies. On the other hand, many scholars have developed LDEM in the last two decades. For example, Abd-Elmotaal (1999, 2004, 2009, 2011, 2013), and Abd-Elbaky et al. (2009) have created several detailed DEMs with 1” arc-sec spatial resolution for Egypt and the surrounding region using the ASTER GDEM and filled the gaps with 30′′×30′′ SRTM30+ after using the kriging interpolation technique to the same grid size. El-Sagheer (1995, and 2004) has developed a LDEM for EGYPT (called DTM-2003) through digitizing 1:250,000 and 1:100,000 hard copy topographic maps. Shaker (2015) has introduced an approach for contour-based DEM generation based on multiple polynomials interpolation from 1:100,000 topographic contours for Sinai Peninsula, with a vertical accuracy of 2.38 m. (Rabah et al., 2017) have compared three GDEMs (namely SRTM 1, SRTM 3, and ASTER) over precise GPS/levelling control points. Their results showed that the SRTM 1 had the smallest differences and the most accurate one, that it produced mean height difference and standard deviations equal 2.89 and ±8.65 m respectively. Dawod and Al-Ghamdi (2017) have investigated the reliability of eight recent GDEMs (namely EarthEnv-D90, SRTM 1, SRTM 3, ASTER, GMTED2010, GLOBE, GTOPO30, and AW3D30) for geomatics and GIS applications in the Nile delta region, where 416 GPS/levelling control points. They have introduced the reliability Index (RI), which is a statistical measure for judging DEMs based on the weighted average mean concept, and they have applied for the study area. Their results showed that the EarthEnv-D90 and SRTM1 models attain high RI in the Nile delta region. Several GDEM have been developed and released in the last two decades. Nevertheless, their spatial resolution, precision and accuracy vary significantly. In this research, eight existing GDEMs were freely downloaded from their respective websites and utilized in order to cover the study area namely (AW3D30, ASTER EARTHEnv-DEM90, GLOBE, GMTED2010, GTOPO30, SRTM1, and SRTM3). Table 1 summarizes the characteristics of these selected GDEMs. Table 1. Characteristics of the utilized global DEM
 |
| |
|
On another hand, the suitability of various interpolation methods for creating DEMs comprises a major issue that has been studied in several papers. For example, Her (2008) has evaluated the potential and performance of seven interpolation techniques as a means of resolution refining for hydrological applications. The obtained elevation, slope, aspect, sink, and stream networks from the interpolated DEM were compared quantitatively with those derived from the original DEM. The results showed that the interpolation techniques were not significantly different in deriving elevation, total flow length, and delineating watersheds. However, all methods produced shallower slopes than the original DEM and had a smoothed surface with fewer sinks. Additionally, Luo, (2008) has compared seven spatial interpolation techniques to determine their suitability for estimating daily mean wind speed surfaces, from data recorded at nearly 190 locations across England and Wales. Cross – validation was used to evaluate the performance of each interpolation method by calculating the RMSE for each interpolation method. The results indicated that Kriging was most likely to produce the best estimation of continuous surface for wind speed in the study area. Moreover, Sun (2009) has compared three interpolation methods to determine their suitability for interpolating depth to groundwater in the Minqin oasis of northwest China. Attained results indicated that simple Kriging was the optimal method for interpolating depth to groundwater in the study area. Also, Eldrandaly (2011) has compared six GIS-based SIMs to determine their suitability for estimating mean monthly air temperature surfaces in Western Saudi Arabia. The interpolation techniques included four deterministic methods (IDW, Global Polynomial, Local Polynomial, and Radial Basis Function ‘Thin-Plate Spline’) and two geostatistical methods (Ordinary Kriging, and Universal Kriging). Quantitative assessment of the continuous surfaces showed that there was a large difference between the accuracy of the six interpolation methods and that the geostatistical methods were superior to the deterministic methods. Ikechukwu et al. (2017) examined the accuracy of SIMs in modeling landform (topography) in relation to their mathematical formulation. The performance of Kriging, IDW and Spline interpolation methods were evaluated theoretically, mathematically and experimentally in estimating unobserved elevation values and modeling landform. A comparative analysis based on the prediction mean error, prediction RMSE and cross validation outputs of these SIMs were evaluated and the results showed that Spline provided a better and more accurate interpolation within the sample space than the IDW and Kriging methods. This research study has two main objectives: investigating the optimum spatial inteerpolation method to create LDEM for detailed environmntal applications; and comparing the accuracy of the developed LDEM versus the available GDEM using GPS/levelling accurate terrstrial geodetic datasets, within a GIS enviroment.
2. Study Area and Available Data
The study area covers most of the Nile delta region north of Egypt from Alexandria at the west (29.6°E) to Port Said at the east (32.3°E) and from the northern Mediterranean coasts at the north (31.6°N) to Cairo at the south (30.0°N), as shown in (Figure 1). It is bounded by the two branches of the Nile river “Damietta and Rosetta”, and extending from both sides to cover coastal areas, with an overall area of approximately 23,235 km2. The length of the study area is approximately 180 km from north to south, and it covers about 300 km of coastline at the Mediterranean Sea (17.75% of the Egyptian Mediterranean coast). The shoreline is occupied by three major coastal lakes “Lake Burullus, Lake Idku, and Lake Mariut”. The Suez Canal runs to the east of the Delta, entering the coastal Lake Manzala in the northeast of the Delta. The topography of the region smoothly slopes northwards towards the Mediterranean coast, where the difference in elevation between its southern peak, at Cairo, and northern coastal fringes is approximately 18 meter (Embabi 2000).The available ground control points comprise almost 200 First-Order Bench Marks (BM) with measured accurate GPS coordinates, laying mainly on the two branches of the Nile river and on the coasts of the Mediterranean sea (Figure 1). This dataset has been utilized in evaluating the performance of GDEMs, and to judge the anticipated accuracy of the new developed LDEMs. The accuracy of these points is within five centimetres in both horizontal and vertical coordinates ((Dawod and Al-Ghamdi, 2017).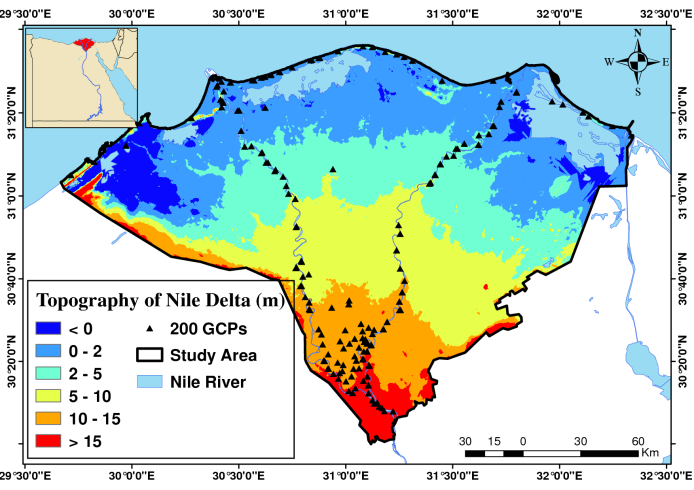 | Figure 1. The study area and The Available Ground Control Points |
3. Development of a Local DEM
3.1. Digitizing Process
The digitizing process was conducted by obtaining the available topographic maps for the study area as it is covered by 220 topographic maps scale 1:25,000 with contour interval of 50 cm. These maps were published by the survey of Egypt (1924-1951) and derived from ground surveys at the Nile Delta region. In addition, Topographic maps with scale of 1:50,000 and 1:100,000, with a contour interval of 1 m, have been also used to complete the missing zones of the study area due to damages at the 1:25,000 topographic maps. Then, georeferencing and projection process for the horizontal datum was conducted for each one of these maps using the built-in projection tool in ArcGIS from ETM red belt / GCS Egypt 1907 projection to WGS84. That step was just used in the comparison stage of all GDEM and LDEM, while the final LDEM was produced with respect to the local coordinates system. Furthermore, these maps were manually digitized by extracting all the available contour lines and elevation (spot heights) points. The obtained data were about 810,534 points (92,071 from spot height points and 718,463 from contour lines) with an average density of 35 elevation points/km² (Figure 2). Once the digitizing process was completed, LDEMs were created using nine different SIMs.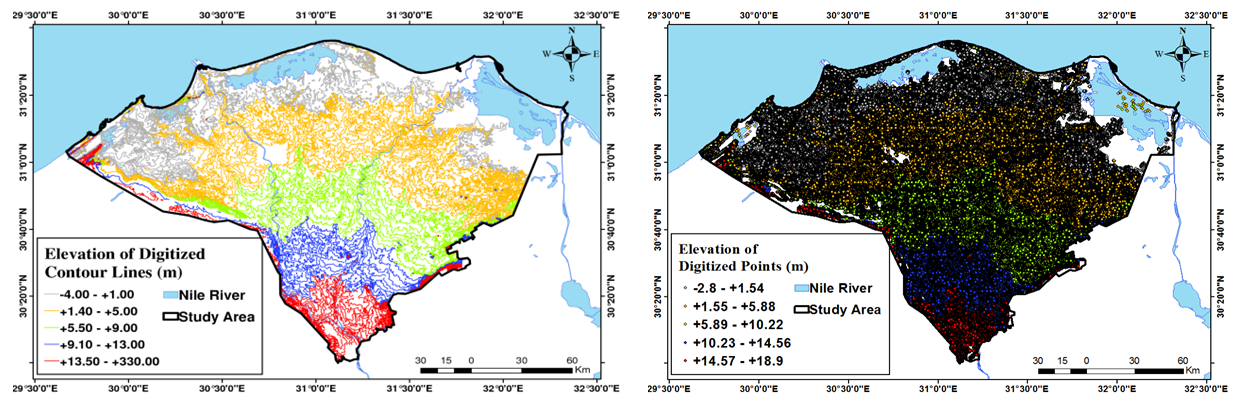 | Figure 2. The digitized contour lines (left), elevation points (right) from the topographic maps of the Delta region |
3.2. Spatial Interpolation Process and Creating LDEMs
Interpolation is the process of using points with known values or sample points to estimate values at other unknown points. It can be used to predict unknown values for any geographic point data, such as elevation, rainfall, chemical concentrations, noise levels, etc. (Mitas, 1999). It is important to mention that no single interpolation method is optimal in all conditions, or that a given interpolation method does better than the other without taking into consideration, the aim of the study, type and nature of the dataset, and phenomenon involved. So, the best interpolation method for a specific situation can only be obtained by comparing the different methods results (e.g., Pohjola, 2009, and Ikechukwu et al., 2017). This research study has utilized nine SIMs, namely the Inverse Distance Weighted (IDW), Natural Neighbour Inverse Distance Weighted (NNIDW), Global Polynomial Interpolation (GPI), Spline with Barriers (SWB), Topo to Raster (TTR), Kriging, Radial Basis Function (RBF), Empirical Bayesian Kriging (EBK), and Local Polynomial Interpolation (LPI). Further more, multiple parameters and criteria have been tested for each SIM to reach the optimal settings to produce a DEM. This research study aims to compare the performance of such SIMs trying to achieve the optimum one to be utilized in creating a LDEM for environmental applications.
4. DEM Evaluation
4.1. Vertical Datum Matching
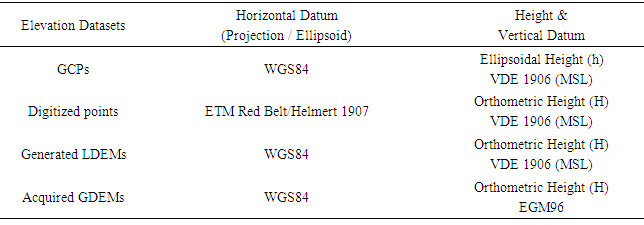
Geodetic datums represent positioning surfaces to which all geodetic measurements are refereed. The geodetic vertical datum conceptually enables a definition of the height of benchmarks in levelling network with respect to some adopted reference surface. For the orthometric height system, the geoid is adopted as the reference surface, which may be defined in a sense as the equipotential surface which best approximates the Mean Sea Level (MSL) over the whole earth. Many elevation datasets were used in this paper, and each one of them has different datums (Table 2). Before conducting any evaluations on the GDEMs or the LDEMs a unification on the datums must be occurred to unify all the horizontal datums into The World Geodetic System 1984 (WGS84), and all the vertical datums into The Geodetic Vertical Datum in Egypt (VDE1906) which has been set as the MSL at Alexandria harbor, based on daily readings of high and low water level during the years 1898 to 1906 (Cole 1939). Table 2. List of HZ and VL Datum for different elevation datasets used in this paper
 |
| |
|
As GCPs measured from the GPS uses and computes their heights relative to the WGS84, and its ellipsoidal height (h) were vertically referenced to the local geopotential geoid model (MSL). Hence, it is important for comparison of GCPs with other DEMs to consider a conversion for the ellipsoidal heights (h) into orthometric heights (H) using local geoid undulations (NVDE1906). As geoid undulation (N) can be defined as the difference between the reference ellipsoidal height from GPS (h) and the orthometric height from levelling (H) as shown in (Figure 3) and derived in (equation 1).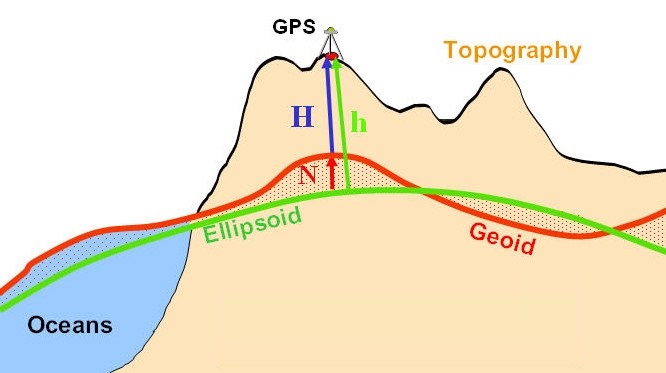 | Figure 3. Orthometric, geoid, and ellipsoid heights |
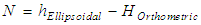 | (1) |
As for the Elevation points (DPs) digitised from the topographic maps its vertical datum is VDE1906 which can be considered as the MSL. DPs coordinates were transformed into horizontal datum WGS84 using built-in projection tools in ArcGIS.As LDEMs were generated from the DPs, they use and compute their heights relative to WGS84. And their orthometric heights (H) were referred to the local geoid model VDE1906, for that no conversion was required for these models.In order to match the same vertical datum for GDEM, their heights were derived for all 200 GCPs through bilinear interpolation using GIS techniques from the surrounding grid points of the original spatial resolution of each GDEM. Such interpolated DEM orthometric heights (HEGM96) that were vertically referenced to the global geopotential model Earth Gravitational Model 1996 (EGM96) were then transformed to ellipsoidal heights (hGDEM) using geoid undulations from EGM96 (NEGM96) as shown in (equation 2).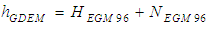 | (2) |
Finally, a transformation on ellipsoidal heights (hGDEM) to orthometric heights (HEGY-HGM2016) using hybrid local geoid model undulations for Egypt (NEGY-HGM2016) was conducted as shown in (equation 3). Where Hybrid local geoid model for Egypt (EGY-HGM2016) involves different datasets in terms of gravity anomalies determined from the GOCE (gravity field and steady-state ocean circulation explorer) and EGM2008 combined with terrestrial gravity datasets. In addition, orthometric heights from GPS/levelling measurements had been considered during the modelling process to improve the determination of the hybrid gravimetric geoid over the Egyptian region (El-Ashquer et al., 2017). | (3) |
A statistical evaluation for the difference between HEGM96 and HEGY-HGM2016 for all GDEMs is presented in Table 3. As a lot of significant difference exists between the EGM96 global geoid model and the hybrid local geoid model for Egypt as most geoid can only approximate the real shape of the earth.Table 3. Statistical evaluation for the difference between HEGM96 and HVDE1906 for all GDEMs
 |
| |
|
All farther evaluations on the GDEMs conduct their statistical calculations on the new generated orthometric heights (HEGY-HGM2016) which use hybrid local geoid model for Egypt.
4.2. DEMs Validation with GCPs
Nine LDEM have been developed, in this research study, based on the utilized SIMs, and their accuracies have been evaluated. The evaluation of the DEMs performance is based on the height difference, DEM errors, or the residuals (ΔH) between GCPs (Hm) and its corresponding DEM-based elevation (HDEM) which were extracted from each GDEMs and LDEMs by deriving all 200 GCPs through bilinear interpolation at the point location using GIS techniques, as shown in Figure 4 and Figure 5. These differences help to identify large-scale systematic errors “such as offsets” and small-scale anomalies “such as voids” in the individual models.  | (4) |
After determining ΔH for each DEM, several statistical measures were calculated, and the utilized basic equations are just briefed herein. First an outlier detection and removing procedure was conducted on the raw residual data set (ΔH) using Z score statistical test, as outliers and gross errors in DEMs which considered as an erroneous observation that appears to depart significantly from the remaining observations of the sample corrupt statistical accuracy measures. | (5) |
Where, (Y) is an observation,  denotes the sample mean, and (SD) is the sample standards deviation. If the absolute of the computed (Zi) score, for each observation, is compared against the value of (3SD) and the score exceeds the given limits, it is considered as a possible outlier and should be removed.
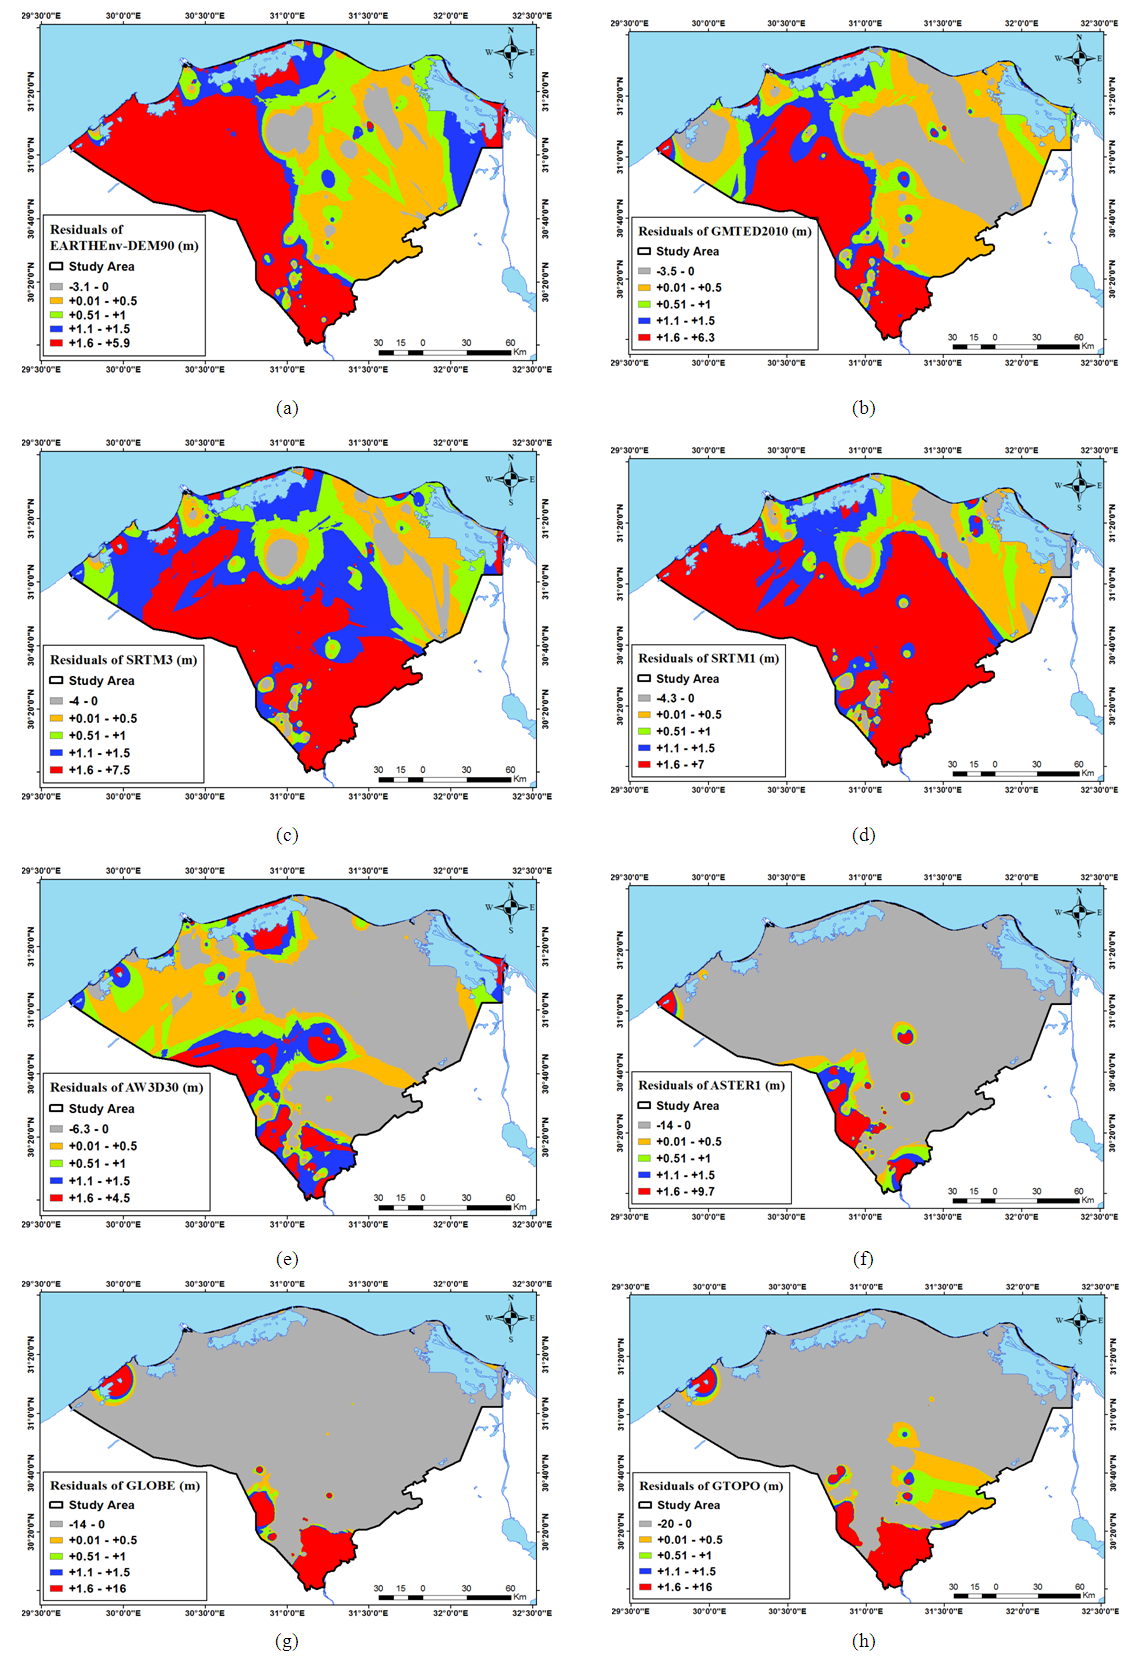 | Figure 4. Residuals of global DEM in Nile delta study area (a) EARTHEnv3 DEM; (b) GMTED2010 DEM; (c) SRTM 3 DEM; (d) SRTM 1 DEM; (e) AW3D30 DEM; (f) ASTER DEM; (g) GLOBE DEM; (h) GTOP30 DEM |
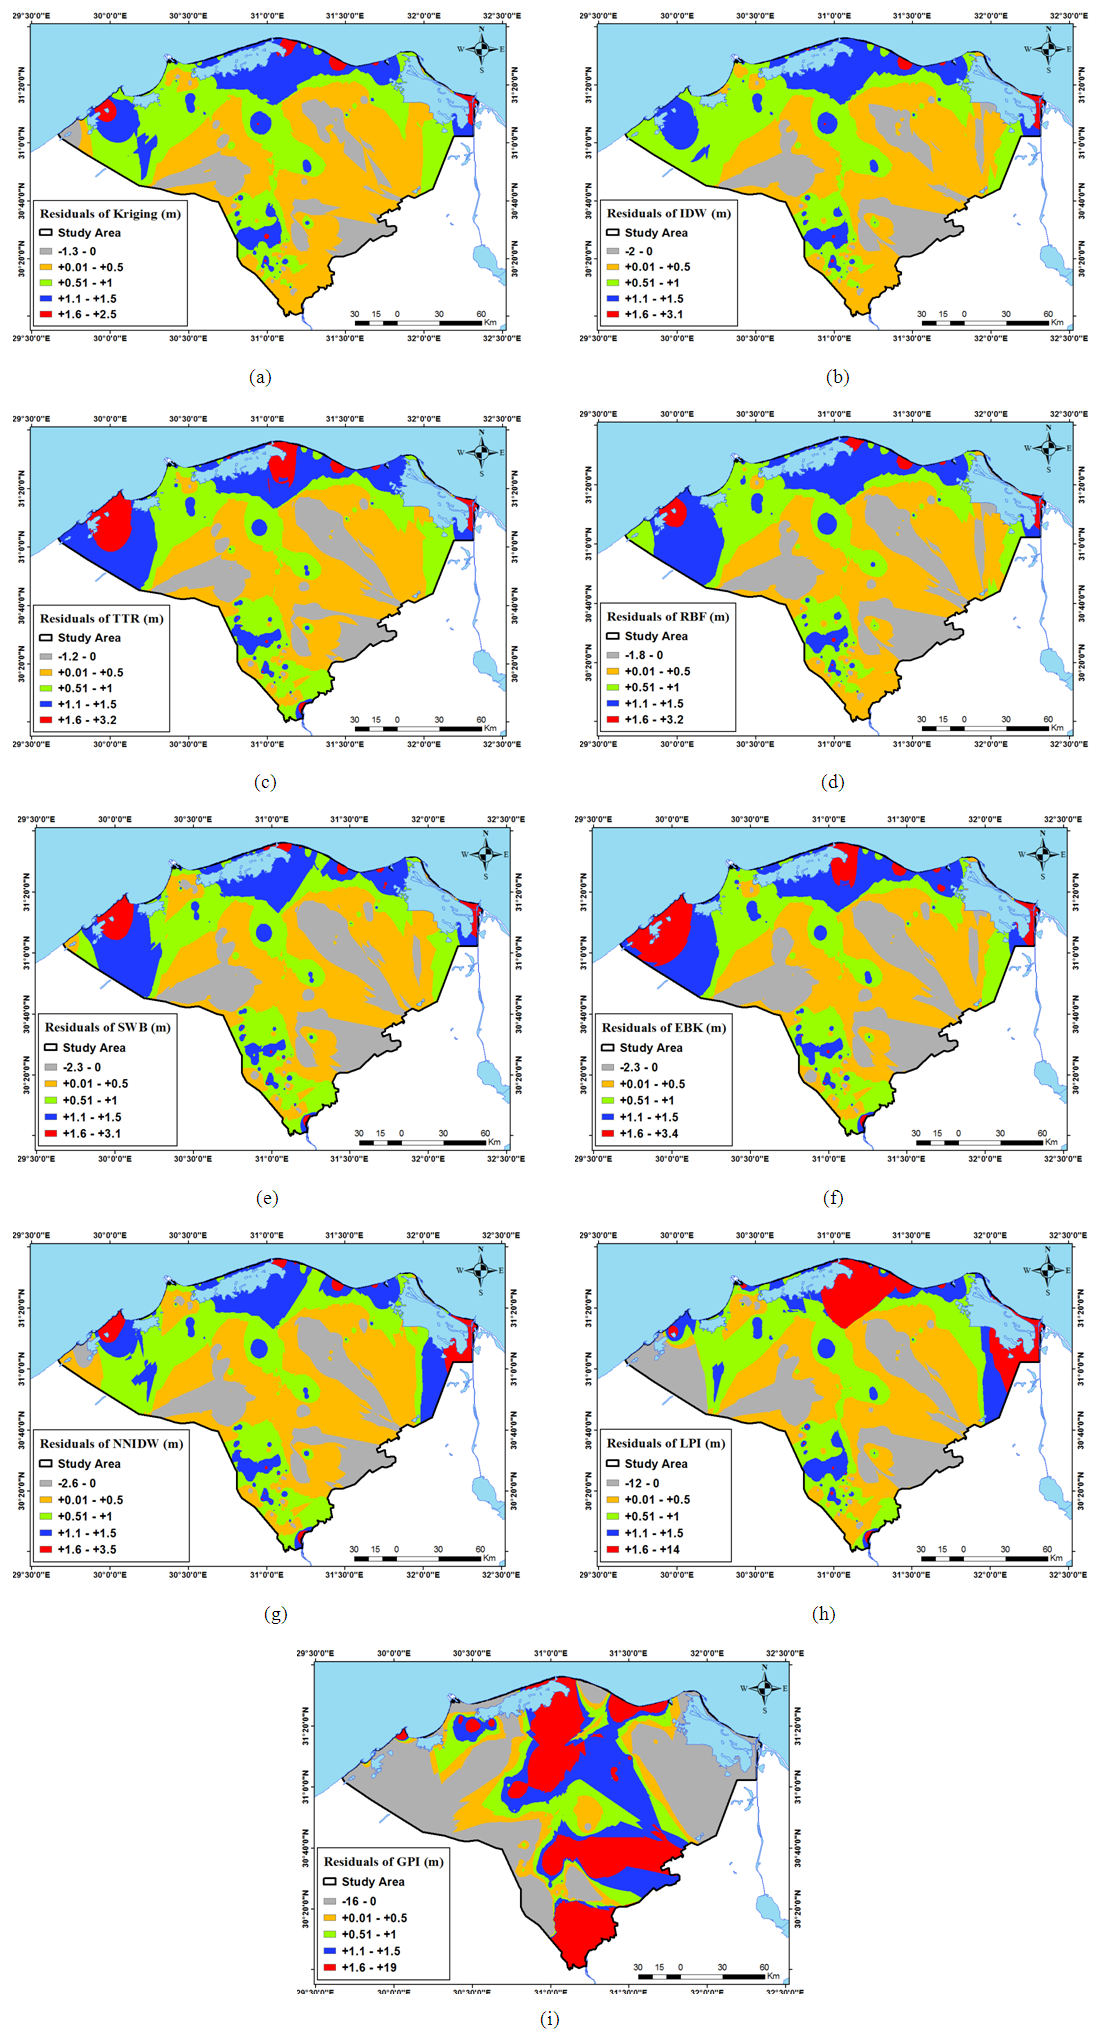 | Figure 5. Residuals of local DEM in Nile delta study area. (a) Kriging DEM; (b) IDW DEM; (c) TTR DEM; (d) RBF DEM; (e) SWB DEM; (f) EBK DEM; (g) NNIDW DEM; (h) LPI DEM; (i) GPI DEM |
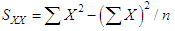
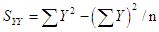
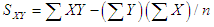
Next, six statistical measures have been calculated and evaluated individually:1. The correlation coefficient between observed elevations of the control points (X or Hm) and their respective elevation from a particular DEM (Y or HDEM) is computed as: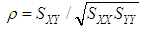 | (6) |
 | (7) |
 | (8) |
 | (9) |
Where (ρ) represents the correlation coefficient between (X) and (Y), (ΣX), (ΣY), and (ΣXY) are the summation of (X), (Y), and (XY) respectively, and (n) is the total number of available sample points.2. The range of (ΔH) is evaluated as the difference between the maximum and minimum computed from the (ΔH) for each DEM.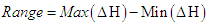 | (10) |
3. The standard deviation (SD) of (ΔH) is computed as: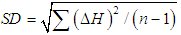 | (11) |
Where (n) is the number of the utilized control points.4. The skewness (Sk) is computed as: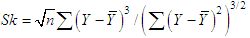 | (12) |
5. The kurtosis (Kr) is computed as: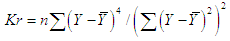 | (13) |
6. Root Mean Square Error (RMSE) is computed as: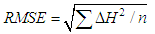 | (14) |
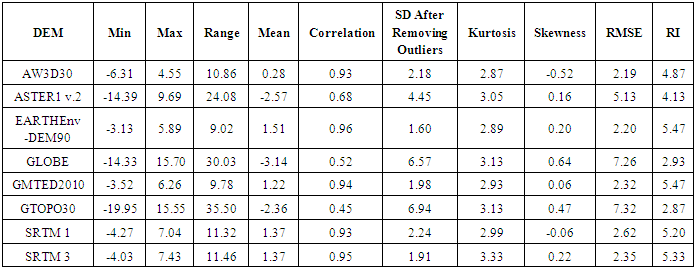
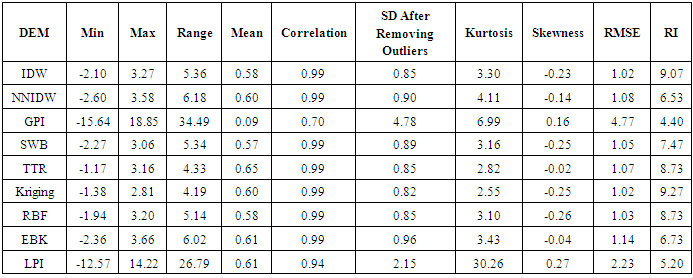
In the first evaluation step, the statistical results for the utilized DEMs have been computed and presented in Table 4, and Table 5. It can be realized from this Table 4 that the EARTHEnv-DEM90 and SRTM3 have the biggest correlation to the observed values. Next, the outlier detection procedure has been applied using the Z-score approach and if the score exceeded the limits, it is considered as a possible outlier and removed. A comparison between these two tables emphasis the fact that removing outliers enhances the accuracy performance of geodetic datasets. After removing outliers, it can be seen that, the EarthEnv-DEM90 and SRTM3 models attain the smallest standard deviation ±1.60, and ±1.91 m, respectively. As for Table 5, it can be realized that most LDEMs have high correlation of 0.99 to the observed values. After applying the outlier detection procedure using the Z-score approach and removing all the possible outliers, it can be seen that, the LDEM interpolated from Kriging and IDW SIMs attain the smallest standard deviation ±0.82, and ±0.85 m, respectively. These accuracy measures for both the GDEMs and LDEMs confirm the known fact that GDEMs should not be the first option to be utilized in high-precision geomatics activities. Next, the height differences or DEMs’ residuals (ΔH) have been computed, for all utilized models. From Table 4, and Table 5, it can be realized that the EarthEnv-DEM90 model has the lowest mean value of the GDEM residuals, while Kriging has it for LDEMs residuals. Additionally, the EarthEnv-DEM90 model has the smallest error range of the GDEMs as for LDEMs the DEM interpolated from Kriging SIM has the smallest error range. Consequently, it can be said that judgment of DEMs performance cannot be evaluated based on just one statistical quantity.Table 4. Statistical measures of GDEM elevations in delta region (m)
 |
| |
|
Table 5. Statistical measures of LDEM elevations in delta region
 |
| |
|
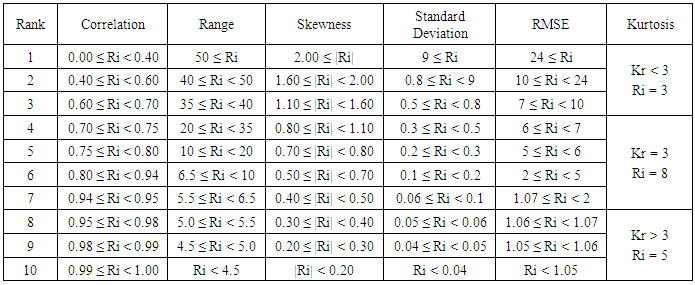
Next, for that the six statistical measures attained for each DEM were categorized in a certain manner and a specific rank was assigned for each statistical measure based on the frequency distribution of their values to assure a uniform distribution for all the models across its range (Table 6). For the correlation, range, skewness, RMSE, and standard deviation measures, the ranks vary from 1 to 15 based on the ascending order of those measures for each DEM. Table 6. Statistical Measures Ranks
 |
| |
|
Finally, a unique reliability index (RI) has been proposed and computed based on the ranks of the statistical measures for each DEM Where (ΣW) denotes the sum of the utilized weight, i.e. 15. It is based on the weighted mean approach, as it ranges from zero as the lowest reliability of a DEM, to value of 15 which represents the highest reliability (Dawod and Al-Ghamdi, 2017). The selected weights (Wj) are shown in Table 7. Since the SD and RMSE are the basic statistical measures of DEM's vertical accuracy, they are given the largest weights in computing the reliability index. The RI measure is computed as: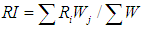 | (15) |
Where (ΣW) denotes the sum of the utilized weight, i.e. 15.Table 7. Statistical Weights
 |
| |
|
Hence, it can be seen that, for GDEMs the EARTHEnv-DEM90 and GMTED2010 models attain highest RI as both have 5.47, and the older DEMs, namely GLOBE and GTOPO30, came in the last places with RI of 2.93, 2.87 respectively. As for LDEMs the LDEM interpolated from Kriging and IDW SIMs attain the highest RI of 9.27, 9.07 respectively.
4.3. GDEM versus LDEM Comparison
For the pixel-to-pixel comparison between GDEM and LDEM, as it is of course a compromise to compare two different sensors, characterized by different technologies and resolutions, it was important to make sure that all DEMs were under the same horizontal resolution of 90 m (3” arc-sec) to ensure that both datasets become spectrally consistent.The comparison was made by subtracting the raster maps of the best GDEM “EARTHEnv-DEM90” from the raster maps of the best LDEM “Kriging” using raster math tool in ArcGIS and producing a new raster map that presents all the height differences between each cell of the DEMs to show how they fit to each other, to locate areas of larger discrepancies, and to detect large-scale systematic effects (Figure 6). The results of the comparison map showed that the height differences are higher in urban areas and lower at water surface areas than in areas where bare ground can be sensed from space. This is can be explained as the heights of all GDEMs are considered DSM which reflects the surface of the Earth (including vegetation and buildings) rather than its actual topography, on the other hand the heights of all LDEMs are considered DTM which reflects the surface of the actual topography only (Figure 6). 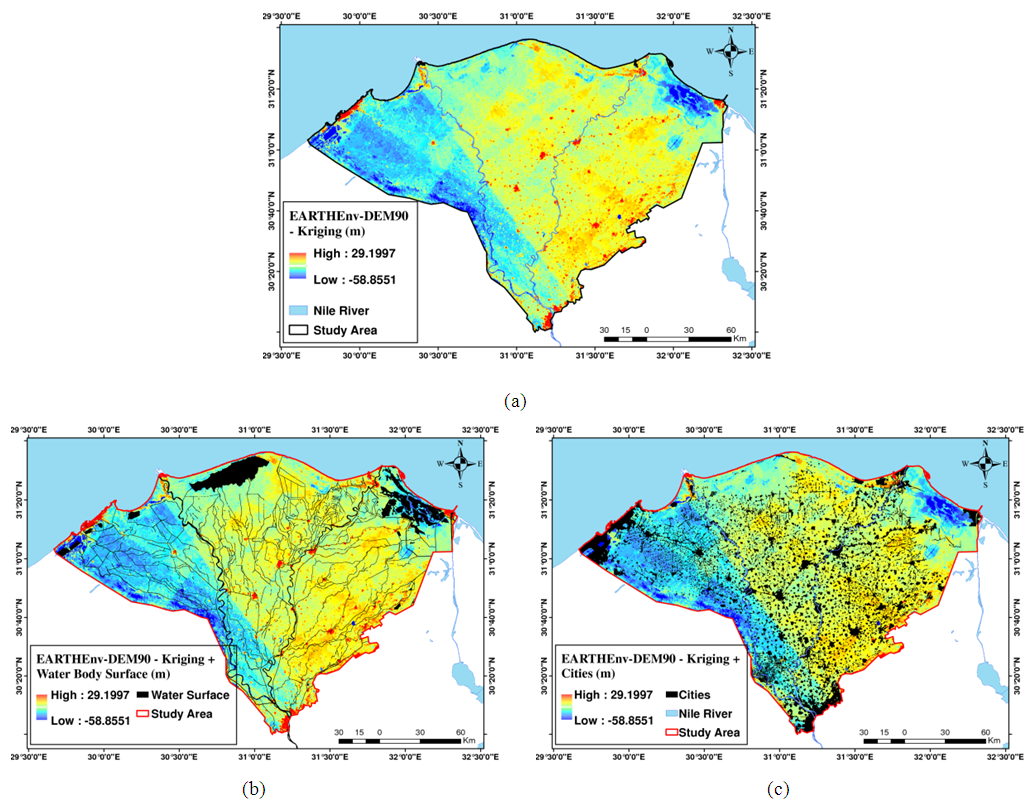 | Figure 6. a) the result of subtracting GDEM EARTHEnv-DEM90 from LDEM Kriging. b) Using water body surfaces to cover –ve results of subtraction. C) Using land use map to cover the +ve results of subtraction |
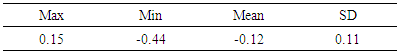
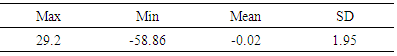
A statistical evaluation for the comparison between the best GDEM “EARTHEnv-DEM90” and the best LDEM “Kriging” is presented in Table 8.Table 8. A statistical evaluation for the comparison between the best GDEM and the best LDEM
 |
| |
|
5. Summary and Conclusions
Egypt, as many developing countries, has no officially published precise local DEM, and mainly depends on available global DEMs for several environmental and GIS applications despite their low accuracies. Consequently, a precise national DEM is required for monitoring environmental hazards, such as the sea level rise particularly in deltas and coastal regions. This research study has utilized GIS techniques and approaches to create an original high accuracy LDEM for the Nile delta region, Egypt by digitizing over 220 topographic maps then applying nine spatial interpolation methods (namely; IDW, NNIDW, GPI, SWB, TTR, Kriging, RBF, EBK, and LPI). On the other hand, the study investigated the accuracies of eight recent GDEMs (namely; EarthEnv-D90, SRTM1, SRTM 3, ASTER, GMTED2010, GLOBE, GTOPO30, and AW3D30) which were downloaded from their respective websites and utilized with the study area. About 200 known GPS/levelling ground control points have been utilized to evaluate the performance and accuracy of both the GDEMs and the newly-developed LDEMs. The DEMs validation with ground control points was carried out based on the statistical assessment using six statistical measures including (range, standard deviation, root mean square error, correlation, kurtosis, and skewness). Prior to the actual evaluation process, DEMs datum matching was performed where vertical datum for all the used data sets were unified into the vertical datum of Egypt, and the horizontal datums into WGS84, also an outlier detection step has been applied which enhances the accuracy performance of geodetic datasets. It is concluded that judgment of DEMs performance cannot be evaluated based on just one statistical quantity. Therefore, an overall reliability index (RI) has been calculated to determine the best DEM from all the deduced LDEMs and the available GDEMs for the Nile Delta region.The accomplished results showed that the EARTHEnv-DEM90 and GMTED2010 global models attain high RI of 5.47, and the older DEMs, namely GLOBE and GTOPO30, came in the last places as they have RI of 2.93, 2.87 respectively. Therefore, despite their low accuracies, GDEMs present a good candidate when accurate LDEMs are not available. As for LDEMs, the models interpolated utilizing the Kriging and IDW SIMs attain the highest RI equal 9.27, 9.07 respectively. Accordingly, the IDW and Kriging could be the optimum interpolation methods for developing digital elevation models in the Nile delta region. Finally, it is found that the accuracy of the optimum developed LDEM has improved the overall accuracy of the best GDEM, in the study area, by almost 41%. So, a local precise DEM is extremely essential for geospatial, GIS, and environmental activities in Egypt and other developing countries. Finally, a pixel to pixel comparison was held between the best downloaded GDEMs and the best generated LDEMs and the results showed that the height differences are higher in urban areas and lower at water surface areas than in areas where bare ground can be sensed from space. This is can be explained as the heights of all GDEMs are considered DSM which reflects the surface of the Earth rather than its actual topography, on the other hand the heights of all LDEMs are considered DTM which reflects the surface of the actual topography only.
References
| [1] | Abd-Elmotaal, H. (1999). The EGHA99 Digital Height Models for Egypt. Proceedings of the 1st Minia International Conference for Advanced Trends in Engineering. Minia, Egypt: 1, 205–211. |
| [2] | Abd-Elmotaal, H. (2004). The AFH04 Digital Height Models for Africa. The IAG International Symposium on Gravity, Geoid and Space Missions "GGSM2004". Porto, Portugal. |
| [3] | Abd-Elmotaal, H. (2011). "The New Egyptian Height Models EGH10." NRIAG Journal of Geophysics (Special Issue 249–261). |
| [4] | Abd-Elmotaal, H. A., M. Abd-Elbaky, and M. Ashry, (2009). "30 Meters Digital Height Model for Egypt." 1st International Conference for a Unique Map of the Arab World (November 2016): 0-8. |
| [5] | Abd-Elmotaal, H. a. A., M. (2013). The 3 ′′ Digital Height Model for Egypt - EGH13. 8th International Conference of Applied Geophysics. Cairo, Egypt, February 25. |
| [6] | Cole, J. (1939). "Revision of first order levelling lower Egypt." Survey Department Paper No. 44, Egyptian Survey Authority, Giza, Egypt. |
| [7] | Dawod, G. and K. Al-Ghamdi (2017). "Reliability of Recent Global Digital Elevation Models for Geomatics Applications in Egypt and Saudi Arabia." Journal of Geographic Information System 09(06): 685-698. |
| [8] | El-Ashquer, M., B. Elsaka, and G. El-Fiky, (2017). "EGY-HGM2016: an improved hybrid local geoid model for Egypt based on the combination of GOCE-based geopotential model with gravimetric and GNSS/levelling measurements." Arabian Journal of Geosciences 10(11). |
| [9] | El-Sagheer, A. (1995). Development of a Digital Terrain Model for Egypt and its Application for a Gravimetric Geoid Determination. Shoubra Faculty of Engineering, Zagazig University, Egypt, Shoubra Faculty of Engineering. Ph.D. |
| [10] | El-Sagheer, A. (2004). Towards Updated Concrete Digital Terrain Model for Egypt: DTM-2003. Civil Engineering Research Magazine (CERM). Al-Azhar University: 26, 21, 158–179. |
| [11] | Eldrandaly, K. A. (2011). "Comparison of Six GIS-Based Spatial Interpolation Methods for Estimating Air Temperature in Western Saudi Arabia." Journal of Environmental Informatics 18(1): 38-45. |
| [12] | Embabi, N. (2000). "Sand dunes in Egypt, in Sedimentary Geology of Egypt: Applications and Economics, Part 1." The Sedimentological Society of Egypt: 45-87. |
| [13] | Her, Y., Heatwole, C (2008). Assessment of interpolation methods for refining SRTM and DEM. ASABE Annual International Meeting. Rhode Island. |
| [14] | Ikechukwu, M. N., E. Ebinne, U. Idorenyin, and N. I. Raphael (2017). "Accuracy Assessment and Comparative Analysis of IDW, Spline and Kriging in Spatial Interpolation of Landform (Topography): An Experimental Study." Journal of Geographic Information System 09(03): 354-371. |
| [15] | Luo, W., M. Taylor, and S. Paker, (2008). "A comparison of spatial interoplation methods to estimate continous wind speed surfaces using irregularly distributed data from England and Wales." International Journal of Climatology: 28, 947-959. |
| [16] | Kokkonen, A., Kylmäaho, J. and Ursin, H. (2017). "Arctic Spatial Data Infrastructure (Arctic SDI)." Presented in the FIG Working Week, May 29–June 2, Finland. |
| [17] | Mitas, L., and Mitasova, H. (1999). Spatial interpolation. In: Longley. Wiley, New Work. |
| [18] | Pohjola, J., Turunen, J. and Lipping, T. (2009). Creating High-Resolution Digital Elevation Model Using Thin Plate Spline Interpolation and Monte Carlo Simulation. 2009-56. Tampere University of Technology, Pori, Finland: pp60. |
| [19] | Rabah, M., A. El-Hattab, and M. Abdallahet (2017). "Assessment of the most recent satellite based digital elevation models of Egypt." NRIAG Journal of Astronomy and Geophysics 6(2): 326-335. |
| [20] | Shaker, A., Saad, Abdullah, Salah, Mahmoud., I. Salama, (2015). "Multiple polynomial-based generation of DEM from topographic contour data." Regional Conference on Surveying & Development (December). |
| [21] | Sun, Y., S. Kang, F. Li, and L. Zhang, (2009). "Comparison of interpolation methods for depth to groundwater and its temporal and spatial variations in the Minqin oasis of northwest China." Environmental Modelling & Software: 24, 1163-1170. |
| [22] | Verhulp, J. (2015). "Towards a national digital elevation model." Proceedings of the Geomatics Indaba Conference, August 11-13, Ekurhuleni, South Africa. |

 Abstract
 Reference
 Full-Text PDF
 Full-text HTML