-
Paper Information
- Paper Submission
-
Journal Information
- About This Journal
- Editorial Board
- Current Issue
- Archive
- Author Guidelines
- Contact Us
American Journal of Geographic Information System
p-ISSN: 2163-1131 e-ISSN: 2163-114X
2018; 7(3): 88-98
doi:10.5923/j.ajgis.20180703.03

Spatial Equity in Devolved Healthcare: Is It Quality or Quantity Causing Spatial Clustering in Maternal Health Utilization when Affordability has been Addressed?
 Abstract
 Reference
 Full-Text PDF
 Full-text HTML
Samuel Ouma Nyangueso , Patrick Odhiambo Hayombe, Fredrick Omondi Owino
Department of Spatial Planning and Development, Jaramogi Oginga Odinga University of Science and Technology, Bondo, Kenya
Correspondence to: Samuel Ouma Nyangueso , Department of Spatial Planning and Development, Jaramogi Oginga Odinga University of Science and Technology, Bondo, Kenya.
| Email: |  |
Copyright © 2018 The Author(s). Published by Scientific & Academic Publishing.
This work is licensed under the Creative Commons Attribution International License (CC BY).
http://creativecommons.org/licenses/by/4.0/

Devolved healthcare in Kenya, from onset, apparently concentrated on increasing, expanding, upgrading and refurbishment of health facilities as well as improving staff base among other interventions in a bid to decentralize health services closer to people. However, proximity and availability are seldom the reasons for patient provider choices and effective healthcare provisions. It isn’t uncommon for maternal patients to flock certain localities for healthcare irrespective of distance, especially in an environment where patients have freedom to choose providers and in the era of free maternity. The paper sought to spatially explore major cause of local spatial clustering for maternal health utilization within lowest decentralized units in Kenya. Applying multiple-case design, the study focused on County of Siaya and 30 Wards therein, as clusters for hotspot analysis of Antenatal Care and Skilled Birth Attendance before and after devolution in Kenya. Targeted descriptive analysis involving hot spot and cold spot Wards was done to provide qualitative explanations to the spatial analysis results. Retrospective patient-based surveys from Kenya’s Health Information System (DHIS 2), geolocation of health facilities from Kenya Master Health Facility List (KMHFL) and reviews of relevant literature supplied the requisite data by each registered health facility and by each Ward in Siaya County. Getis Ord Gi* hot spot analysis, using ArcGIS 10.3, revealed existence, persistence and intensifying spatial clustering of maternal healthcare utilization after devolution. Presence of established public referral health facility was largely responsible for the hot spots in maternal health services utilization, but not facility-to-population ratio as some facilities recorded zero maternal service offered. This implies that quality overrides quantity, and proximity, in patient choices of providers resulting into spatial clustering in utilization within respective decentralized units. Whereas increasing health facilities is well intentioned, their service utilization, quality and comprehensiveness are paramount in achieving spatial equity in devolved healthcare, especially in Kenya.
Keywords: Spatial equity, Quantity and quality of devolved healthcare, Spatial clustering, Kenya
Cite this paper: Samuel Ouma Nyangueso , Patrick Odhiambo Hayombe, Fredrick Omondi Owino , Spatial Equity in Devolved Healthcare: Is It Quality or Quantity Causing Spatial Clustering in Maternal Health Utilization when Affordability has been Addressed?, American Journal of Geographic Information System, Vol. 7 No. 3, 2018, pp. 88-98. doi: 10.5923/j.ajgis.20180703.03.
Article Outline
1. Introduction
- Operationalization of devolved healthcare was aimed at decentralizing primary health services closer to people by 47 county governments effective 2013 [1, 2]. According to Chapter 11 of the Kenya Constitution 2010, one of the objects of devolution is to promote social and economic development and provision of proximate and easily accessible services throughout the Country. Devolution of healthcare was perceived as a mechanism of delivering accessible and proximate healthcare throughout the country towards Universal Health Coverage (UHC) which is one of the “Big Four” development agenda in Kenya. This is because devolution is a political and constitutional undertaking attempted at challenging embedded centralized power imbalances that cause and sustain spatial inequity in service delivery within a nation [3, 4]. It bestows powers and decision making to elected leaders at semi-autonomous sub national levels to plan, prioritize and implement their local development agenda [5, 6]. With the reform devolving primary and secondary health service delivery to Counties, while National Government responsible for only three tertiary referral hospitals, are there prospects of patients obtaining health services “close by” or long walk for acceptable quality healthcare persist five years after? To begin with, prospects of devolved healthcare in healthcare access were marked with apprehension and uncertainty in Kenya [7]. Indeed a survey by Transparency International (TI) in 2013 painted a gloomy picture by their title ‘towards a hazy horizons’ on perception of devolution in delivering on its mandate [8]. Proponents, however, advocated that devolution was a tool for distributing power, addressing inequalities and inefficiencies in allocation and use of public resources as well as addressing local prioritized needs [6, 9]. Rationale for devolving health sector was to allow the county governments to design innovative models and interventions that suited the unique health needs in their contexts [10]. Right from inception in 2013, devolved healthcare implementation in Kenya was marked largely by increment, expansion and improvement in health infrastructure as well as human resources for health (HRH) across the counties. An assessment of health delivery under devolved system in Kenya found upsurge in number of health facilities, improvement in health service densities and sustained disparities in healthcare access [11]. The number of registered health facilities increased from 8,616 facilities before devolution in 2013 to 11,324 in 2017. The national average facility density increased from 19 to 24 health facilities per 100,000 populations [12]. The national average distance to nearest health facilities was found to be 3Km, but intra-Counties ranges between 1.4 Km to 52.6 Km. The number of staff also improved despite initial confusion on responsibilities, remunerations, resignations and strikes and political interferences [13]. Other jurisdictions too had diverse experiences on prospects of devolved healthcare. Philippines, due to its geography, embraced devolution in early 1990s, which devolved basic services including healthcare. However, it negatively affected quality and healthcare coverage in some regions, especially rural and remote areas [14]. The negative effects included low staff morale, declined utilization of health facilities, breakdown in management at two levels, maintenance and operational cost between 1992 and 1997. China, similarly, experienced a decline in spatial health equity following degradation of Corporative Medical System during Chinese economic revolution in 1980s’ [15]. In United Kingdom, scholars have been hesitant to devolved healthcare arguing it is threat to standardized public health delivery throughout the country [16]. Whereas in India, devolved healthcare was argued as a good strategy for spatially equitable access in all regions owing to entrenched centralized planning and strong caste system which impeded universal access to basic services [17]. Ideally, devolved healthcare ought to address regional and local spatial disparities in essential primary healthcare delivery in Kenya [18]. A paper by Society for International Development (SID) concluded that devolution in Kenya institutionalized or was about addressing underlying inequity including in healthcare delivery [9]. With no certainty on impact or prospect of devolution on health at inception, success in reducing spatial disparities or achieving spatial equity in primary healthcare may not be guaranteed. Note that spatial equity in devolved healthcare is perceived as reasonable level of spatial disparities in access and utilization within local decentralized units [18]. Spatial equity is a sub set of a wider concept of health equity, which is the study and causes of differences in the quality of health and healthcare amongst different population groups [19, 20]. Spatial equity from import of geographers David Harvey and Edward W. Soja, links together social justice and space [21, 22, 23]. A “just space” space, according to Rawls is one in which basic requirements of just distribution, equality of basic liberties and the distribution of all other social amenities that confers greatest benefit even to the least advantaged [24].If health delivery system is to succeed or become just spatially, it must start from what users need, such that appropriate policies should be redesigned to address patient needs [25]. Increasing health facilities alone, though addressing supply side of health access, may not necessarily address the demand side that concerns the users [26]. Patients may shun or bypass proximate health facilities, rendering them redundant or wasted investments if they don’t meet their needs or deficient in some way. A study in USA found that only 35% of women in the study population used their closest facility for mammography services, but nearly three-quarters of women not using their closest facility located within 5 minutes travel [27]. With patients freedom of choice of health provider, and not bound to use proximate services as first point of entry to health delivery, increasing health facilities may not necessarily address proximity to health services, as patients may persistently flock some service areas and facilities for services irrespective of distance. The paper sought to spatially explore the main cause of local spatial clustering for maternal health utilization within lowest decentralized units in Kenya. Key research questions: i) Is there spatial clustering of maternal local utilization before and after devolution; ii) What are the changes in clustering? And iii) what explains the clustering and changes after devolution.
2. Materials and Methods
2.1. Research Design
- The research applied explanatory sequential design within multiple-case. This is where spatial analysis findings are explained subsequently by qualitative results [28]. The multiple-case approach is more robust in comparison to single-case approach as it permits comparative performance analysis of different units or clusters [29, 30]. The design permitted in-depth investigation and inquiry through comparative quantification, description and explanation of health seeking and utilization patterns both spatially and qualitatively before and after devolution within a span of 5 years. The qualitative explanation was sought from selected spatial clusters, or hotspots, which were spatially auto-correlated. Local utilization (LU) and local utilization ratio (LUR) were innovative indicators applied to effectively and comparatively measure and geospatially analyse local maternal utilization by Ward [18]. LU is perceived as the total number of patients who received a given health service within a given decentralised unit or clusters. It potentially increases with population, which ought to be factored in by applying local utilization ratio (LUR) for rational comparability. LUR is a comparative performance indicator on health service utilization across all the units/clusters. It is a ratio derived by dividing local utilization over local demand. Nationally desirable level of LUR, as per universal health access standards is at least 90% [31]. However, best performing clusters may record more than 100%, owing to spill overs or cross border heath seeking necessitated by higher interactions amongst neighbouring decentralized units, freedom of provider choices in Kenya and potential benefits for such choices as adduced by rational choice theory [32].
2.2. Study Area and Clusters
- Siaya County representatively provided a multiple case for the study. The County is composed of 30 Wards, which are smaller decentralised units within the counties for county-based representation, legislation, planning, service delivery and resource allocations in Kenya [5]. The county is among 47 counties; under the devolved system of government in Kenya vide constitution of Kenya 2010.It is composed of a land surface area of 2,530km² and the water surface area of 1,005 km2, and lies between latitude 0° 26´ South to 0° 18´ North and longitude 33° 58´ and 34° 33´ East (Figure 1). By 2018, the number of health facilities registered in the county were 220, comprising 11 hospitals (level 4), 50 health centres (level 3) and 159 dispensaries (level 3). This was an increase of 47.6% from 149 health facilities (seven hospitals, 32 health centres and 110 dispensaries) in 2013. Whether or not the increasing number of health facilities affected the health seeking patterns after devolution of healthcare in Siaya County is of interest of this paper.
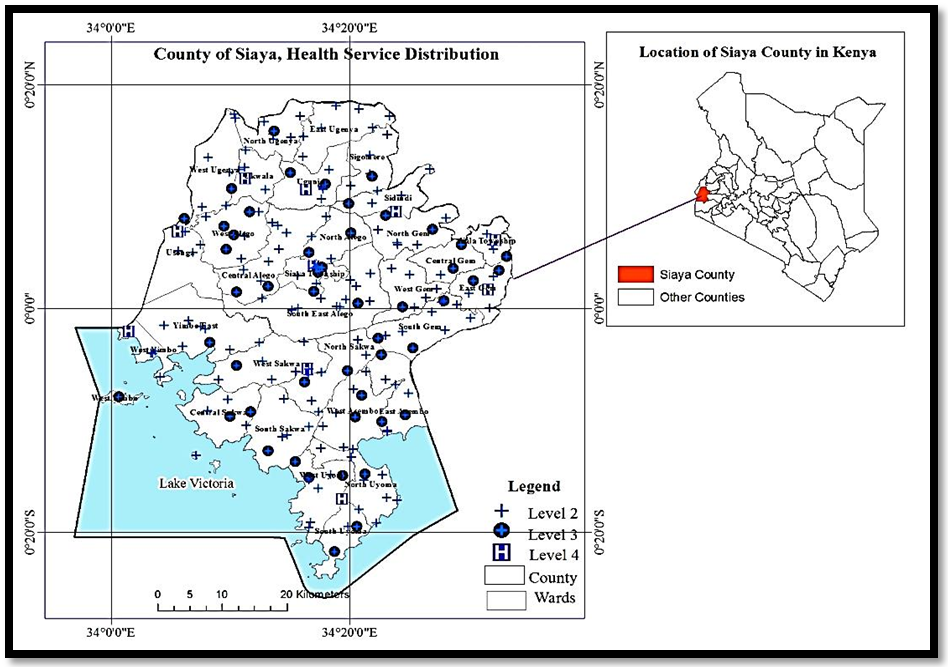 | Figure 1. Health Service Distribution in Siaya County by Wards, sourced from [18] |
2.3. Data, Data Sources and Spatial Database Creation
- Local utilization and local utilization ratio of the skilled delivery and antenatal care between 2013 and 2017 comprised key data requirement for the research. This was purely patient-based survey, extracted from electronic health records (EHR), making it more credible. It leveraged on District Health Information Systems (DHIS 2), a web-based patient health data repository in Kenya [36, 37]. Each of the registered health facilities file and upload patient data into the DHIS 2 in Kenya as a government policy [38]. Access to maternal health service annual statistics from DHIS 2 was by assistance from the county’s health resources information management officer, who had access permission. The statistics by each health facilities was aggregated by each of the 30 Wards to provide annual local utilization. Local demand of maternal services was provided by the County of Siaya as 0.04 of the total population. Local utilization Ratio (LUR) was determined by dividing local utilization (LU) over local demand (LD). The aggregated data by Wards resulted into Ward Based Maternal Health Service Utilization Database (WMHSUDB), a shapefile, for descriptive and geospatial analysis.The spatial data and attribute data for WMSUDB included: Spatial and attribute data relevant to the study. Ward boundary units sourced from Independent Electoral and Boundary Commission (IEBC), as the spatial area-based data. The boundary units were in shapefile format and in projected coordinate system, WGS84, UTM zone 36N. While attribute data included: population, expected local demand (births/pregnancies), local utilization (ANC1 and SBA) and Local utilization ratio (SBA and ANC1). Health facility database from which LU and LUR WMSUDB was derived included location of all 220 registered health facilities, as point—based data, with attributes including: name, code, level, ownership, beds, annual SBA/ANC1 data (2012-2017).
2.4. Statistical Analysis and Test
- A two pronged analysis comprising hot spot analysis and descriptive analysis to explain significant spatial clustering as per sequential explanatory design tenets [28]. Getis Ord-Gi* Hot Spot analysis was applied to identify and characterize spatial clusters in maternal service utilizations before and after devolution. Getis-Ord Gi* is a local patterns statistics which was preferred over Local Indicator for Spatial Autocorrelation (LISA) because besides unravelling presence or absence of spatial clusters it characterizes them more by showing confidence level, z score and p-value as well as being a simple approach to spatial autocorrelations [39, 40]. However, using both Getis-Ord Gi* and LISA’s Local Moran’s I was applied, as scholarly advised, to deepen understanding of spatial association of phenomenon under study [39]. The Getis-Ord local statistic is given as:
 | (1) |
 the attribute is value of feature j, and
  is the spatial weight between feature i and j, n equal to the total number of features.
 | (2) |
 | (3) |
2.5. Descriptive Analysis for Qualitative Explanations
- A descriptive analysis was downscaled to significantly clustering spots in attempt to determine changes in spatial clustering before and after devolution, as well as explain the existence and changes in spatial clusters. Once hot spots and cold spots had been unravelled from the two-timed epochs, the changing intensity of the spatial clustering was determined by variances of their z-score, confidence level and p-values. Reasons that propel users to prefer or flock in certain Wards for maternal health services over others or dislike certain Wards over other explained the patients’ health seeking habit and health service preferences.
3. Research Findings
- The paper sought to spatially explore main cause of local spatial clustering, with focus on quantity and quality of health services, in maternal service utilization under condition of freedom of choice and affordability. To answer the key research questions, results of Getis-Ord Gi* unravelling hot spots and cold spots has been explored, before delving into likely qualitative explanations.
3.1. Characterisation of Maternal Health Cases Enrolled in the Study
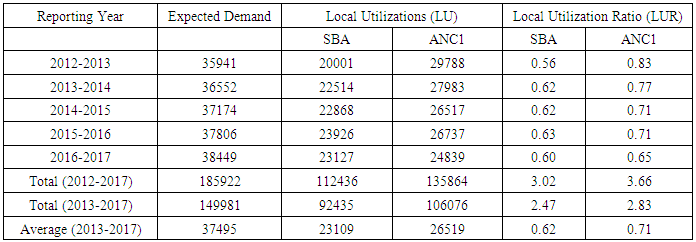
- All DHIS 2 registered maternal health cases and LUR in Siaya County between July 2012 and June 2017 were enrolled in this study. Total expected demand for the period was 185,922 pregnancies/births against local utilization (LU) of 112,436 SBA cases and 135,864 ANC1cases (Table 1). Trends in proportion of expected demand met locally shows generally increasing local utilization ratio (LUR) in SBA, exception being 2016-2017, and decreasing trends in ANC1. Taking 2012-2013 to be period “before devolution” and 2013-2017 to be period “after devolution”, then LUR in SBA increased from 0.56 (56%) before devolution to average of 0.62 (62%) after devolution. Similarly, LUR in ANC1 decreased from 0.83 (83%) before devolution to average of 0.71 (71%) after devolution.
|
3.2. Presence of Hot Spots and Cold Spots in SBA Utilizations
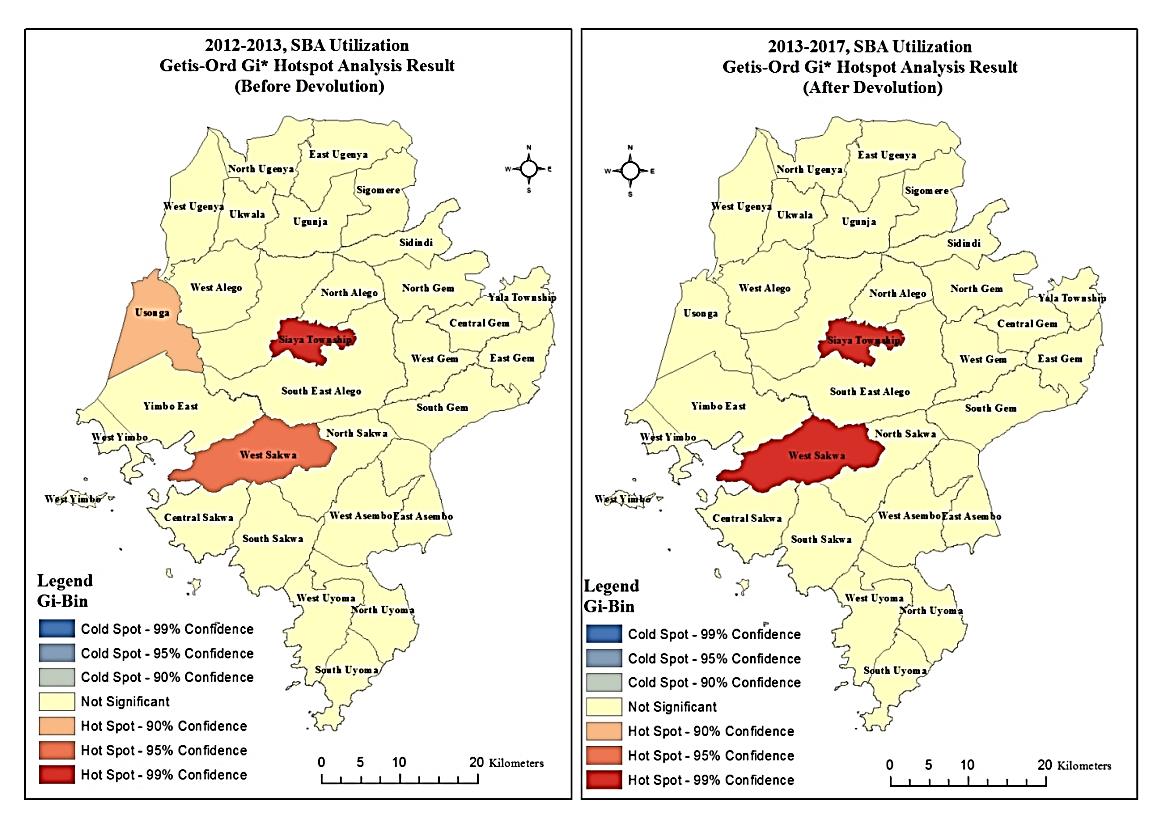
- Results from Getis-Ord Gi* hot spot analysis using ArcGIS 10.3, with LUR in SBA as input data, resulted into three and two hotspots in SBA local utilization before (2012/2013) and after devolution (2013-2017) respectively, out of 30 Wards (Figure 2). The hot spots comprised Siaya Township, West Sakwa and Usonga, with the last reverting to non-significant after devolution. None of the Wards recorded blue spots as all the rest had non-significant values. The three hotspot Wards clustered at 90%, 95% and 99% confidence level in 2012/2013 implying that the hots spot had varying intensity. The two hotspot Wards clustered all at 99% confidence level after devolution, implying same intensity. The nature of clustering was found to be “High Low” using LISA’s Local Moran’s I, implying that hot spots Wards are bordered by low valued neighbours. This likely indicates that hotspot Wards also serves their neighbours SBA needs.
 | Figure 2. SBA utilization hot spot maps before and after devolution |
3.3. Changes in Intensity of Spatial Clustering of SBA Utilizations
- P-values and z-scores for the hotspots changed after devolution (Table 2). West Sakwa p-value and z-score changed substantially to 0.003 from 0.037 and to 2.988 from 2.090 respectively. This changed spatial clustering confidence level from 95% to 99% after devolution. Usonga p-value and z-score reduced from 1.662 to 1.181, changing it from a hot spot at 90% confidence level to non-significant after devolution. Siaya Township realized marginal decrease in p-vale and z-score, but maintained its hot spot intensity at 99% confidence level after devolution. Reduction in number of hot spots, coupled by increasing intensity of one of the hot spots, indicate increasing intensity of spatial clustering after devolution with increasing affordability of maternal health services.
|
3.4. Presence of Hot Spots and Cold Spots in ANC Utilizations
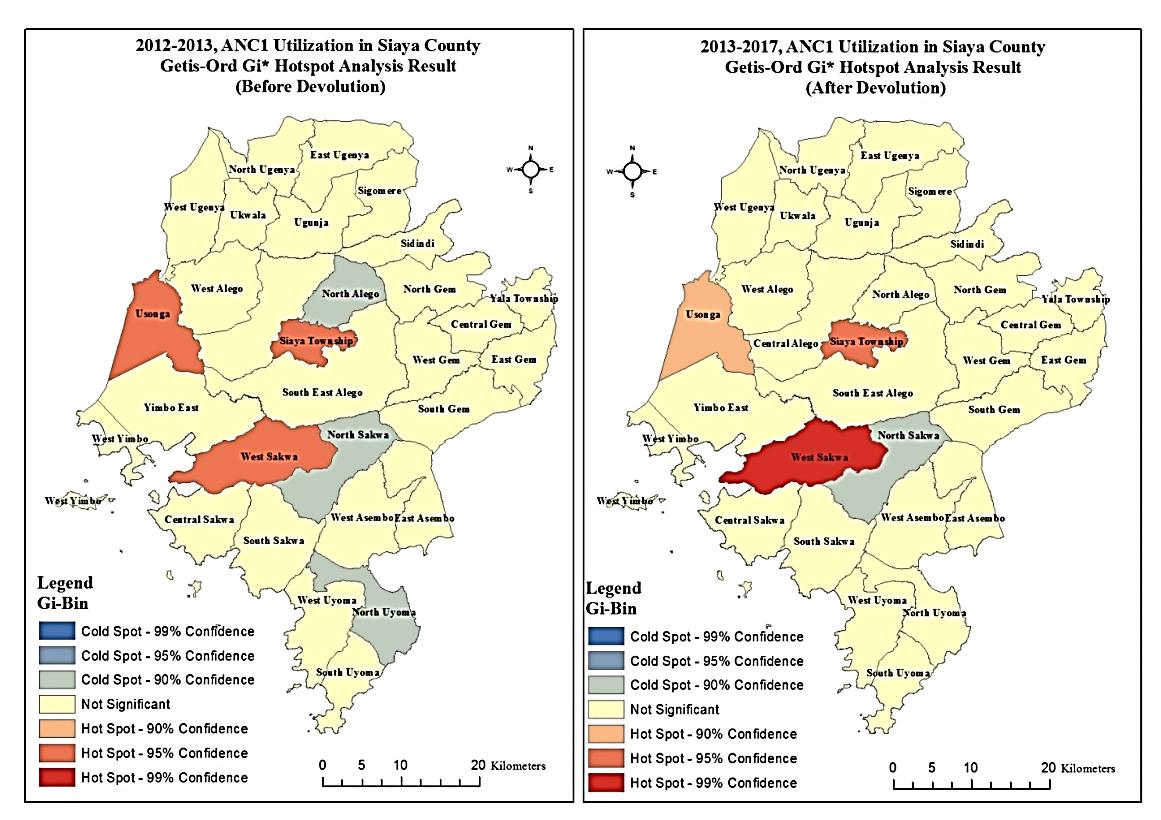
- Similarly, Getis Ord Gi* hot spot analysis using ArcGIS 10.3, with LUR in ANC1 as input data, resulted into three hotspots and three cold spots before devolution; but three hots pots and one cold spot after devolution (Figure 3). Hot spot Wards before and after devolution were Siaya Township, Usonga and West Sakwa. Cold spot Wards were North Sakwa, North Alego and North Uyoma in 2012/2013, but only North Sakwa remained after devolution. Hot spots before devolution were all clustered at 95% confidence levels, while all blue spots clustered at 90% confidence level. The three hotspot Wards clustered at 90%, 95% and 99% confidence after devolution implying that the hots spot locations had varying intensity. The nature of clustering was found to be “High Low” using LISA’s Local Moran’s I, implying that hot spots Wards were bordered by cold spot neighbours which they are likely serving.
 | Figure 3. ANC Utilization hot spot maps before and after devolution |
3.5. Changes in Intensity of Spatial Clustering of ANC Utilizations
- Whereas the number of hot spots remained three after devolution, the number of cold spots reduced from three to only one. P-values and z-scores for the hotspots in ANC1 LUR changed after devolution (Table 3). West Sakwa increased in intensity in ANC utilization with p-value and z-score increasing substantially from 0.032 to 0.002 and 2.142 to 3.173 thus changing confidence level from 95% to 99% after devolution. Usonga decreased in intensity in ANC utilization as p-value and z-score reduced from 0.032 to 0.060 and from 2.142 to 1.883 changing confidence levels from 95% t0 90% after devolution. Siaya Township didn’t change in intensity of ANC utilization as p-value and z-score only changed marginally, thus the hot spot remaining at 95% confidence level. North Uyoma and North Alego reduced in intensity of cold spot from 90% confidence level to non-significant clustering after devolution owing to reduction in z-score in increasing p-value. North Sakwa, however, persisted as a cold spot at 90% confidence level.
|
3.6. Explaining Hot Spots and Blue Spots in Maternal Healthcare
3.6.1. Availability and Numbers offering SBA after Devolution
- It was established that not all registered health facilities offered ANC1 services in 2017. Out of the 220 health facilities that has ever existed from 2013, only 145 (65.9%) offered skilled birth attendance (SBA) in 2017. Thus, explaining hotspots and blue spots excluded health facilities that did not offer the SBA. Siaya Township and South East Alego had highest number of registered health facilities at 14, but the latter isn’t a hotspot (Figure 2). Observably, only six (42.9%) of Siaya township facilities offered SBA compared to 12 (87.7%) in South East Alego. West Sakwa only had nine registered health facilities, and only 5 (55.5%) offered SBA in 2017, registered as hotspot after devolution but ranks number eight out of thirty in terms of number of registered health facilities. Applying health service density (HSD), a measure of availability in terms of number of health facilities per 10,000 populations, considering only health facilities that had evidence of offering SBA in 2017, West Sakwa and Siaya Township ranks number 10 and 12 respectively, yet they are SBA hotspots (Figure 4). Usonga, in spite of registering highest health service density (HSD), downgraded from a hot spot to “non-significant” after devolution. Thus number and availability of registered health facilities offering SBA doesn’t explain clustering or over concentration of utilizations of SBA within a given service area.
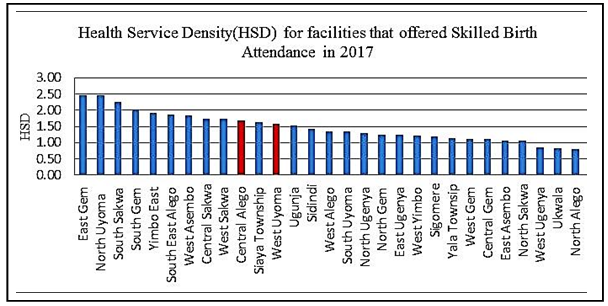 | Figure 4. Ranking availability of health services that offered Skilled Birth Attendance (SBA) in 2017 |
3.6.2. Availability and Numbers offering ANC after Devolution
- Out of the 220 health facilities that has ever existed from 2013, only 166 (75.5%) offered ANC1 in 2017. Thus, explaining ANC hotspots service areas excluded health facilities that did not offer it. West Sakwa had highest concentration of ANC1 utilization at 99% confidence level, but ranked number 11 in terms of health service densities (Figure 3). Usonga had highest HSD, registered as ANC1 hotspot, but at 90% confidence interval. Siaya Township, despite being second ranked hotspot at 95% confidence level, was number four in HSD considering only health facilities that offered ANC1 after devolution. Observably more health facilities offered ANC1 than SBA in the hotspots, nine (64.3%) in Siaya township, six (66.7%) in West Sakwa and five (100.0%) in Usonga. The fact that North Sakwa is the only cold spot after devolution but also having the lowest HSD may be a mere coincident. It has 11 health facilities but only three (27.3) offered ANC services.
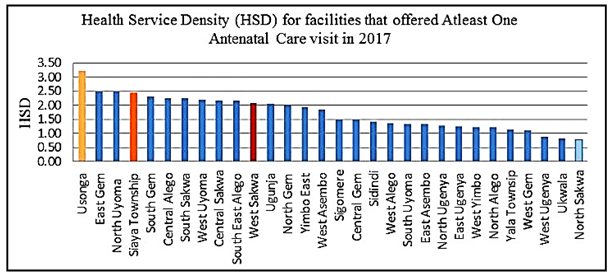 | Figure 5. Ranking availability of health Services that offered At least One Antenatal Care (ANC1) visit in 2017 |
3.6.3. Quality and Dominance of Health Facilities
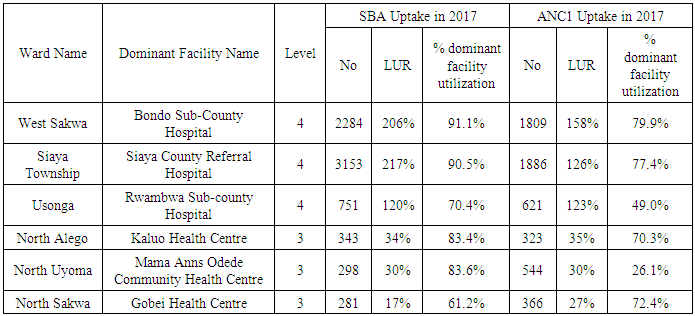
- Both hot spots and cold spot service areas (Wards) in maternal health utilizations have at least one dominant health facility that serves most of the maternal cases. The dominant facilities in the hot spots were all level 4 referral health facilities serving between 70% and 90% of SBA cases recorded and 49% and 80% of ANC1 cases. West Sakwa Ward hosts Bondo Sub-County Hospital, Level 4 facility, where 91.1% of 2284 SBA cases and 79.9% of 1809 ANC1 cases within the service area was served in 2016/2017. Siaya Township Ward host Siaya County Referral Hospital, a level 4 facility, where 90.5% of 3153 SBA cases and 77.4% of 1886 ANC1 cases within the service area were served in 2016/2017. Usonga had Rwambwa Sub-County hospital, recently upgraded, where 70.4% of 751 SBA cases and 49.0% of 621 ANC1 cases were served. The apparent lower value of ANC1 recorded by Rwambwa Sub-County Hospital is due to general decrease in recorded ANC cases from 671 in 2013 to 621 in 2017 amid growing demand and improved performance of Sumba Community Dispensary in ANC service. All cold spots did not have referral health facilities and recorded some of the lowest local uptake of maternal health services. They include North Alego, North Uyoma, and North Sakwa. Nonetheless, not all Wards hosting level 4 referral facilities were hot spots.
3.6.4. Magnitude of the Demand Met
- All the hotspot Wards served more than their local demand (LUR>100%) in maternal health services. West Sakwa met 206% and 158% of local SBA and ANC1 needs respectively; Siaya Township met 217% and 126% of local SBA and ANC1 needs respectively in 2017; and Usonga met 120% and 123% of local SBA and ANC1 needs. Yala Township and South Uyoma, despite also meeting more than their local demands, were not hot spots. Apparently, their local maternal utilizations were not exceptionally above their immediate neighbours. Conversely, all cold spots hardly met a third (33%) of the local SBA and ANC1 needs. North Sakwa, the only blue spots after devolution, met 17% and 27% of her SBA and ANC1 needs in 2016/2017.
4. Discussion of Results
- The hot spot analysis unraveled spatial clustering in maternal healthcare utilization within a few service areas, whose numbers decreased but intensity increased after operationalization of devolved healthcare. The most likely explanation for existence of hot spots Wards is presence of established referral facility therein that largely attract and also serve maternal needs from neighboring Wards that do not host any referral health facility. This has been buttressed by the fact that most cold spots in ANC utilizations were bordering hots spots.The result of free maternity, or improving affordability, is most likely responsible for increasing intensification of spatial clustering in maternal health utilization after devolution. Apparently when healthcare cost becomes affordable, patients seem to prioritize quality over proximity when choosing providers. Siaya Township, West Sakwa and Usonga all have level 4 hospitals, implying that quality of health services offered by at least one referral facility was caused the hot spots. This confirms the result of a perception surveys that one of the impact of devolved healthcare in Kenya was increased uptake of maternal services at referral facilities [43]. Increasing uptake of SBA, however, is associated with free maternity policy rather than devolution. This is due to its upsurge immediately after devolution, before substantial devolved government interventions in healthcare [44, 18, 45]. Quantity, in terms of numbers of health facilities and health service density, by each Ward neither causes nor explains spatial clustering within a given service area. Thus maternal patients yearn for quality health services within reasonable distance, to address remaining distance barrier once affordability has been addressed. Note that for quite some time, two most significant barriers to entry in the Kenyan health system have been the cost of care, and the availability of suitable care within a reasonable distance [46]. Prioritizing increasing numbers of health facilities without quality interventions, arguable largely serves political interest, not the patients’ who are the intended beneficiaries [47]. Need for critical considerations of patient perspective, through health seeking habits, in healthcare planning and interventions have been demonstrated. Avoidance, may lead to many redundant or underutilized health facilities which are not cost effective; and even fail devolved healthcare outcome of majority receiving healthcare within close proximity [1]. It may also fail to achieve key health policy objectives in Kenya “Equity in the distribution of health services and interventions… and People centered approach to health and health interventions" [2]. Shaikh and Hatcher (2005) reiterated that if health service system is to work, it must start from what users need, such that appropriate policies should be redesigned to address patient needs. Quality to patients, apparently, overrides distance and overrides availability or quantity of health services in provider choices in Siaya County. Increasing spatial clustering in health service utilizations owing to quality is, arguably, not good for spatial equity in devolved healthcare either. It overstretches the referral services and dilutes quality of services offered, as other decentralised health services are bypassed. It may also mean higher transport costs incurred by patients coming from far, in addition to risks of long travel for Medicare, especially for emergencies. Primacy of referral facilities ought to be tamed by improving quality and comprehensiveness of health services within cold spots and other Wards that met less than 50% of the local demand. As study on UHC and equity in healthcare in Kenya recommended, devolved healthcare ought to be matched by comprehensive and quality of primary essential health services [48]. This will potentially reduce travel costs, and reduce chances of biased healthcare interventions against the poor [49, 50].
|
5. Conclusions
- In overall, the result unravelled existence, persistence and intensifying spatial clustering of maternal healthcare utilization after devolution. It is the quality of healthcare, rather than quantity, and proximity, which is the main cause spatial clustering in maternal healthcare utilization in Kenya. The quality arise from at least one dominant public health referral facility hosted within the service area, that besides enabling meeting more than their local demands also attract substantial number of patients from neighboring service areas. Increasing intensity of the spatial clustering, as well as upsurge in health service utilization, resulted from increasing affordability of quality healthcare. This is when patients prioritized quality over availability and even distances in health provider choices. Increasing availability of low quality and non-comprehensive health facilities is not cost effective. They are likely to be bypassed and rendered redundant or grossly underutilized. Thus county governments ought to prioritize improving quality and expanding services within existing health facilities.Primacy or dominance of the few higher quality referral facilities is a challenge to devolved healthcare constitutional obligation. They are likely to hinder achievement of spatial equity and quality healthcare for all owing to travel costs and distances, as most spread out and proximate health facilities are deficient, underutilized and redundant. Flocking them for service reduces their quality and exposes patients to risks of long travel for healthcare, especially emergency cases.
ACKNOWLEDGEMENTS
- I wish to acknowledge County of Siaya for supporting the research with data and valuable information. I wish to also acknowledge National Commission of Science, Technology and Innovation (NACOSTI) for permitting my PhD research from which this article has been drawn. Lastly, I wish to acknowledge Jaramogi Oginga Odinga University of Science and Technology (JOOUST) for admitting me into their PhD in Planning programme and approving the research. And also salute my supervisors for guiding the research and co-producing this paper. My PhD thesis is entitled: Planning for Spatial Equity in Devolved Healthcare: A Geospatial Analysis of Land Use – Transport Linkage.