Mona S. El-Sayed
Surveying Engineering Department, Faculty of Engineering Shoubra, Benha University, Cairo, Egypt
Correspondence to: Mona S. El-Sayed, Surveying Engineering Department, Faculty of Engineering Shoubra, Benha University, Cairo, Egypt.
| Email: |  |
Copyright © 2018 The Author(s). Published by Scientific & Academic Publishing.
This work is licensed under the Creative Commons Attribution International License (CC BY).
http://creativecommons.org/licenses/by/4.0/

Abstract
Bathymetry is the science to define the topography of seabed. One of the leading researches in remote sensing of the marine environment is the determination of bathymetry from satellite images. This study provides a method for mapping a shallow lake bathymetry in Al Manzala Lake, Egypt using Sentinel-2A (10m resolution) and Landsat 8 imagery (30m resolution), which are free data sources. The most popular model is linear ratio model that was used to estimate water depth of shallow water bodies. This model was implemented using blue and green bands for Sentinel-2A and Landsat 8 satellites. The computed depths were validated against the in situ measurements. The root mean square errors (RMSE) were calculated for every satellite. We enumerate the error between in situ measured and satellite estimated lake depth value. Our results indicate the high correlation 0.92 between estimated (Sentinel-2A) and in situ depth measurement with RMSE = 0.29 m while low correlation 0.009 when using Landsat-8 with RMSE = 0.817 m. This case study suggests that the Sentinel-2A could retrieve accurate bathymetry information compared to Landsat 8.
Keywords:
Bathymetry, Depth Extraction, Landsat-8, Sentinel-2A, Stump-model
Cite this paper: Mona S. El-Sayed, Comparative Study of Satellite Images Performance in Mapping Lake Bathymetry: Case Study of Al-Manzala Lake, Egypt, American Journal of Geographic Information System, Vol. 7 No. 3, 2018, pp. 82-87. doi: 10.5923/j.ajgis.20180703.02.
1. Introduction
Bathymetry is the science of mapping the depth of the seabed. Bathymetry is considered a dominant factor in planning near shore activities such as: pipelining, fishing, port mapping, etc. as well as, making predictions for the sea-floor profile, sea level rise, and so on [1, 2].There are two main different techniques determining the bathymetry of a lake: The hydrographic surveyors, and remote sensing. The hydrographic surveyings’ technique uses ultra-sonic sonar to emit mechanical waves that bounce on the seabed, and a sensor equipment to collect the measured data. The seabed depth at each point can be measured through acquiring the time difference between the emission timestamp and the receiving timestamp [3, 4].The other method is remote sensing. This method depends on analyzing multiband high-resolution satellite images to estimate the water depth. The performance of this method heavily depends on the image quality, and used algorithm [5]. Lakes seabed have dynamic topology i.e. the seabed topology is changing rapidly over time. Thus it needs to be measured frequently [6]. While the hydrographic surveyors’ technique can give accurate measurements, it is not as cost effective as the remote sensing approach. Hydrographic surveyors approach is also can be a time consuming task compared with the remote sensing approach. In a response several satellite based imaging system have made available, including free of charge services. As well as several research articles have been oriented to develop such algorithms. A number of empirical algorithms are available in the literature such as [7, 8] and analytical algorithms such as [9-11]. In order to assess the performance of the mapping of the bathymetry, a number of input parameters such as properties of atmosphere, bottom material, water column and more parameters are needed. However, the empirical method (linear ratio algorithm) requires few parameters which are simple for mapping the bathymetry. These algorithms pointed out clearly that the most relevant bands are blue, and green.The main objective of this study is to evaluate the procedure based on ratio transform algorithm for estimating the bathymetry of Al- Manzala Lake using Sentinel-2A and Landsat 8 imagery that represent free data sources with reference to the results captured from echo sounder.
2. Methodology
In this research, the most popular algorithm for retrieval of bathymetry of shallow lake is applied. The band ratio model (Stumpf) was executed to extract the shallow water depth. Results were compared with the field data values. The statistical analysis R2 (the coefficient of determination) is adopted to give an estimation of the extinction of depth. The parameters such as m1 and m0 are obtained from the analysis of coefficient of determination. The R2 closest to 1 indicates that a linear relationship between the pixel value and reference hydrographic chart datum Fig (1).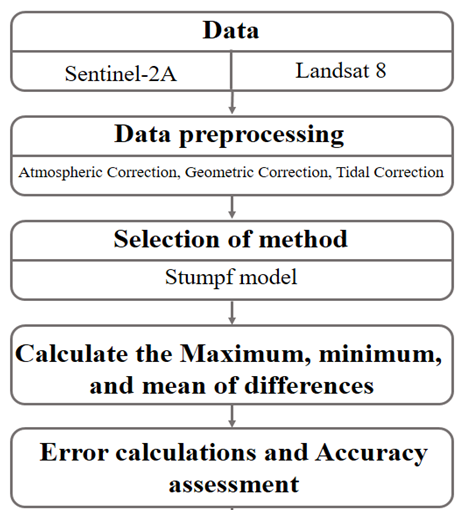 | Figure 1. Methodology for estimating the bathymetry of Al-Manzala Lake |
Finally, the calculated parameters such as observed radiance of band from the ratio of blue and green and the value of m1 and m0 are provided as an input to the ratio transform algorithm and identify the depth along the near shore of Manzala coast. The above procedures for estimating the bathymetry is processed using ArcGIS 10.3 environment with the support of 3D Analyst Tool. MATLAB is the other supporting software utilized for accuracy analysis and statistical exploration.
2.1. Data Source
The present study makes an attempt to determine the bathymetric mapping of the study area along the Coast of Al Manzala Lake beside Alexandria, Egypt, which acquired at March 2018. The geographical location extends the latitude 31° 16′ 30″ to 31° 18′ 0″ and longitude 32° 9′ 30″ to 32° 12′ 30″. For this study Blue and Green bands of Landsat 8 and Sentinel-2A satellite imagery are used as free data sources. The reason for applying blue and green bands in coastal environment is that radiance in blue band (450-515nm) decreases rapidly with depth more than radiance in the green band (525-600nm). A set of 45 well distributed points are carefully used to cover the area, See Fig. 2. These points are observed by Single Beam Echo-sounder System (SBES) since the nature of the study area are relatively shallow water depths. The hydrographic surveying works established at January 2018.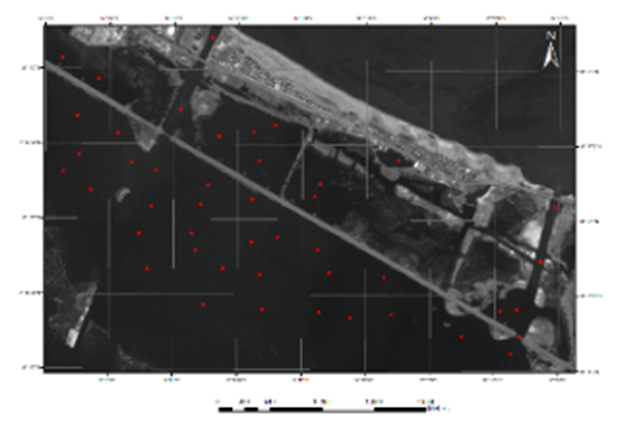 | Figure (2-a). The study area (Sentinel-2A) |
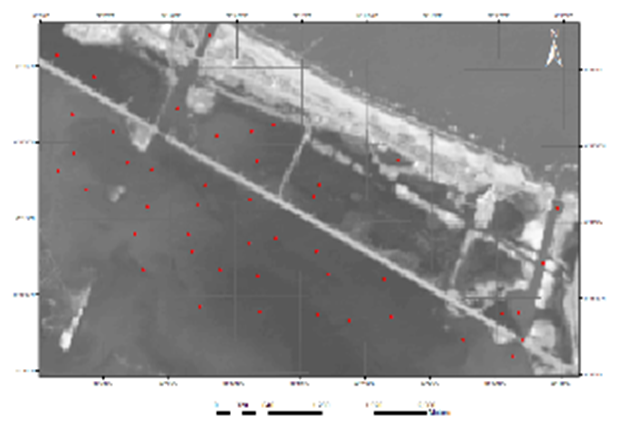 | Figure (2-b). The study area (Landsat8) |
Sentinel-2A satellite image was down loaded from the USGS (United States Geological Survey) Earth Explorer portal (https://earthexplorer.usgs.gov/). This portal has provided a wide range of global remotely sensed data, most of which (including Sentinel-2A imagery) are freely available for down loading [13].
2.2. Data Preparation
Several steps were applied in order to prepare the spectral data for water depth mapping. They included atmospheric correction, geometric corrections, tidal correction, and the extraction of bathymetric values from both images.
2.3. Atmospheric Correction
Large amount of remotely sensed imagery collected by satellites are largely contaminated by the atmospheric particles (Water vapor, dust, gases, etc.) during absorption and scattering radiation from the Earth surface reflectance. Visible wavelengths are used for the estimation of bathymetry. The lower portions of the atmosphere where larger particles like water vapor, dust, pollen, salt partials are more abundant that causes Mie Scattering and affects the actual earth surface reflectance. Therefore, the proper atmospheric correction is necessary at the pre-processing phase to reduce the effects of atmospheric components of the electromagnetic radiation emitted or reflected from the Earth's surface. So, the appropriate atmospheric correction is required to retrieve the surface reflectance by eliminating the atmospheric effects especially lower atmosphere effects. The atmospheric correction significantly improves the accuracy of image classification.Herein, the digital number of the multispectral image data were converted to (Top-of-Atmosphere (ToA) reflectance using the image metadata and the USGS equations. These TOA values adequately represent surface reflectance.
2.4. Geometric Correction
Images from both sources were first rectified to a set of ground control points derived from large scale topographic maps of the study area and then transformed to the Universal Transverse Mercator projection with the WGS84 datum. The ground control points were carefully selected and fine-tuned to manage the final error down to below half of the image pixel. The Landsat-8 was resampled using bilinear convention to (10 m) pixel size to match Sentinel-2A after geometric correction.
2.5. Tidal Correction
Both the Landsat-8 image and Sentinel-2A image recorded the water depth of the particular moments when the respective orbital sensors passed over the study area.
2.6. Water Depth Extraction Model
The model applied in this paper is Stumpf model (Log-Ratio Model). This model follow the fundamentals of water absorptivity varies spectrally from band to band. As the depth increases, the reflected irradiance decreases faster in the high absorptivity spectral band (green band) than in the low absorptivity band (blue band). Based on that, [14] developed a reflectance ratio model as follows: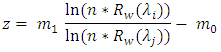 | (1) |
WhereRw(λi) and Rw(λj) is the atmospherically corrected pixel value for bands i and j , m1 is a tunable constant to scale the ratio to depth , n is a fixed constant, mainly for ensuring a positive value after the log transform and a linear response between the ratio and the depth (n = 100), and mo is an offset value when Z = 0.In the ratio model, only two parameters (mo and m1) need to be estimated. Procedurally, we first corrected the tidal effect on the remotely sensed data to the bathymetric datum, then extract corresponding pixel values of points from blue and green bands. Perform linear regression analysis between measured z and the ratio 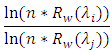 to get m0 and m1, to be as input values into the model equation. These parameters were further fine-tuned for producing better matches between the model output (Z) and the sampled in-situ data until the root mean squared error (RMSE) of the model was managed down to an acceptable level.
 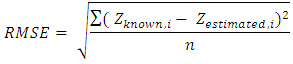 | (2) |
3. Results and Discussion
This section discusses the performance of two satellite systems (Sentinel-2A and Landsat-8) in terms of suitability and accuracy. The results of the implemented procedure are presented in Fig 3 to 6. The depth points in the hydrographic chart and the corresponding pixel values from the bathy image are obtained. The depth range considered in the present work up to (-7.5 m). From hydrographic chart the depth values are obtained from depth range (-1 to -7 m). For each depth value of hydrographic chart, corresponding pixel value from satellite derived bathymetry image is obtained for the two satellites. To validate the model, the statistical index (P-value) and (R2) are computed between the algorithm’ derived value and the hydrographic chart sounding. 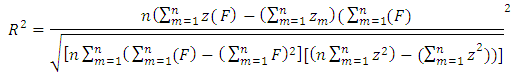 | (3) |
Where 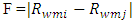 n is the number of points, z is the depth, Rwmi is the blue band value at point m, and Rwmj is the green band value at point m.
 | (4) |
Where t0 is the test statistic. | (5) |
Where m is the slope of the hypothesis, c is the null hypothesis constant, Se(m) is the standard error of the chosen fit parameters. | (6) |
Where e represents the error between the predicted and the measured depths.The following sections discussed the results for each satellite in details.
3.1. Sentinel-2A Results
The bathometry map derived from Sentinel-2A represented in figure 3.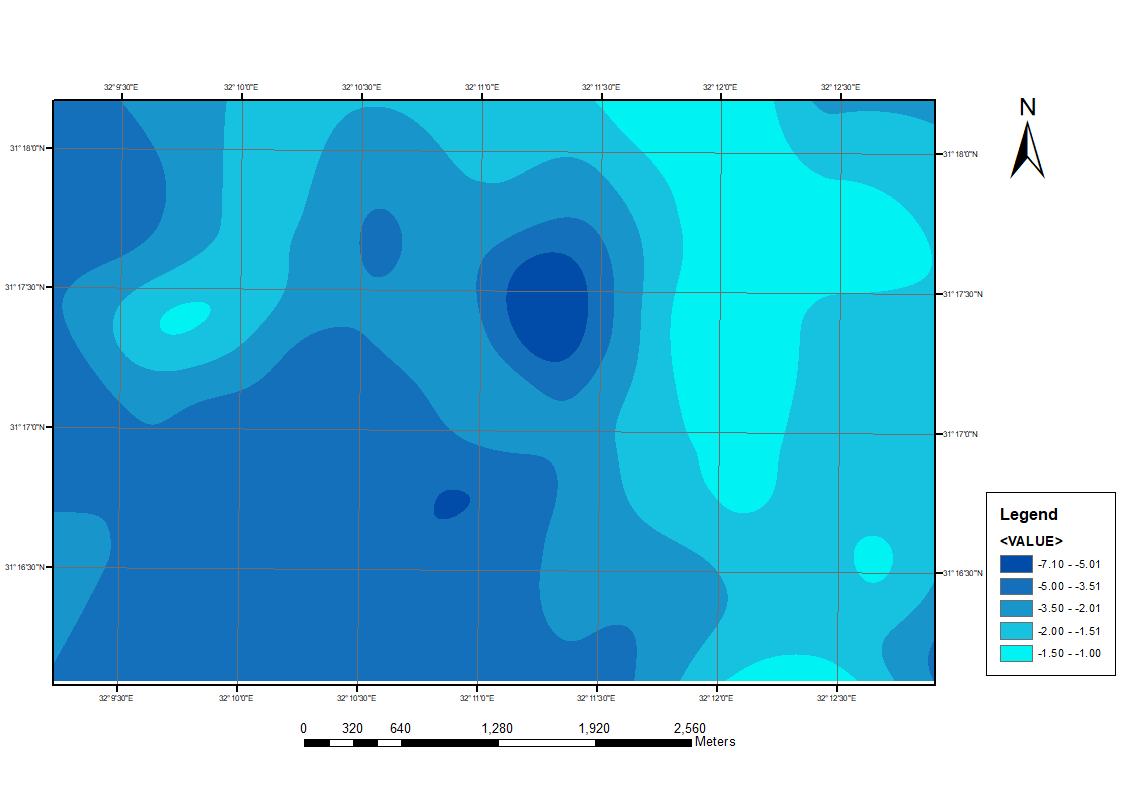 | Figure 3. Bathometry Map derived from Sentinel-2A |
Figure 4 shows the relationship between the computed and the observed depth. The correlation between them can be statistically represented by the P-value and the R2 value. While the P-value specifies the level of confidence, the R2 value indicates the type of correlation.The parameters such as m0 and m1 are obtained from the scatter plot Fig (4) where m1 is 443.15 and m0 is -452.67. Further, the value of m0 and m1 is adopted to plot the range of depth.In case of the satellite Sentinel-2A, a low P-value of 0.1 was obtained indicating high correlation and a R2 value of 0.918 indicating near linear relation between the calculated and the observed depth as shown in figure 4. Thus a linear relation can be obtained as shown in the figure below resulting in a RMSE of 0. 29m.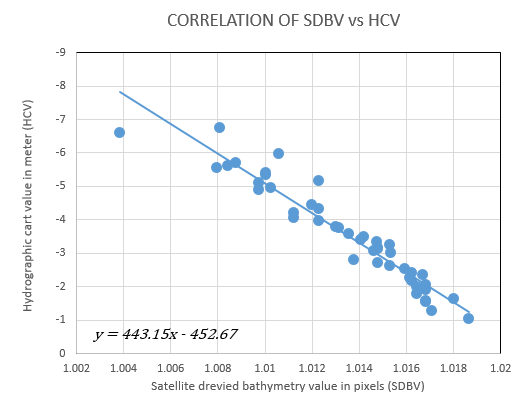 | Figure 4. Correlation of SBBV vs HCV (Sentinel – 2 A) |
The model prediction accuracy can be assessed by comparing the computed (estimated) depth with the actual depth (hydrographic field survey). The closest match indicates better model. The satellite Sentinel-2A accuracy was near optimum as shown in figure 5.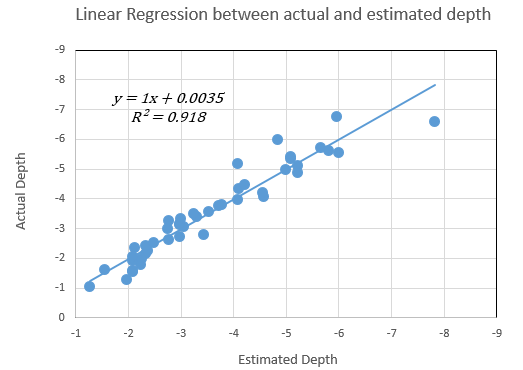 | Figure 5. Linear regression between actual and estimated depth (Sentinel-2A) |
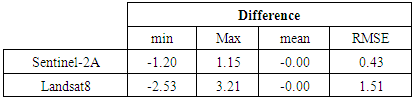
Fig (5) shows R2 of 0.92 between the Sentinel-2A satellites derived bathymetry value versus hydrographic chart value. The plotted data shows a root mean square error (RMSE) of the difference is o.43; while the RMSE of the absolute difference is 0.29 see Table (1,2) respectively.Table 1. Statistical values of the difference between computed and observed depths
 |
| |
|
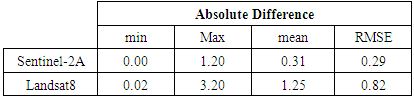
Table 2. Statistical values of the absolute difference between computed and observed depths
 |
| |
|
3.2. Landsat-8 Results
The bathometry map derived from Landsat-8 represented in figure 6.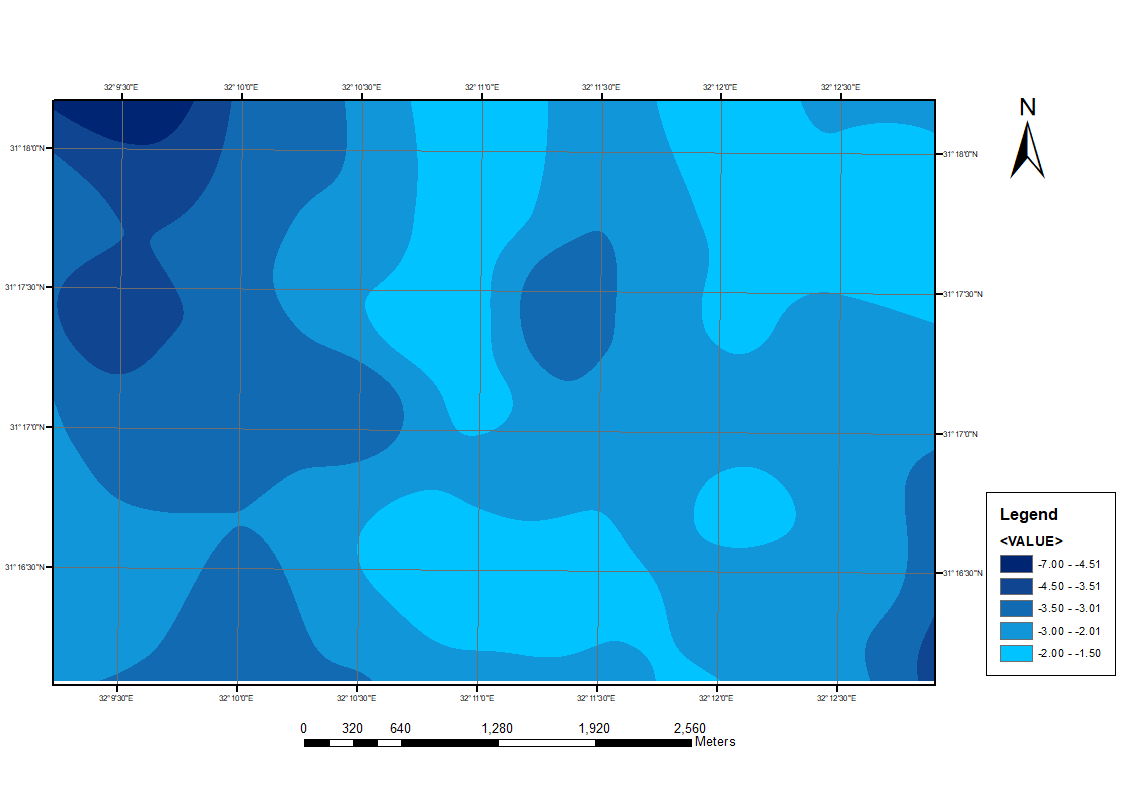 | Figure 6. Bathometry Map derived from Landsat-8 |
In case of the satellite Landsat-8, a high value of Chi square (x2) is out of range; this means that the obtained P-value was indicating low correlation. As well as, The R2 value of 0.009 indicates a nonlinear relation between the two depths as shown in figure 7. 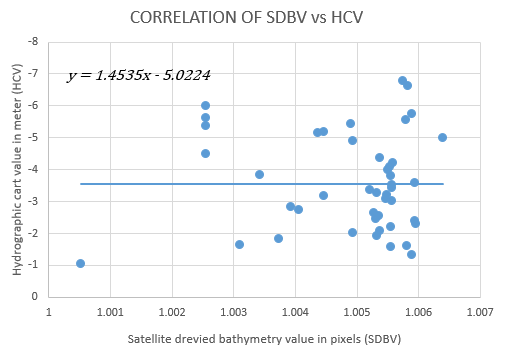 | Figure 7. Correlation of SBBV vs HCV (Landsat-8) |
The parameters such as m0 and m1is obtained from the scatter plot Fig. (7) where m1 is 1.45 and m0 is -5.02. Moreover, the value of m0 and m1 is adopted to plot the range of depth.Thus a linear regression can be a poor choice to fit the data as shown the figure below resulting in a RMSE of the difference is 1.51m and 0.82m RMSE of absolute difference see Table (1, 2).Fig (8) shows R2 of 0.009 between the Landsat-8 satellite derived bathymetry value versus hydrographic chart value. 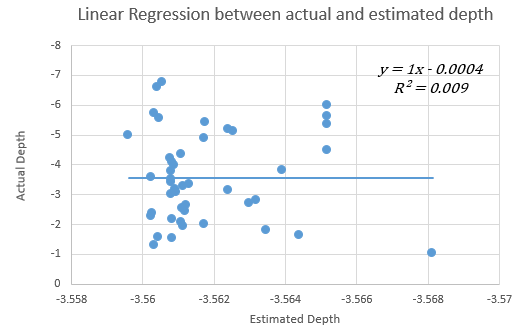 | Figure 8. Linear regression between actual and estimated depth (Landsat-8) |
4. Conclusions
This paper compared the performance of the two satellites (Landsat-8, and Sentinel-2A) for shallow water depth extraction using computational methods. The first objective of this research is to assess the estimated depth of the seabed of the Al Manzala Lake in Egypt by using the remote sensing of satellite imagery. The second objective is to study the effect of different satellites data as an input to the Stumpf model and give the best results. The accuracy of this assessment was done based on the precision and correlation coefficient (P-value and R2) between satellites. Derived bathymetry data and depth are extracted from referenced field survey data. Beside that root mean square error (RMSE) test was also being used to evaluate the estimated data. The results show that the compatible satellite that derived bathymetric mapping was able to offer a fast, flexible, efficient, and economically advantageous solution to map the seabed topography. It is also proven to be more cost effective, less labor intensive, and time saver method of acquiring bathymetry comparing to the conventional sonar sounding surveys not only this but also it allows significant repetitions of bathymetry mapping over broad area. Moreover, the results show that the Sentinel-2A is far superior to Landsat—8.It is recommended to use the Sentinel-2A for hydrographic surveying applications.
References
| [1] | Pushparaj, J. and Hegde, A. V., 2017. Estimation of Bathymetry along the coast of Mangaluru using Landsat-8 Imagery. The International Journal of Ocean and Climate Systems 2017. Vol. 8(2) 71-83. |
| [2] | Jawak, S. D., Raut, D. A. and Luis, A. J. 2015. Iterative Spectral Index Ratio Exploration for Object-Based Image Analysis of Antarctic Coastal Oasis Using High Resolution Satellite Remote Sensing Data. International Conference Water Resources, Coastal and Ocean Engineering (ICWRCOE 2015). |
| [3] | Winterbottom, S., J. and Gilvear, D. 1997. Quantification of Channel Bed Morphology in Gravel-Bed Rivers Using Airborne Multispectral Imagery and Aerial Photography. Regulated Rivers: Research & Management 13(6): 489-499. |
| [4] | Dang, Z., Ji, M. and Zhang, Z. 2008. Mapping Bathymetry from Multi-Source Remote Sensing Images: A Case Study in the Beilun Estuary, Guangxi, China. The International Archives of the Photogrammetry, Remote Sensing and Spatial Information Sciences 37(Part B8): 1321-1326. |
| [5] | M. Abd-Almajied, 2015, Predicting Water Depth of Lake Using Remote Sensing image, Iraqi Journal of Science, 2015, Vol 56, No.2A, pp:1208-1215. |
| [6] | Wee, K. K. Pradhan, B. 2015. Converting Digital Number into Bathymetric Depth: A Case Study over Coastal and Shallow Water of Langkawi Island, Malaysia. FIG working week 2015, 14. |
| [7] | Su, H., Liu, H. and WD, H. 2008. Automated Derivation of Bathymetric Information from Multi-Spectral Satellite Imagery Using a Non Linear Inversion Model. Marine Geodesy 31: 281-298. |
| [8] | Stumpf, RP. Holderied, K. Sinclair, M. 2003. Determination of Water Depth with High Resolution Satellite Imagery over Variable Bottom Types. Limnology and Oceanography 48: 547-556. |
| [9] | Lyzenga, D. R. 1978. Passive Remote Sensing Techniques for Mapping Water Depth and Bottom Features. Applied Optics 17: 379-383. |
| [10] | Lyzenga, D. R. 1981. Remote Sensing of Bottom reflectance and Water Attenuation Parameters in Shallow Water Using Aircraft and Landsat Data. International Journal of Remote Sensing 2: 71-82. |
| [11] | Lyzenga, D. R., Malinas, N. P., and Tanis, F. J., 2006. Multispectral Bathymetry Using a simple Physically Based Algorith m. IEEE Transactions on Geoscience and Remote Sensing 44(8), 2251-2259. |
| [12] | Taghreed, A. H., Naji 2014. Water Depth Classification from Remotely Sensed Imagery Using Experience Conditions Technique. Journal of Genetic and Environmental Resources Conservation, 2014, 2(2): 241-250. |
| [13] | Kabiri, K. 2017. Discovering Optimum Method to Extract Depth Information for Near Shore Coastal Waters from Sentinel-2A Imagery- Case Study: Nayband Bay, Iran. The International Archives of the Photogrammetry, Remote Sensing and Spatial Information Science, Volume XLII-4/W4, 2017. Tehran’s Joint ISPRS Conference of GI Research, SMPR and EOEC 2017. 7-10 October 2017, Tehran, Iran. |
| [14] | Jawak, S. D. and Luis, A. J. 2015. Spectral Information Analysis for the Semiautomatic Derivation of Shallow Lake Bathymetry Using High Resolution Multispectral Imagery: A Case Study of Antarctic Coastal Oasis. International Conference Water Resources, Coastal and Ocean Engineering (ICWRCOE 2015). |

 Abstract
 Reference
 Full-Text PDF
 Full-text HTML