Ayman El-Shehaby1, Lamyaa Gamal El-Deen Taha2
1Surveying Department, Shoubra Faculty of Engineering, Banha University, Cairo, Egypt
2Aviation and Aerial Photography Division, National Authority of Remote Sensing and Space Science (NARSS), Cairo, Egypt
Correspondence to: Lamyaa Gamal El-Deen Taha, Aviation and Aerial Photography Division, National Authority of Remote Sensing and Space Science (NARSS), Cairo, Egypt.
| Email: |  |
Copyright © 2018 The Author(s). Published by Scientific & Academic Publishing.
This work is licensed under the Creative Commons Attribution International License (CC BY).
http://creativecommons.org/licenses/by/4.0/

Abstract
Information extraction from LIDAR data is a hot research topic. Airborne LiDAR (Light Intensity Detection and Ranging) provides three different kinds of data: elevation, 3D point clouds, and intensity. This study evaluated the use of the LIDAR intensity data and LIDAR derived layers for land-cover classification. Two classification approaches were tested and their results were compared. The two approaches are pixel-based and object-based classification approaches. First, the pixel-based classification approach presented by the maximum likelihood classification (MLC) technique was used to classify the LiDAR intensity data. Then, more bands such as DSM, texture of the intensity data, and terrain slope were added, as different bands, to the intensity data to improve the classification accuracy resulted into six approaches. Secondly object-based classification (OBIA) was performed. An overall accuracy of 65.3% was achieved using the sixth approach of pixel-based classification technique. The overall accuracy of the results is improved to 69.5% using the object-based classification technique. Finally, classifier combination or classifier ensemble was developed for improving the classification results. The combined approach achieved the highest accuracy reaching 75.32% and kappa index of agreement of 0.79 and improving accuracy of individual classes.
Keywords:
LIDAR, Point clouds, Intensity image,Classifier ensemble, DSM, Multiresolution segmentation, Pixel based classification, Object Based classification
Cite this paper: Ayman El-Shehaby, Lamyaa Gamal El-Deen Taha, A Novel Classifier Ensample for Combining Pixel-Based and Object Based Classification Methods for Improving Feature Extraction from LIDAR Intensity Data and LIDAR Derived Layers, American Journal of Geographic Information System, Vol. 7 No. 3, 2018, pp. 75-81. doi: 10.5923/j.ajgis.20180703.01.
1. Introduction
LIDAR system consists of a laser range finder, differential GNSS, inertial navigation sensors, computer processing and data storage and optionally other auxiliary devices onboard the aircraft (Nobrega et al., 2007).LIDAR data are used for generating digital elevation and/or surface models (DTM/DSM). Intensity data is the strength of the backscatter energy reflected from the targets (El-Ashmawy et al., 2011).The capability of making effective use of both LiDAR elevation and intensity data simultaneously for object extraction is real, however improvements in terms of processing and best use of these data present challenges (Nobrega et al., 2007).LiDAR intensity images can be considered as high spatial resolution images. The intensity data were used primarily as complementary data instead of multispectral remote sensing images (such as aerial photos and satellite images) for interpretation. LiDAR intensity data are advantageous over the multi-spectral remote sensing data in avoiding the shadows appear in the multispectral data due to LiDAR sensor is an active sensor (El-Ashmawy et al., 2011); (El-Ashmawy, Shaker, 2014). The general aim of land classification is the associations of each pixel within the image with a specific land cover class to produce thematic map (Doma et al., 2015).From different kinds of pixel information used, they can be grouped as per-pixel, subpixel, object-oriented or per-field classifiers (Jia, 2015).Pixel by pixel methods are slower also leads to noise influence sensitivity, uncertainty of mixed pixels, low efficiency etc. (Yadav et al., 2015).Hard classification process may result in an erroneous classification of images crowded with mixed pixels. This may be because of the fact that the spectral signature of a mixed pixel may no longer match any of the component classes or may be similar to the spectral signature of a different class (Jawak et al., 2015).The failure of pixel based techniques is due to the fact that these are based on assumption that individual classes contain uniform visual properties. As the special resolution of data is increased the intra-class variation increases and the property of class uniformity is broken leading to very poor performance. For high resolution images pixel based classification approach results in less accuracy as well as it leads for salt and pepper effect. Hence a new paradigm called object based image analysis is introduced to process the high resolution images. Instead of single pixel it focuses on group of pixels that constitute an object. The object-based classification works in the same way as a pixel-based classification with the difference that we do not classify each pixel but combine all pixels of each object and classify them together (Walter, 2004). These objects give more information such as geometrical, textural, contextual, positional. There are three steps of OBIA technique: Multiresolution segmentation, Create general classes, and Classification rule (Parivallal et al., 2014).Nowadays, multiple classifier system is widely used for land cover classification. The goal is to effectively combine the results of the classifiers taking advantage of the benefits of each while reducing their weaknesses (Salah et al., 2010). The resulting classifier is generally more accurate than any of the individual classifiers that make up the ensemble (Bigdeli et al., 2013). MCS involves different classification strategies such as parallel or hierarchical computing, Bagging and Boosting, and different classifier combination rules, such as majority voting, statistical techniques, sum, max, min, Product, fuzzy integral or evidence reasoning based on Dempster-Shafer evidence theory, and other fusion schemes (Kavzoglu and Colkesen, 2009); (Giacinto, Roli, 2001).In this research intensity data classification was investigated using two image classification techniques pixel-based and object-based classification approaches as applied to intensity data and LIDAR derivatives. Finally, classifier combination or classifier ensemble was developed for improving the classification results by combining the pixel-based and object-based classification approaches. Our contribution is an innovative method for combining the pixel-based and object-based classification.
2. Study Area and Data Set
The developed method has been tested on free sample dataset over university of Huwaii at Mānoa known as (UH) in Honolulu CDP. It cover about 1.5 km2. The LiDAR data were captured with leica laser scanner. The LiDAR acquisition mission was on 2013. The flying height for this mission was around 900m. The LiDAR data are provided in Las point cloud format as x, y, z, and I values of the point clouds.
3. Methodology
In this section, the processing chain that has been carried out for improvement of classification accuracy of intensity data was discussed. The processing steps as follows:1- LIDAR derived layers from las point clouds were extracted (intensity, DSM).2- Multi cue extraction were performed (mean texture from intensity image and slope from DSM) 3- Multi cue combination were performed.4- Classification s of multicue combination using traditional pixel based classification (the maximum likelihood)(MLC) were performed.5- Multiresolution image segmentation was applied.6- Input features has been selected such as intensity, textural and geometry.7- Classification of the intensity image was performed using Object Based Image Analytical (OBIA).8- Assessment of classification accuracy.9- Comparison between pixel based classifications and object based classification was performed.10- Classifier ensample (classifier combination) was developed and tested.
3.1. LIDAR Derived Layers
3.1.1. Intensity Extraction
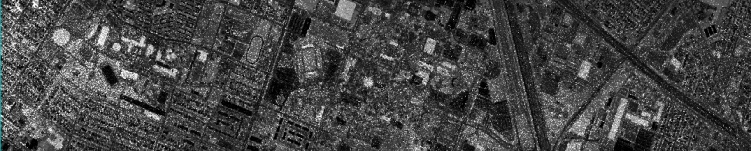
The first step is separating the intensity data into x, y, I point data files. Then each file is converted into raster format by using an interpolation technique producing an intensity image. Intensity image was extracted from the las file of las point cloud using lastool software.LiDAR point data were converted to grid to remove the noise with minimum influence on the original data. las2DEM module in Lastool software uses standard linear interpolation within each of the Delaunay TIN triangles that the corresponding sampled x and y raster position falls into.The following parameters were used in Lastool software for producing intensity image:Grid size 0.1Item intensityOutput. imgBy classification of return:First onlyFig 1.a. illustrates extraction using lastools. Fig 1.b. depicts produced Intensity image from Lastool.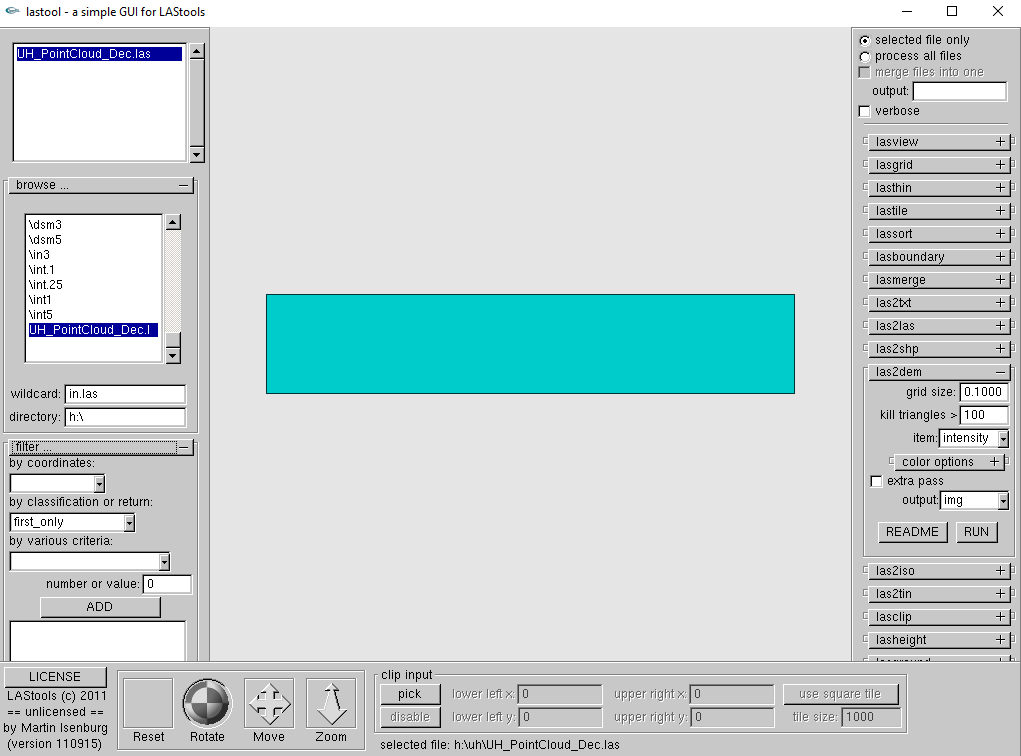 | Figure 1.a. Intensity extraction using lastools |
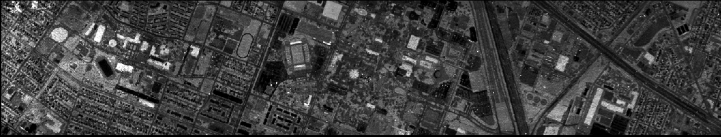 | Figure 1.b. Produced Intensity image from Lastool |
3.1.2. Digital Surface Model (DSM)
The second step is separating the elevation data into x, y, z point data files. Then each file is converted into raster format by using an interpolation technique producing a Digital Surface Model (DSM) image.Digital surface model (DSM) was produced from las point cloud using lastool software. This is reflected from the surface of objects such as the soil, buildings, cars, leaves, and so on. The process aims to create a high resolution DSM interpolated from LiDAR data into a regular grid of 0.1*0.1m cells. las2DEM module in Lastool software uses standard linear interpolation within each of the Delaunay TIN triangles that the corresponding sampled x and y raster position falls into.The following parameters were used in Lastool software for producing DSM:Grid size 0.1Item elevationOutput. imgBy classification of return: First onlyFigure 2.a. indicates the used parameters. Figure 2.b. depicts produced DSM from Lastool. | Figure 2.a. The used parameters |
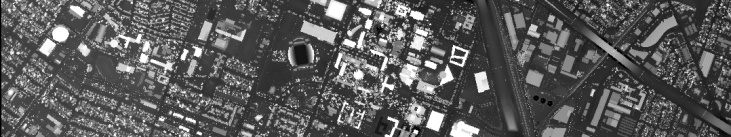 | Figure 2.b. Produced DSM from Lastool |
3.1.3. Generation of Texture
Different land use classes cannot be distinguished only by intensity image. The window size for texture analysis should be smaller than the smallest object to be mapped in the image. In our method, mean texture attribute was extracted based on GLCM with a kernal size 5 * 5 using ENVI 5.1.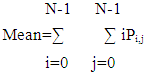 | (1) |
 | Figure 3. Mean texture |
3.1.4. Generation of Slope
Slope was calculated for LIDAR DSM image using Erdas 2014. Slope image of the DSM to represent the roof slopes.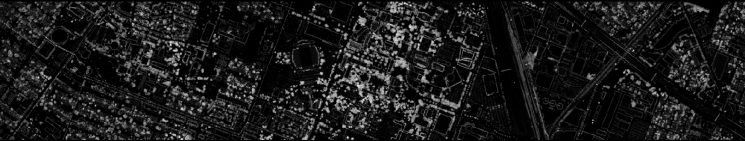 | Figure 4. Slope |
3.2. Classification Methods
3.2.1. Maximum Likelihood Classifier
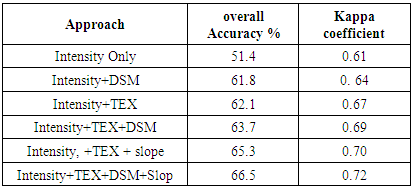
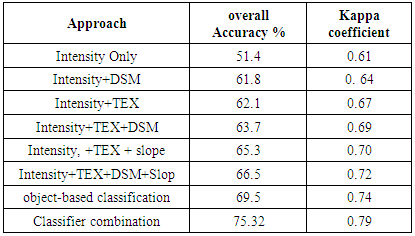
The maximum likelihood decision rule is still one of the most widely used supervised classification algorithms. It has proven to be the most robust classifier in the field of remote sensing, as long as spectral information in each class meets the normal distribution criteria (Chen et al., 2009).The LiDAR data provided were stored in las format. Firstly, lastool software was used for extraction of intensity image and digital surface model. Secondly land-cover classification was conducted using pixel based classification and object based classification. Maximum likelihood classification was implemented with different combinations of features. A total of six classification scenarios were implemented by using the traditional maximum likelihood classifier: 1) intensity image only, 2) intensity and digital surface model (DSM),3) intensity and texture (TEX) features generated from the intensity, and 4) intensity, TEX and DSM 5) intensity, TEX and slope, 6) Intensity+TEX+DSM+Slope. Training data were identified for the three different classes (buildings, roads, vegetation) by choosing thirty 30 ROI for each class. Statistical assessments of the training signatures were done. Assessment of the classification results was performed using ground truth data and by performing evaluation using error matrix. The classification process is evaluated using about 90 reference points. Ninety ground truth points were selected to cover all three classes and well distributed to cover the class all over the whole image and over different topography within the same class (30 points per class).Table 1. Overall Accuracy and Kappa coefficient of Maximum likelihood classification
 |
| |
|
3.2.2. Object-Based Classification
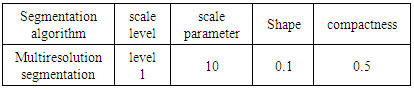
Object Based Image Analysis (OBIA) has been recently applied for processing land cover maps using automated methods for the analysis of very high resolution images (Hernando et al., 2012).Object-based classification not only use pixel but also spatial measurement such as their shape, orientation, texture, contextual relation feature and so on that characterized the shape and compactness of the region (Yadav et al., 2015); (Whiteside and Ahmad, 2005); (Juniati and Arrofiqoh, 2017).The initial step in the object-oriented approach was to segment the pixel-based images into objects as defined by the user (Makinde et al., 2016). Segmentation process creates new image objects or alters the morphology of existing image objects according to specific criteria (Yadav et al., 2015). It can be also defined as a method for achieving user-defined homogeneity within each image object. In each step of the process, a pair of adjacent objects are merged which allow for the smallest growth of the user-defined heterogeneity. If the smallest growth exceeds the user-defined scale parameter, the process stops (Brennan and Webster, 2006).The selection of proper segmentation algorithm with suitable scale helps in accurate classification process.In this research, multiresolution segmentation algorithm (MRS), which consecutively merges pixels or existing objects was used.The heterogeneity criterion is combination of compactness and shape properties of initial and resulting object of intended merging. Shape criterion determines the influence shape compare to color whereas compactness gives its relative weighting against smoothness (Yadav et al., 2015).There exist computer software packages such as eCognition and Feature Analyst that have been developed to utilize object-based classification procedures. These packages analyse both the spectral and spatial/contextual properties of pixels and use a segmentation process and iterative learning algorithms to achieve a semi-automatic classification procedure that promises to be more accurate than traditional pixel-based methods (Makinde et al., 2016). Literature review of the OOC approaches in RS has suggested that the rule-based classifier and the standard nearest neighbor (NN) classifier are among the most commonly employed object classifiers, popularized by the availability of commercial software such as eCognition and ENVI (Jawak et al., 2015).In object-based classification, it is possible to add further input channels, which describe directly spectral or textural characteristics. Table 2 shows Multiresolution segmentation parameters.Table 2. Multiresolution segmentation parameters
 |
| |
|
eCognition was used for object based classification. It was found that the overall accuracy of the object-based classification technique is improved to 69.5% and Kappa coefficient is improved to 0.74.
3.2.3. Classifier Combination (Classifier Ensemble)
Fuzzy membership functions, which are the knowledge-based part of the classification methodology in eCognition software, were used to apply fuzzy range to the selected features. The overall accuracy is 75.32% and kappa index of agreement is 0.79. Table 3. Shows comparison of overall accuracy and Kappa coefficient of pixel based, object based and combined approach. Figure 5 illustrates overall accuracy of pixel based, object based and combined approach. Figure 6 depicts Kappa coefficient of pixel based, object based and combined approach. Figure 7 illustrates the whole workflow.Table 3. Comparison of overall Accuracy and Kappa coefficient of pixel based, object based and combined approach
 |
| |
|
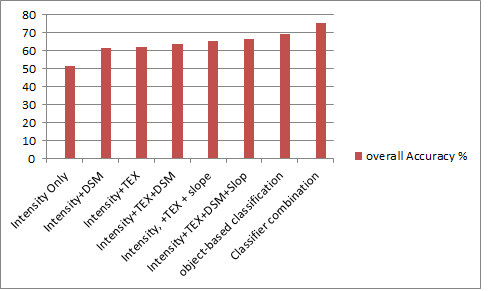 | Figure 5. Overall accuracy of pixel based, object based and combined approach |
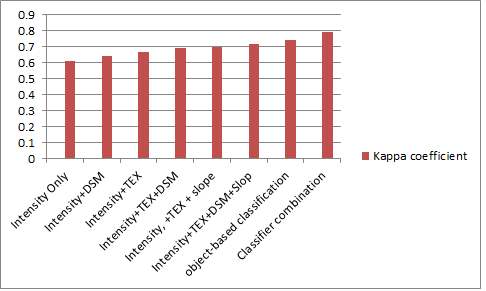 | Figure 6. Kappa coefficient of pixel based, object based and combined approach |
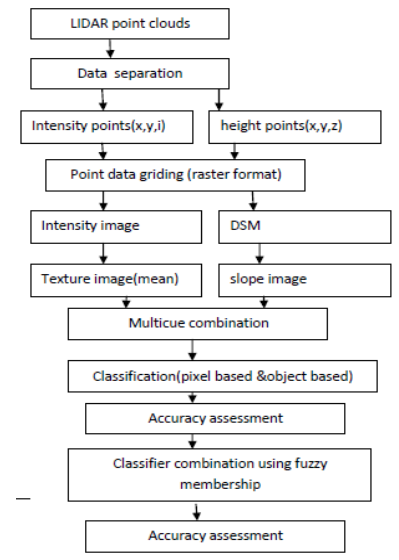 | Figure 7. The whole workflow |
4. Results and Discussion
This research investigates the use of the LIDAR intensity data and LIDAR derived layers for land-cover classification. Two classification approaches were tested and their results were compared. The two approaches are pixel-based and object-based classification approaches. Firstly, the pixel-based classification approach presented by the maximum likelihood classification technique was used to classify the LiDAR intensity data.Intensity image was extracted from the las file of las point cloud using lastool software. Then, digital surface model (DSM) was produced from las point cloud using lastool software. Then mean texture attribute was extracted from intensity image based on GLCM with a kernal size 5 * 5 using ENVI 5.1. After that Slope was calculated for LIDAR DSM image using Erdas 2014.Then, more bands such as DSM, texture of the intensity data, and terrain slope were added, as different bands, to the intensity data to improve the classification accuracy. In the first approach, intensity only was fed into the classifier. In the second approach, intensity image+DSM were fed into the classifier.In the third approach, combined intensity image and texture data (mean) were fed into the classifier.In the fourth approach, combined intensity image + texture data (mean) +DSM were fed into the classifier. In the fifth approach, intensity image + texture (mean) + slope were fed into the classifier.In the sixth approach, intensity image+ texture (mean) + DSM + slope were fed into the classifier.The best overall accuracy of 66.5% was achieved using the sixth approach of pixel-based classification technique intensity image+ texture (mean)+DSM+ slope.In the classification result with the intensity image (Approach 1), an overall accuracy of 51.4 percent was achieved. The following compares other approaches with approach 1, so as to determine whether insertion of other information's will improve the classification accuracy. The overall classification accuracy of approach 2, which used the Intensity +DSM image, is 61.8 percent. Approach 2 clearly outperforms Approach 1 as a result of adding height data. The overall accuracy of Approach 3 is 62.1 percent; a slight improvement was achieved compared to approach 2, an improvement of 10.7 percent than approach 1 was achieved. This could be attributed to texture measures as additional spatial information in the land cover classification process of intensity images to overcome the lack of spectral information Approach 4 has a good performance than approach 1, with an overall classification accuracy of 63.7 percent. Approach 5 produces an overall accuracy of 65.3 percent. The combination of Intensity, +TEX + slope improved the classification accuracies of most LULC classes. Approach 6 is similar to Approach 5, but added a DSM image for classification. A global classification accuracy of 66.5 percent was achieved. It is concluded that the combination of Intensity+TEX+DSM+Slop is an effective way to improve LULC classification accuracy. The texture image from the intensity image and heigh data and it’s derivative (slope) improved classification accuracy.Secondly object-based classification was performed. Segmentation was done as a prerequisite (multiresolution segmentation). The overall accuracy of the results is improved to 69.5% using the object-based classification technique. The results show that the ‘salt-and-pepper effect’ is more evident in the pixel-based classified map than in the object-based classified maps. The object-based method is better than the pixel-based method. Table 3 shows the comparison between the overall accuracy of the maps classified using pixel-based, object-based and combined methods.Finally, classifier combination or classifier ensemble was developed for improving the classification results. The combined approach achieved the highest accuracy reaching 75.32% and kappa index of agreement of 0.79 and improving accuracy of individual classes. Besides, combined-based approach (MLC/OBIA) performed better results at individual class level. It dealt satisfactory with the problems of classes confusion. Visual assessment of the produced land cover maps from the gives the same results.
5. Conclusions and Recommendations
The aim of this research is to investigate the use of two different image classification techniques applied on LIDAR intensity data and LIDAR derived layers for land cover classification. The two techniques proposed are pixel-based classification technique and object-based classification technique. For the pixel-based classification, the maximum likelihood supervised classification approach was employed. It was found that the best overall accuracy of the pixel-based classification technique was 66.5% and the overall accuracy of the results is improved to 69.5% using the object-based classification technique. For the pixel-based classification, the maximum likelihood supervised classification approach was employed.Finally, classifier combination or classifier ensemble was developed for improving the classification results. The proposed approach shows an improvement of the overall classification accuracy results as well as commission and omission errors have been improved compared to each of the individual classifiers. The overall accuracy is 75.32% and kappa index of agreement is 0.79. It is recommended to apply and test the proposed approach to other study areas and other applications to indicate it’s strength and limitation of the classifications.
ACKNOWLEDGEMENTS
The editing and comments of the reviewers is gratefully appreciated.
References
| [1] | Bigdeli B., Samadzadegan F. & Reinartz P.A (2013). Multiple SVM System for Classification of Hyperspectral. Remote Sensing Data J Indian Soc Remote Sens (December 2013) 41(4): 763–776. DOI 10.1007/s12524-013-0286-z. |
| [2] | Chen M., Su W., Li L., Zhang C., Yue A., Li H. (2009). Comparison of Pixel-based and Object-oriented Knowledge-based Classification Methods Using SPOT5 Imagery. WSEAS TRANSACTIONS on INFORMATION SCIENCE and APPLICATIONS Issue 3, Volume 6, March 2009 ISSN: 1790-0832. |
| [3] | Nobrega R.A.A., Quintanilha j. A. and Hara C.G.O. (2007). A Noise-Removal approach for lidar intensity images using anisotropic diffusion filtering to preserve object shape characteristics. ASPRS 2007 Annual Conference Tampa, Florida - May 7-11, 2007. |
| [4] | El-Ashmawy N., Shaker. A. and Yan W.Y. (2011). Pixel vs object-based image classification techniques for lidar intensity data. International Archives of the Photogrammetry, Remote Sensing and Spatial Information Sciences, Volume XXXVIII-5/W12, 2011 ISPRS Calgary 2011 Workshop, 29-31 August 2011, Calgary, Canada. |
| [5] | Salah M., Trinder J.C., Shaker A., Hamed M., Elsagheer A. (2010). Integrating Multiple Classifiers With Fuzzy Majority Voting for Improved Land Cover Classification In: Paparoditis. N., Pierrot- Deseilligny M., Mallet C., Tournaire O. (Eds), IAPRS, Vol. XXXVIII, Part 3A – Saint-Mandé, France, September 1-3, 2010. |
| [6] | Kavzoglu and Colkesen (2009). A kernel functions analysis for support vector machines for land cover classification. International Journal of Applied Earth Observation and Geoinformation 11 (2009) 352–359. |
| [7] | Giacinto G., Roli F. (2001). An approach to the Automatic Design of Mmultiple Classifier Systems. Pattern Recognition Letters 22 (2001) 25-33. |
| [8] | Doma M.L., Gomaa M.S. and Amer R.A. (2015). Sensitivity of pixel based classifiers to training sample size in case of high resolution satellite imagery. Journal of Geomatics Vol.9 No.1 April 2015. |
| [9] | Jia Y. (2015). Object-based Land Cover Classification with Orthophoto and LIDAR Data. Master of Science Thesis in Geoinformatics TRITA-GIT EX 15-001 School of Architecture and the Built Environment. |
| [10] | Yadav S., Rizvi I., Kadam S. (2015). Comparative Study of Object Based Image Analysis on High Resolution Satellite Images for Urban Development. International Journal of Technical Research and Applications e-ISSN: 2320-8163, www.ijtra.com Special Issue 31(September, 2015), PP. 105-110, Royal Institute of Technology (KTH Stockholm, Sweden. |
| [11] | Jawak S. D., Devliya P., Luis A. J. (2015). A Comprehensive Review on Pixel Oriented and Object Oriented Methods for Information Extraction from Remotely Sensed Satellite Images with a Special Emphasis on Cryospheric Applications. Advances in Remote Sensing 2015, 4, 177-195 Published Online September 2015 in SciRes. http://www.scirp.org/journal/ars http://dx.doi.org/10.4236/ars.2015.43015. |
| [12] | WalterV. (2004). Object-based evaluation of LIDAR and multispectral data for matic change detection in GIS 384 databases. www.isprs.org/proceedings/XXXV/congress/comm2/papers/222.pdf. |
| [13] | R. Parivallal, B. L. Dhivya, K. Elango, T. Karthik and B. Nagarajan (2014). An approach to classify the object from the satellite image using image analysis tool. International Journal for Innovative Research in Science & Technology, vol. 1, Issue 4, pp. 2349-6010, 2014. |
| [14] | Makinde E. O., Salami A. T., Olaleye J. B., Okewusi O. C. (2016). Object Based and Pixel Based Classification using Rapideye Satellite Imagery of Eti-Osa, Lagos, Nigeria. Geoinformatics FCE CTU 15(2), 2016, doi:10.14311/gi.15.2.5. |
| [15] | Brennan R. and Webster T.L. (2006). Object-oriented land cover classification of lidar-derived surfaces. Can. J. Remote Sensing, Vol. 32, No. 2, pp. 162–172, 2006. |
| [16] | Hernando A., Tiede D., Albrecht F., Lang S., García-Abril A. (2012). Novel parameters for evaluating the spatial and thematic accuracy of land cover maps. Proceedings of the 4th GEOBIA, May 7-9, 2012 - Rio de Janeiro - Brazil. p.613. |
| [17] | Whiteside T. and Ahmad W. (2005). A comparison of object-oriented and pixel-based classification methods for mapping land cover in northern Australia. Proceedings of SSC2005 Spatial intelligence, innovation and praxis: The national biennial Conference of the Spatial Sciences Institute September 2005. Melbourne: Spatial Sciences Institute. ISBN 0-9581366-2-9. |
| [18] | Juniati E. and Arrofiqoh E. N. (2017). Comparison of pixel-based and object-based classification using parameters and non-parameters approach for the pattern consistency of multi scale land cover. The International Archives of the Photogrammetry, Remote Sensing and Spatial Information Sciences, Volume XLII-2/W7, 2017 ISPRS Geospatial Week 2017, 18–22 September 2017, Wuhan, China. |
| [19] | Estoqueet R. C., Murayama Y., and Akiyama C. M. (2015). Pixel-based and object-based classifications using high and medium spatial resolution imageries in the urban and sub-urban landscapes. Journal: Geocarto International Date/Volume/Page: 2015/30/1113-1129. DOI: http://dx.doi.org/10.1080/10106049.2015.1027291. |
| [20] | El-Ashmawy N., 1 Shaker A. (2014). Raster VS. Point Cloud Lidar Data Classification. The International Archives of the Photogrammetry, Remote Sensing and Spatial Information Sciences, Volume XL-7, 2014 ISPRS Technical Commission VII Symposium, 29 September – 2 October 2014, Istanbul, Turkey. |
| [21] | Fernández-Manso Ó., Quintano C. and Fernández-Manso A. (2009). Combining spectral mixture analysis and object-based classification for fire severity mapping. Investigación Agraria: Sistemas y Recursos Forestales 2009 18(3), 296-313 ISSN: 1131-7965. |

 Abstract
 Reference
 Full-Text PDF
 Full-text HTML