-
Paper Information
- Paper Submission
-
Journal Information
- About This Journal
- Editorial Board
- Current Issue
- Archive
- Author Guidelines
- Contact Us
American Journal of Geographic Information System
p-ISSN: 2163-1131 e-ISSN: 2163-114X
2018; 7(2): 58-66
doi:10.5923/j.ajgis.20180702.02

Building Automated Navigation System for River Nile in Egypt Using Remote Sensing and GIS Techniques
 Abstract
 Reference
 Full-Text PDF
 Full-text HTML
Ali El Sagheer1, Maher Amin2, Mervat Refaat3, Omayma Obada4
1Professor of Surveying and Geodesy, Head of Surveying Engineering Department, Banha University, Egypt
2Assoc. Prof. of Surveying Engineering Department, Banha University, Egypt
3Lecturer. of Surveying Engineering Department, Banha University, Egypt
4PhD. Student, of Surveying Engineering Department, Banha University, Egypt
Correspondence to: Omayma Obada, PhD. Student, of Surveying Engineering Department, Banha University, Egypt.
| Email: |  |
Copyright © 2018 The Author(s). Published by Scientific & Academic Publishing.
This work is licensed under the Creative Commons Attribution International License (CC BY).
http://creativecommons.org/licenses/by/4.0/

In recent years the Government of Egypt initiated the efforts towards developing a navigation system in River Nile in Egypt. These efforts will increase the revenue from tourism; reduce the cost of shipping and the load on transportation network and overcome tourism ships which stuck near Luxor and Aswan city that happed every year during the peak of the tourism season between November-February due to decrease in water level that can affect 300 tourism boats with a capacity for accommodating over 60,000 tourists per week. Developing River Nile navigation system depends on the availability of updated data and information for River Nile depths all over the year in order to identify the best route that can be used for ships. River Nile water level always changes that effect changing of River Nile depths. This point is critical and has entertained thinking about using remote sensing technology that can derive bathymetric data from high-resolution multispectral satellite imagery. In this paper, Stumpf algorithm for estimating shallow water depth from multispectral data is applied in our study area near Esna district. This methodology is based on linear logarithm ratio model between image bands; the retrieved bathymetry is compared with echo sounder data. The validation results show that the applied method has acceptable performance, and the Root Mean Square Error (RMSEr) is 0.79 m. Then the second part in this paper building an automated navigation system for River Nile fleet in Egypt using Linear Reference and Dynamic Segmentation techniques based on the above retrieved bathymetry data and the other available collected data from different resources. The developed application is integration between Geomatics Engineering and Software Engineering on how maps, data, functions and information were used in a useful way using programming language to allow operation of all inertial navigation.
Keywords: Bathymetric Mapping, Multispectral Remote Sensing, Linear Logarithm Ratio Model, Linear Reference System, Dynamic Segmentation and Automated Navigation System
Cite this paper: Ali El Sagheer, Maher Amin, Mervat Refaat, Omayma Obada, Building Automated Navigation System for River Nile in Egypt Using Remote Sensing and GIS Techniques, American Journal of Geographic Information System, Vol. 7 No. 2, 2018, pp. 58-66. doi: 10.5923/j.ajgis.20180702.02.
Article Outline
1. Introduction
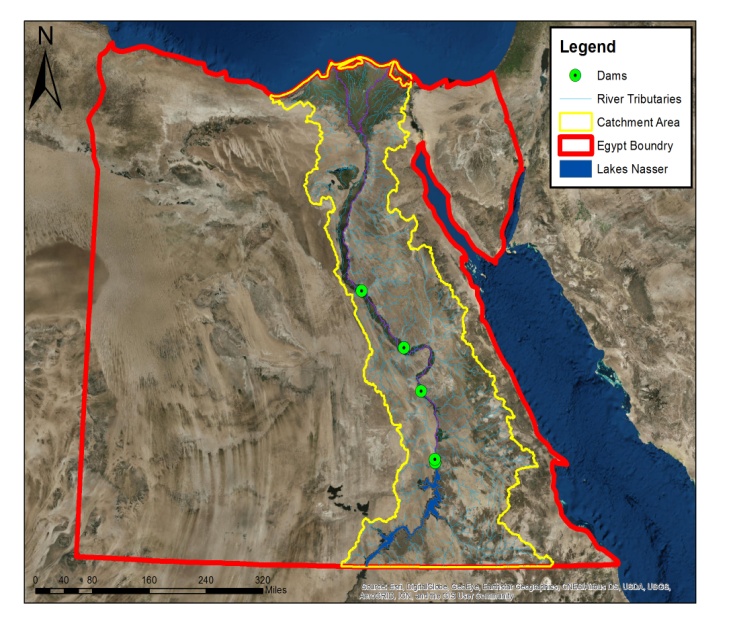
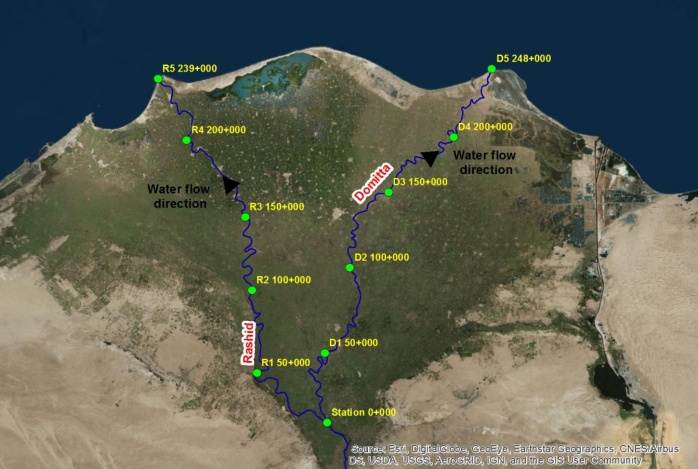
- The Rive Nile has been recognized as a navigable channel throughout the history of Egypt. It extends for about 950 km from Aswan High Dam to Cairo, divided into two branches, Rosetta and Damietta branch, each branch is about 200 km in length and finally reaches the Mediterranean Sea [22], as shown in Figure (1).
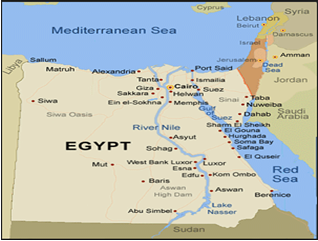 | Figure 1. The River Nile in Egypt [25] |
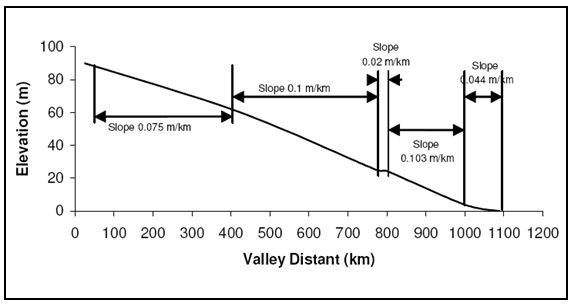 | Figure 2. The River Nile Elevations in Egypt |
2. Available Data Used
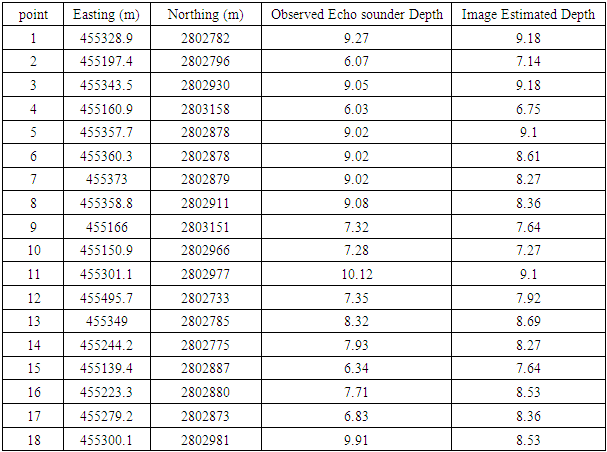
2.1. Available Traditional Data from Echo Sounder
- Traditional depths were measured by echo sounders with singlebeam and GPS receivers were applied in the area of Esna Bridge. It was essential to carry out fieldwork, using the most modern and accurate equipment in order to obtain useful information about the water depths and river bottom type. The fieldwork was under taken at (22-6-2009) with the acquisition of the GeoEye satellite imagery date. The reason for conducting this survey at the same time as image acquisition was to obtain more accuracy in the study methodology. A differential GPS positioning system was used for this work was an accuracy of ±20cm, to obtain accurate horizontal coordinates. [1, 2]
2.2. Available Satellite Image Data
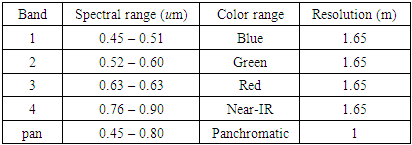
- GeoEye satellite image with 1.65 m spatial resolution over chosen study area, collected in 2009-07-10 08:40 GMT by spacing imaging’s GeoEye-1 satellite. This image has been obtained and rectified. GeoEye-1, launched in September 2008, is an imaging satellite of DigitalGlobe. The spacecraft is in a sun-synchronous orbit with an operating altitude of 681km.GeoEye-1 collects images at 0.41m panchromatic and 1.65m 4-bands multi-spectral data. The sensor is optimized for large projects, as it can collect over 350,000 square kilometers of VHR satellite imagery every day. GeoEye-1 can revisit any point on Earth once every three days, or even sooner depending on latitude and elevation angle. [1, 2]
|
2.3. Available Vector Data
2.3.1. NRI Data
- The collected data form Nile Research Institute (NRI) of the Ministry of Water Resources and Irrigation for River Nile Basin, these data are 1:2,000,000 vector data for Egypt administration boundary and sample data in scattered areas as an example for attributes data like River Nile depths which are sections in excel sheets using singlebeam acoustic depth sounding from 2003 to 2009 in Nasser Lake and around this area also general information about River Nile width, nearest ports, barrages, dams, allowable speed carry, as shown in Figure (3).
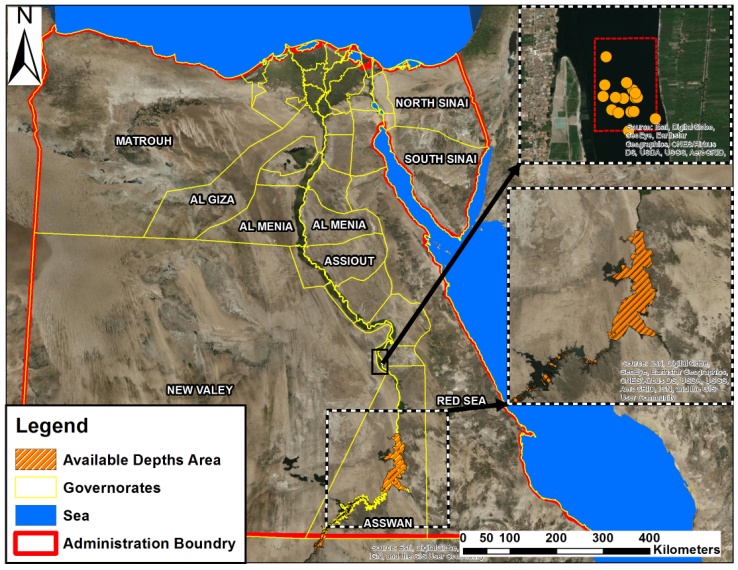 | Figure 3. Egypt Administration Boundary and Available Data |
2.3.2. Basemap for the River Nile in Egypt
- Basemap produced from the author in a previous paper, titled Developing Updated Basemap for River Nile in Egypt Using Free Sources Satellite Images, Omayma Obada [16], this basemap created using on screen digitizing in registered free sources satellite images to digitize main streams and sub-streams within the River Nile catchment area.
2.3.3. FAO Data
- FAO (Food and Agriculture Organization) provides free data for rivers and water bodies around the world obtained from Hydro SHEDS (Hydrological Data and Maps Based on Shuttle Elevation Derivatives at Multiple Scales). It is a mapping product that provides hydrographic information for regional and global-scale applications in a consistent format. [27]. It offers a suite of geo-referenced data sets, including river networks, watershed boundaries, drainage directions, and flow accumulations. Hydro SHEDS is based on high-resolution elevation data obtained during a Space Shuttle flight for NASA's Shuttle Radar Topography Mission (SRTM). [28] SRTM elevation data were obtained by a specially modified radar system that flew on board the Space Shuttle Endeavor during an 11-day mission in February of 2000. SRTM Water Body Data files are a by-product of the data editing performed by NGA to produce the finished SRTM data. Ocean, lake and river shorelines were identified and delineated from the 1 arc-second data (pixel resolution 30m) and were saved as vectors in ESRI 3-D Shapefile format. [29] Streams Names, Paths, Directions, main and sub catchment area and Dams information were extracted from FAO data to complete River Nile Basin Geodatabase, as shown in Figure(4).
 | Figure 4. River Nile in Egypt FAO Data |
3. Study Areas under Investigation
- The first part, the bathymetric derivations from GeoEye-1 satellite imagery will be in Esna located on the west bank of the River Nile, 55 km south of Luxor, as shown in Figure (5).
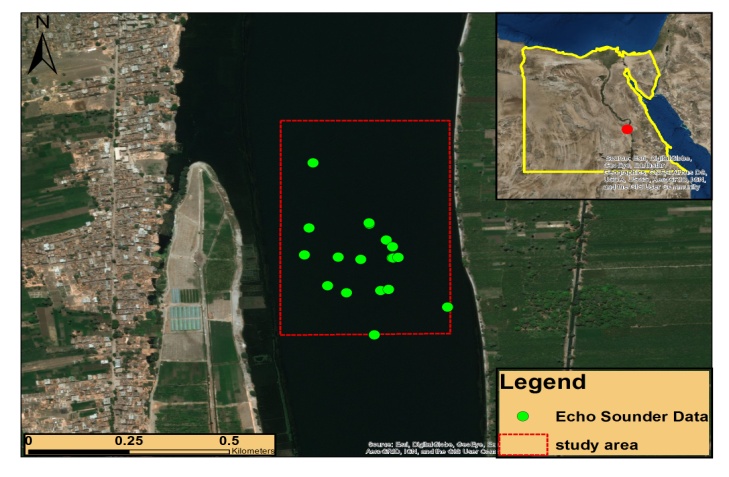 | Figure 5. GeoEye-1 Satellite Imagery for Esna |
4. Methodology
4.1. Bathymetric Derivations from GeoEye-1 Satellite Imagery
- Several steps were involved in the preparation of the spectral and bathymetric data for water depth mapping. They included atmospheric correction, geometric correction, and the extraction of bathymetric values from the nautical chart and the corresponding pixel values from both images. [11] A detailed discussion is provided below.
4.1.1. Atmospheric Correction
- The atmospheric correction is based on the algorithm developed by Gordon [9] and by Stumpf [19] and Pennock [17] for several remote sensors, including Coastal Zone Color Scanner, Advanced Very High Resolution Radiometer, and Landsat Thematic Mapper. In this model, the reflectance of water, Rw, of a particular spectral band is defined as:
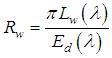 Where (LW) the water-leaving radiance, (Ed) the down-welling irradiance entering the water, (Λ) The wavelength of the spectral band, (Rw) found by correcting the total reflectance (Rt) for the aerosol and surface reflectance, as estimated by the near-IR band, and for the Rayleigh reflectance (Rr). This can be expressed as:
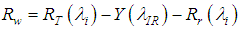 Where (i) denote visible bands, (IR) near-infrared band, (Y) the constant to correct for spectral variation and depends on aerosol type. In this study, the correction presumes a maritime atmosphere with a spectral variation similar to that of the water surface specular reflectance. This assumption is reasonable for GeoEye-1 data with no cloud cover. Water vapours with large diameters might require a separate aerosol correction.
4.1.2. Geometric Correction
- Image was geometry rectified and transformed to the Universal Transverse Mercator projection (UTM) with the WGS-84 datum.
4.1.3. Water Depth Extraction Model
- Water absorptivity varies spectrally from band to band. As the depth increases, the reflected irradiance decreases faster in the high absorptivity spectral band (e.g. green band) than in the low absorptivity band (e.g. blue band). Based on that, Stumpf et al. (2003) developed a reflectance ratio model as follows.
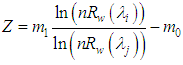 Where: Rw (λi) and Rw (λj) the atmospherically corrected pixel value for bands i and j, (m1) a tunable constant to scale the ratio to depth and (n) a fixed constant mainly for ensuring a positive value after the log transform and a linear response between the ratio and the depth and (m0) an offset value when Z = 0. In the ratio model, only two parameters (i.e. m0 and m1) need to be estimated. Procedurally, we first corrected the tidal effect on the remotely sensed data to the bathymetric datum, then computed for blue and green bands the averages of the pixel values of along the 0m and 5m bathymetric lines using Relative Water Depth tool enabled in ENVI, which were input into the model to estimate equation coefficient m1 and constant m0. These parameters were further fine-tuned for producing better matches between the model output (Z) and the sampled in-situ data until the Root Mean Squared Error (RMSEr) of the model was managed down to an acceptable level, as shown in the Table (2).
|
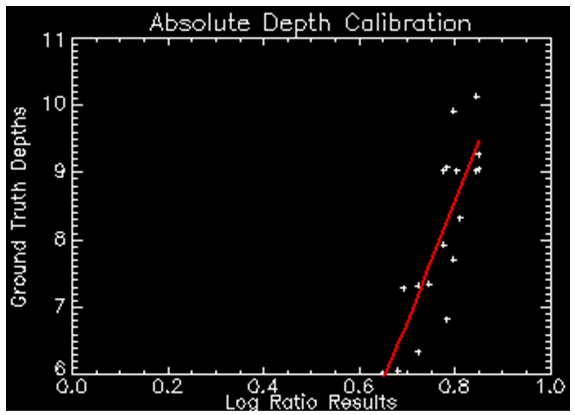 | Figure 6. Imagery Absolute Depth Calibration Using Linear Method |
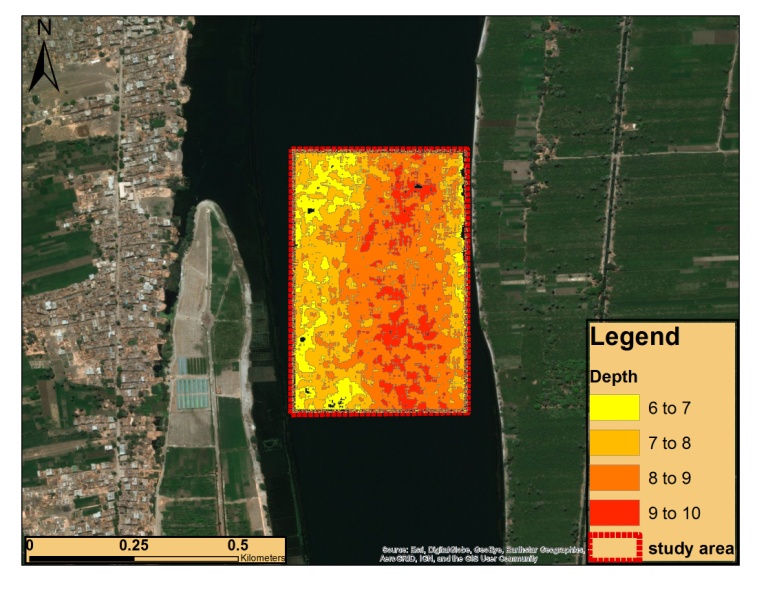 | Figure 7. Esna Study Area with Estimated Depths |
4.2. Developing an Automated Navigation System for River Nile in Egypt
- The work flow for different phases to build an automated navigation system for River Nile in Egypt is illustrated here, as shown in Figure (8).
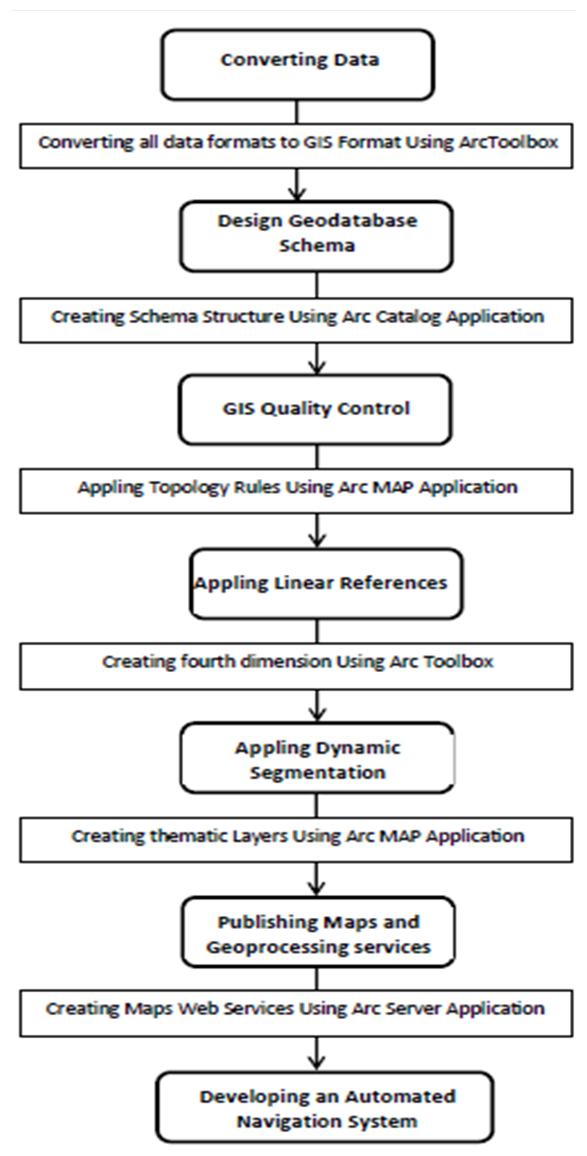 | Figure 8. Workflow Phases |
4.2.1. Converting Data Phase
- Converting data or standardizing data phase is the process by which data collected from different sources in various formats (KMZ, DWG, Shapefile, text...) is transformed to a common format (Geodatabase). [30]. Geodatabase have a comprehensive information model for representing and managing geographic information. This model is implemented as a series of tables holding feature classes, raster datasets, and attributes. In addition, advanced GIS data objects add GIS rules for managing spatial integrity and tools for working with numerous spatial relationships of the core features, raster and attributes. It supports storing information about collected data as metadata. [31]
4.2.2. Design Geodatabase Schema Phase
- Design Geodatabase schema phase involves organizing geographic information into a series of data themes layers that can be integrated using geographic location. Geodatabase design begins by identifying the data themes to be used, then specifying the contents and representations of each thematic layer, as shown in Figure (9) [32]. Geographic features are represented for each theme as points, lines, polygons, or raster along with their tabular attributes and data are organized into datasets, as feature classes, attributes, raster datasets, and additional spatial and database elements will be needed for integrity rules, for implementing rich GIS behaviour as topologies, networks, and finally defining spatial and attribute relationships between datasets.
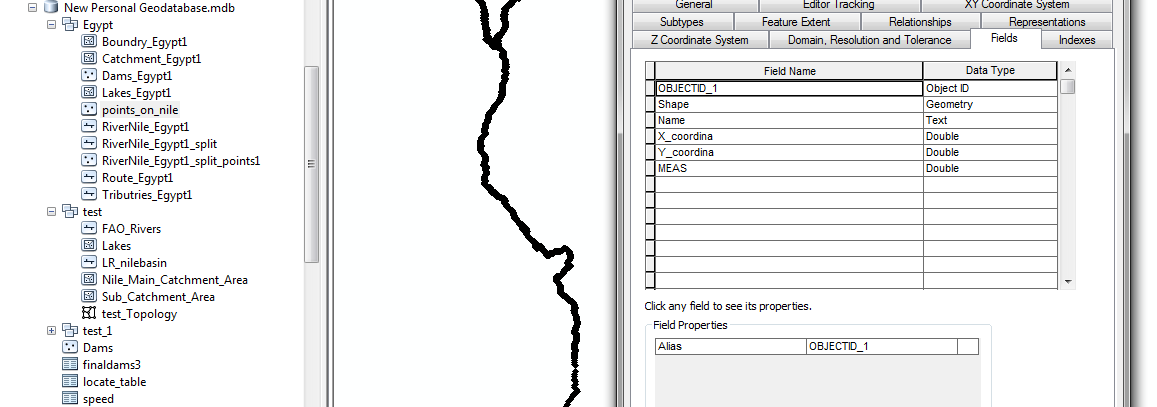 | Figure 9. Geodatabase for River Nile in Egypt after Converting Data and Designing scheme |
4.2.3. GIS Quality Control Phase
- Data Quality Control phase (DQC) is the process of controlling the usage of data with known quality measurement, this process based on Automated and Manual procedures. These procedures depend on spatial relationship matrix called Topology. Topology is Logical spatial relationships between features in the same layer or in different layers. Topology rules can be applied depending on the spatial relationships defined in designed geodatabase schema, most topology violations have fixes that used to correct errors. The topology errors handled using ArcMAP application using Fix Topology Tools; the used topology rules in this phase are defined and determined, as shown in the Figure (10).
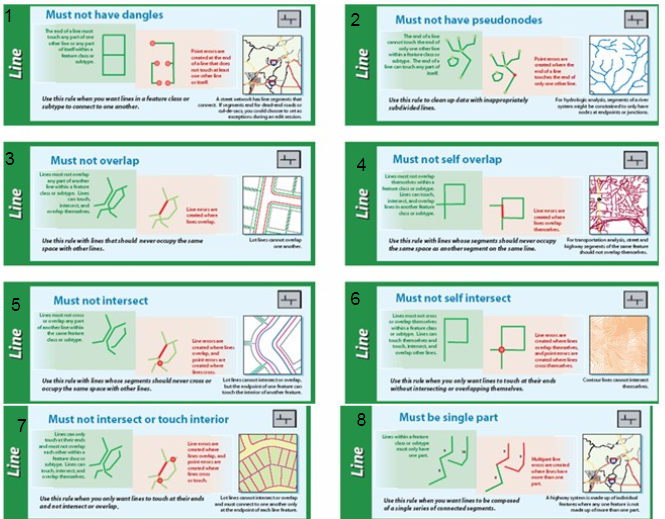 | Figure 10. Topology rules used in Quality Control Phase |
4.2.4. Appling Linear Reference Phase
- Linear Referencing is the method of storing geographic locations by using relative positions along a measured linear feature, as shown in Figure (11). [34]
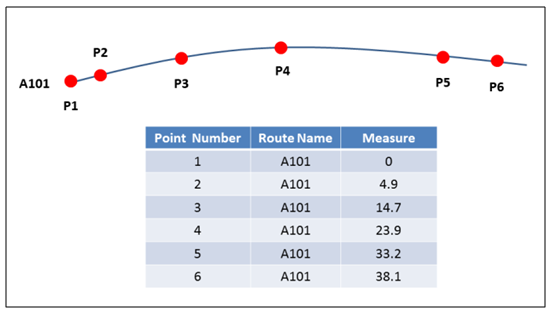 | Figure 11. Linear Reference Concept Overview |
 | Figure 12. Appling Linear Reference over River Nile in Egypt |
4.2.5. Appling Dynamic Segmentation Phase
- Dynamic segmentation is the process of computing the map location (shape) of events stored in an event table and allows multiple sets of attributes to be associated with any portion of a linear feature, as shown in Figure (13). The result of this process is a dynamic feature class known as a route event source. A route event source can serve as the data source of a feature layer in ArcMap Application. A dynamic feature layer behaves like any other feature layer. It is possible to decide whether to display it, the scale at which it should be visible, what features or subset of features to display, how to draw the features, whether to store it as a layer file or export it, and so on. [25]
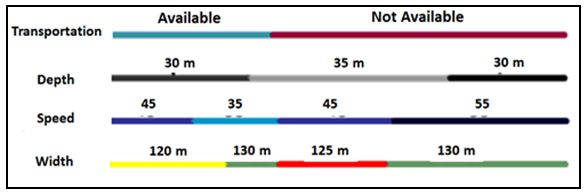 | Figure 13. Applying Dynamic Segmentation with Different Thematic Layers |
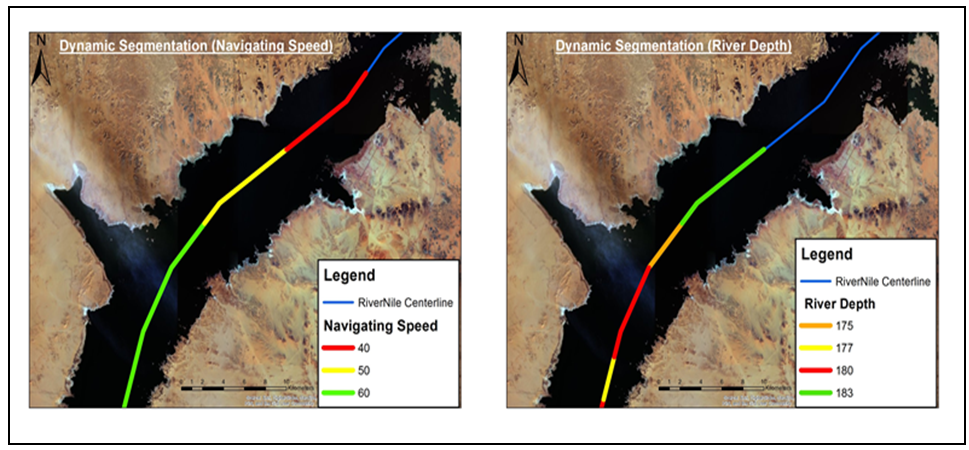 | Figure 14. Dynamic Segmentation Permissible Speed and Variation in Depths in Nasser Lake |
4.2.6. Publishing Maps and Geoprocessing Services Phase
- ArcGIS Server is used by the software developer and Web developer to create Web, desktop, and mobile applications. ArcGIS Server is the core server geographic information system (GIS) software. It is used for creating and managing GIS Web services, applications and data. ArcGIS Server services supply mapping and GIS capabilities for Web and client applications. ArcGIS Server is available for the Microsoft Windows .NET Framework and the Java Platform. It support the different types of Web services as Feature (for Web editing), Geodata (for geodatabase replication), Geocode (for finding and displaying addresses/locations on a map), Geometry (for geometric calculations such as calculating areas and lengths), Geoprocessing (for scientific modeling and spatial data analysis), Globe (for 3D and globe rendering), Image (for serving raster data and providing control over imagery delivery, such as satellite imagery or ortho photos), Keyhole Markup Language (KML), Map (for cached and optimized map services), Mobile (for running services on field devices), Network Analyst (for routing, closest facility location, or service area analysis), Search (for enterprise search of GIS assets), Web Coverage Service (WCS), Web Feature Service (WFS) and Transactional Web Feature Service (WFS-T), and Web Map Service (WMS). [36]All required data which prepared in the previous phases will be published using ArcGIS Server Application to be used by any client side platform in the developed web application “River Nile Navigation System”. Data was published as feature services and other geoprocessing tools were published as geoprocessing services and System Architecture, as shown in Figure (15).
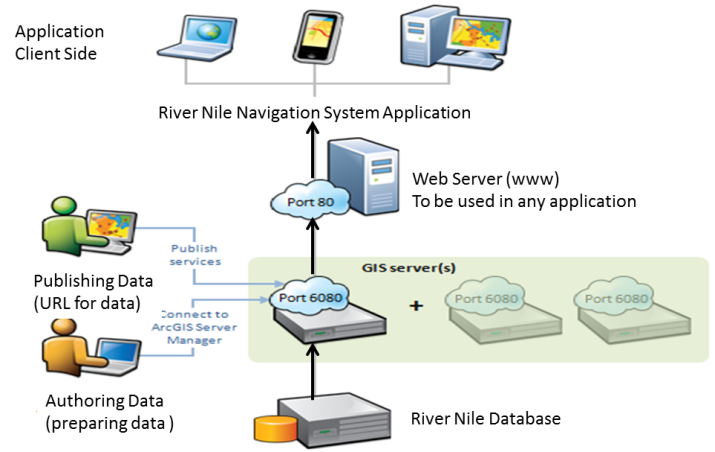 | Figure 15. Web Application Architecture for Navigation System |
4.2.7. Building Automated Navigation System for River Nile in Egypt Phase
- A web application is an application that uses a website as the interface. Users can easily access the application from any computer connected to the Internet using a standard browser. Web application is accessible anytime, anywhere and via any client side platform with an Internet connection. The user interface of web applications is easier to customize and easy to use. This extends ability to receive and interact with data, maps and information in a way that suits them. Web application architecture makes it possible to rapidly integrate enterprise systems, improving work-flow and other business processes. By taking advantage of internet technologies you get a flexible and adaptable business model that can be changed according to shifting market demands. Web applications are typically deployed on dedicated servers, which are monitored and maintained by experienced server administrators. This is far more effective than monitoring hundreds or even thousands of client computers; this means that security is tighter. [37]The most important phase in this study is building an automated navigation system for River Nile in Egypt, using Java script programming language, JavaScript is one of the three core technologies of World Wide Web content production. It is used to make webpages interactive and provide online programs, and all modern web browsers support. JavaScript supports many functional and programming styles. [38]On this application integration between Geomatics Engineering with Software Engineering on how maps, data, tools, functions and information were used in an easy useful way using programming language to build up an automated navigation system web application, as shown in Figures (16).
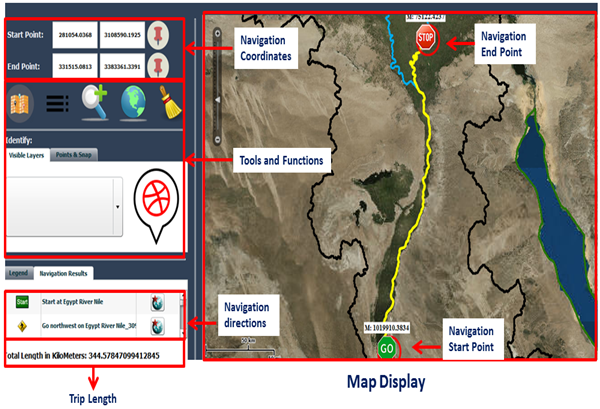 | Figure 16. River Nile Navigation System Main Screen |
5. Conclusions
- It is necessary to use and update all the available data to develop a navigation system in River Nile in Egypt. Improvement of navigation in the River Nile will increase the cargo load shipped and increase tourism boats. Then, minimize or eliminating of the overcome tourism ships stuck near Luxor and Aswan city that happed every year during the peak of the tourism season. Monitoring River Nile depths, which derived from high-resolution multispectral satellite imagery as bathymetric data, and rebuild an updated route for tourism ships through the developed application is available application. The remote sensing approach demonstrated in this study was proven effective for River Nile water bathymetry mapping. This is especially true when the study area is inaccessible for field data collection. The GeoEye multi-spectral band satellite image used in this study are compatible in spectral resolution for bathymetry mapping. Although the resultant water depths had a good precision with RMSEr 0.79 compared to echo sounder data. This method can be used in cases that frequency bathymetric data needed as our case in River Nile in Egypt. The applied approach in Esna can be generalized in any part in the River Nile in Egypt to estimate water depths to be used in navigation. Linear Reference (One-Dimension system) applied for the first time in River Nile in Egypt. Using Linear Reference system to address River Nile in Egypt features done successively. Dynamic Segmentation gives ability to present more data and information in a simple and easy way along Nile River. The developed application proved the useful of integration between Geomatics Engineering with Software Engineering on how collected maps, data, functions and information were used in an easy useful way using programming language to build up an automated navigation web application system that allows easy operation of all inertial navigation.