Wilfred Ochieng Omollo 1, Patrick Odhiambo Hayombe 2, Fredrick Omondi Owino 2
1Department of Planning and Development, Kisii University, Kisii, Kenya
2School of Spatial Planning and Natural Resource Management, Jaramogi Oginga Odinga University of Science and Technology, Bondo, Kenya
Correspondence to: Wilfred Ochieng Omollo , Department of Planning and Development, Kisii University, Kisii, Kenya.
| Email: |  |
Copyright © 2018 The Author(s). Published by Scientific & Academic Publishing.
This work is licensed under the Creative Commons Attribution International License (CC BY).
http://creativecommons.org/licenses/by/4.0/

Abstract
Policy design for spatial planning interventions should be informed by a clear understanding of the spatio-temporal dynamics of urban land use change. As such, effective monitoring of urban land use change is imperative for sustainable development. No country can for this reason can realize its full economic development if its land resources are not regularly monitored, planned and used in an orderly manner. The purpose of this study was therefore to investigate the spatio-temporal implications of land use change in Kisii Town, Kenya. It had three related objectives. The first objective that assessed land use cover change from 2005 to 2017 was analyzed using QGIS version 3.0.1 software, through integration of three satellite image epochs (2005, 2010 and 2017). Results showed that during this period, built-up areas recorded the highest expansion (275.73%), followed by forest areas (188.26%). Conversely, transitional areas recorded the lowest decline (81.89%) followed by grass/cultivated land (-35.30%). The second objective that examined the relationship population increase and expansion of built-up areas was analyzed using simple linear regression to predict the influence that population increase would have on the built-up land. Results showed that with R2 = 94%, population increase significantly predicted spatial expansion of built-up areas, F (1, 11) =29.518, p = .000, thus, an increase in population by one unit/person increased expansion of built-up areas by .026 units/hectares. As regards the third objective that determined the relationship between Land Absorption Coefficient (LAC) and Land Consumption Rate (LCR), analysis was conducted using Pearson’s bivariate correlation and simple linear regression. Results showed a significant positive correlation (r = .854, p = .005), suggesting that a decline in LAC increased LCR. In addition, regression coefficients showed that an increase in one unit of LCR led to a decline in LAC by .124 unit. The study concluded that in absence of effective planning, land use change in Kisii Town has been rapidly increasing, attributable to a declining LAC, which in turn prompts increased LCR. Recommendation was made for a comprehensive development plan as a strategy for sustainable urban development.
Keywords:
Land use change, Land Consumption Rate, Land Absorption Coefficient, Spatial planning and Kisii Town
Cite this paper: Wilfred Ochieng Omollo , Patrick Odhiambo Hayombe , Fredrick Omondi Owino , Spatio-Temporal Implications of Land Use Change in Kisii Town, Kenya, American Journal of Geographic Information System, Vol. 7 No. 2, 2018, pp. 49-57. doi: 10.5923/j.ajgis.20180702.01.
1. Introduction
Land uses compete for strategic locations within the cities and in the process of accommodating the same, cities either experience urban sprawl or re-densification (Oyugi, Odenyo & Karanja, 2017). According to Geist et al. (2006), one of the reasons why research is undertaken on land use change is to deepen the understanding on its drivers. As such, Kindu, Schneider, Teketay and Knoke (2015) argued that understanding drivers of land use is essential for modelling future development strategies as regards implementation of land use development plans. A study by Kumar (2009) in the National Capital Region of Delhi, India, assessed how land use had changed from natural to built-up areas and from agricultural to build-up areas. Results suggested that while change from natural to built-up areas was predominantly caused by expanded built-up areas, differences in land productivity on the other hand was the major driver of land use change from agricultural to built-up areas. In Karuri, Nairobi urban fringe, Thuo (2010) established that although the area dominantly grew coffee, much of it was subdivided and user changed to residential developments, thus accelerating expansion of built-up areas. This led to uneconomical sizes of land which could not sustain commercial farming. A comparative study by Du, Jin, Yang and Zhou (2014) showed that overall land use change in Jiangsu Province, China, was significant and was demonstrated by progressive agricultural land loss at the expense of expanded built-up land that was significant in all areas, notably in the northern part of Jiangsu, where the recorded annual expansion rate was 22.58 times more than that of the period 2000–2005, a challenge attributed to ineffective development control. A further study by Kiio and Achola (2015) in Kiambu, Kenya, for the years 1984, 1993, 2002 and 2013 showed that agricultural land reduced over the period from 39.7% to 15.8%, a pointer that the region was becoming food insecure, considering that its population also grew at a similar rate. Built-areas increased over the same period, from 1.9% to 33.5%, showing a high demand for houses to support increased population. A similar trend ensued in Mansoura and Talkha cities, Egypt, where Hegazy and Kaloop (2015) observed that drivers of land use change, included rapid urban growth accelerated by unplanned expansion and increasing population, resulting to losses of agricultural land and water bodies. In this case, while built-up area expanded from 28 km2 to 255 km2, an increment by more than 30%, conversely, agricultural land declined by 33%. In a related study in the Qom, Iran, Mosammam, Nia, Khani, Teymouri and Kazemi (2017) likewise showed that rapid expansion of built-up areas was the main driver of land use change in the areas planned for agriculture, open space and wasteland. They predicted the trend to continue with built-up areas increasing by 10% in 2022, a prospective loss of 438.03 ha of agricultural land, 638.37 ha of wasteland, and 17.01 ha of open space, signalling inadequate land use control.From the foregoing exploratory review, it is apparent that most past studies acknowledges that land use change is mainly impelled by expansion of built up areas, attributable to increased population. However, a scarcity in literature still exist on how the relationship between (a) population increase and expansion of built-up areas, and (b) relationship between LCR and LAC, may be both statistically tested for significance, a gap filled by this study. These relationships were envisaged as key determinants of land use change in Kisii Town. Additionally, though many studies on land use have previously been undertaken in Kisii Town, their scope were basically limited to land suitability mapping, improving access to affordable housing, infrastructure and shortage of land as a result of population increase. This reveals a major gap in knowledge on how spatiotemporal analysis may be applied to correlate the significant drivers of land use change. The current study specifically deepens the understanding that rapid urban land use change in absence of comprehensive spatial planning and development control framework is a substantial key contributor to unsustainable development. The objectives of this study were therefore to:a) Assess land use cover change in Kisii Town from 2005 to 2017.b) Examine the relationship between population increase and expansion of built-up areas in Kisii Town.c) Determine the relationship between LAC and LCR in Kisii Town.
2. Methods and Materials
2.1. Description of the Study Area
Kisii Town is located 120 km South of Kisumu City and about 400 km West of Nairobi City and covers an area of 35 km2 out of which 15 km2 falls within the central business district which is leasehold, while the rest consists of periurban settlements in freehold areas. The town’s topography is characterized by a series of valleys and further located on a confluence of numerous valleys surrounded by gentle to steep hills. In the South West lies Nyanchwa Hills at an altitude of 1800 metres above sea level and to the North East are the Mwamosioma Hills rising to about 1800 metres above sea level. To the South is the mountainous Bobaracho and Gesarara rising up to 1950 metres above sea level. It is also drained by several streams which are tributaries of River Riana (UN Habitat, 2009). The town’s population currently stands at approximately 93,959 with annual population growth rate of 2.7%, which is higher than Kenya’s average of 2.6%. It is also the most densely populated town in the western part of Kenya with 2,862 persons per square kilometre. In terms of land use planning, while the entire Kisii Town covers 34 km2, the current physical development plan currently used to enforce development control by the County Government of Kisii covers only 4.35 km2 (12.79%). The town therefore lacks a comprehensive spatial framework for controlling land use change (Figure 1).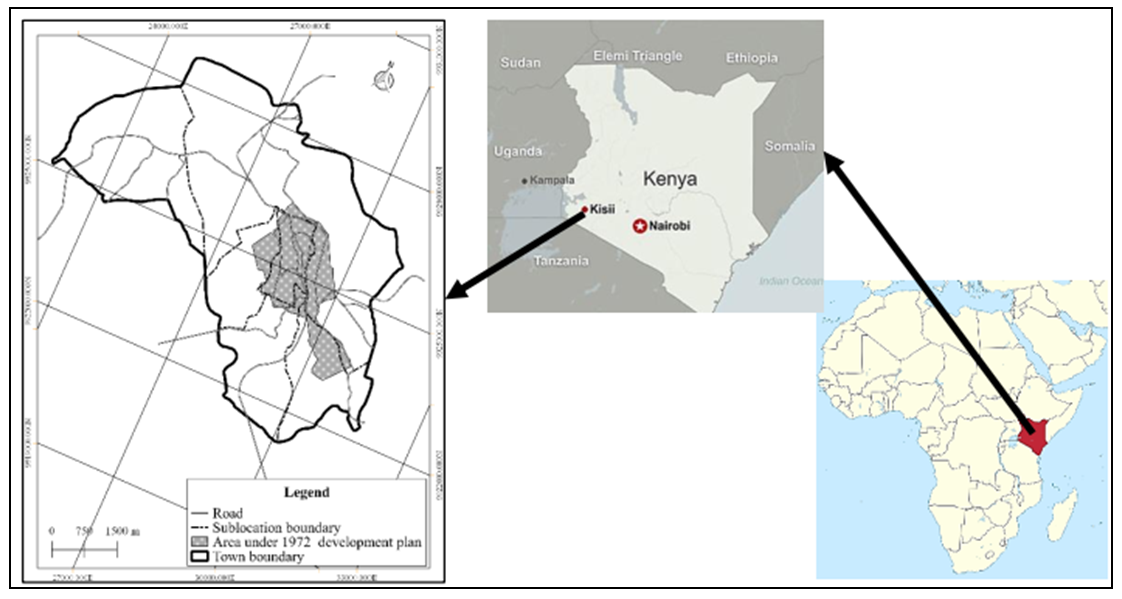 | Figure 1. Location of the study area |
2.2. Land Use Classification for Kisii Town
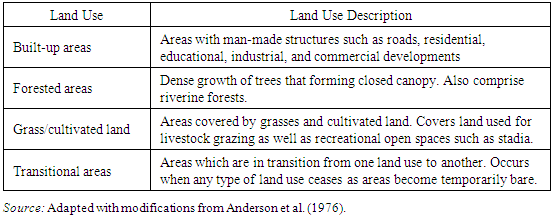
There is no one ideal classification of land use and land cover, and it is unlikely that one could ever be developed. Each classification is made to suit the needs of the user. In attempting to develop a classification system for use with remote sensing that provides a framework to satisfy the needs of the majority of users, certain guidelines of criteria for evaluation must thus be established (Anderson, Hardy, Roach & Witmer, 1976). Based on knowledge of the study area in addition to ground truthing undertaken, land use cover classification scheme was developed for Kisii Town, a modification of Anderson et al. (1976) (Table 1).Table 1. Land Use Classification Scheme for Kisii Town
 |
| |
|
Land use cover maps were generated after running a Maximum Likelihood (ML) supervised classification. ML, according to Ahmad and Quegan (2012), is based on the Bayes Theorem and uses a discriminant function to assign pixel to the class with the highest likelihood. In this case, each pixel is assigned to the class with the highest likelihood or labelled as unclassified if the probability values are all below a threshold set by the user.
2.3. Data Source and Spatiotemporal Analysis
Data collection for spatiotemporal analysis to address the first objective was attained using procured georeferenced satellite images of three epochs procured from the Regional Centre for Mapping of Resources for Development (RCMRD), Nairobi. Epochs’ specifications were as follows:a) 2005: QuickBird-2 (QB-2) satellite (10th July, 2005), panchromatic/spatial resolution of 0.61 metres and four multispectral band resolution of 2.4 meters.b) 2010: WorldView-2 (WV02) satellite dated 17th December, 2010, with a panchromatic/spatial resolution of 0.46 and eight-band multispectral imagery resolution of 1.84 metres.c) 2017: WV0-3 satellite of 19th January, 2017, with a panchromatic/spatial resolution of 0.31 metres, eight-band multispectral imagery of 1.24 metres resolution, shortwave infrared imagery at 3.7 meters resolution, and CAVIS (Clouds, Aerosols, Vapors, Ice, and Snow) data of 30 metres resolution. QGIS software, version 3.0.1 was used for spatial analysis. It was preferred over other competing software such as ArcGIS, because as an open source software, no costs were incurred in its acquisition. In addition, it has plugins which are easily downloadable and frequently updated. Particular reference was made to open layers plugin which readily integrates with Google satellite to allow georeferencing along with earth view plugin which directly integrates both raster and vector data. Spatial analysis therefore entailed the following processes:a) Clipping of areas covering the years 2005, 2010 and 2017 using the vectorised boundary of Kisii Town.b) Identification of Regions of Interest (ROI) for the images covering the years 2005, 2010 and 2017. c) Undertaking semi-automated image classification using maximum likelihood algorithm.d) Running classification output to derive land use for the 2005, 2010 and 2017, and further determining percentage change per land use class for each year.All the procured satellite images from RCMRD had already been digitally pre-processed by the Centre to address issues such as rectification, pixel sampling, image fusion and co-registration, thus giving credence to spatial analysis.
2.4. Test of Statistical Significance
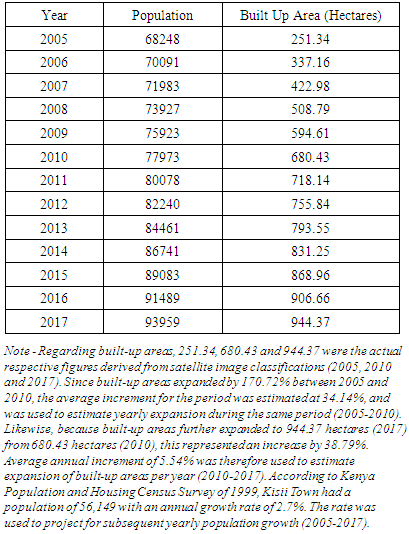
To test for the influence of population increase on built-up areas, as well as that of LAC on LCR, simple linear regression and Pearson’s bivariate correlation were respectively used. According to Kenya Population and Housing Census of 1999, Kisii Town population was 56,149 with an annual increase 2.7%. This formed the basis for projections between 2005 and 2017. Areas for built-up areas were extracted from the satellite imageries of 2005, 2010 and 2017.
3. Findings and Discussions
3.1. Assessment of Land Use Cover Change, 2005-2017
3.1.1. Land Use Cover in 2005
Land use classification in 2005 showed that built-up areas largely occupied the central part of the town, which describes the spatial extent of the Kisii Town Physical Development Plan. The pattern sprawls outwards in a linear pattern guided by key transportation corridors, thus underpinning the primacy role of this central region in the town’s spatial development pattern. According to Moomaw and Alwosabi (2007), primacy refers to a central place within an urban area having high of dominance elicited by population density and the diversity of functions offered. Grass/cultivated land accounted for the highest coverage of 73.40% (2577.10 ha) of the total area, followed by transitional areas (11.48%), built up areas (7.16%) and forest at 7.97% (279.67 ha) respectively. Much of the forested areas planted by farmers for commercial purpose were observed to be located along the river banks (Figure 2).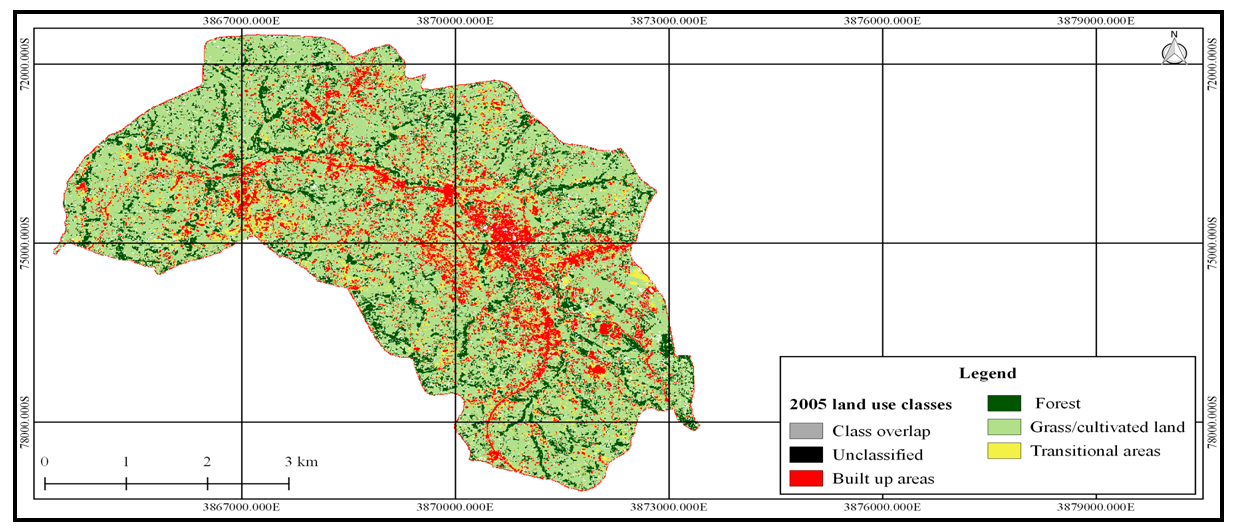 | Figure 2. Land Use Cover for Kisii Town in 2005 |
Overall accuracy is determined by dividing the sum of all properly classified pixels, found along the central diagonal, by the total number of reference pixels. It shows an overall result of the tabular error matrix. Anderson et al. (1976) suggested that the minimum overall accuracy should not be less 85%. Comparatively, the overall accuracy for 2005 land use classification was 89.82%. In addition, the overall Khat classification was 0.83, graded by Landis and Koch (1977) as almost perfect agreement.
3.1.2. Land Use Cover Change in 2010
The overall accuracy for 2010 classification was 90.82% which was above Anderson et al. (1976) suggested threshold of 85%. In addition, the Khat classification of 0.85, depicted a strong assessment and good accuracy. It embodies a probable 85% better accuracy than if the classification resulted from a random assignment. As the case of 2005 land use classification, the built-up areas continued to dominate the central part of the town covered by the development plan. However, a remarkable difference from 2005 classification is that 2010 classification was characterized by increased densification of the built –up areas, occasioned by increased LCR and declining LAC. Built-up areas by 2010 had increased to 680.43 hectares from 251.34 hectares that existed in 2005, representing a significant expansion by 170.72%.Forest land on the other hand also increased to 775.26 hectares in 2010 compared to 279.67 hectares in 2005, in consequence an increase by 177.20%. Grass/cultivated land however declined to 1634.95 hectares in 2010 from 2577.10 hectares in 2005, a decrease by 36.55%. Lastly, land under transitional areas as well decreased to 394.34 hectares from 403.00 hectares recorded in 2005, hence a reduction by 2.15% (Figure 3).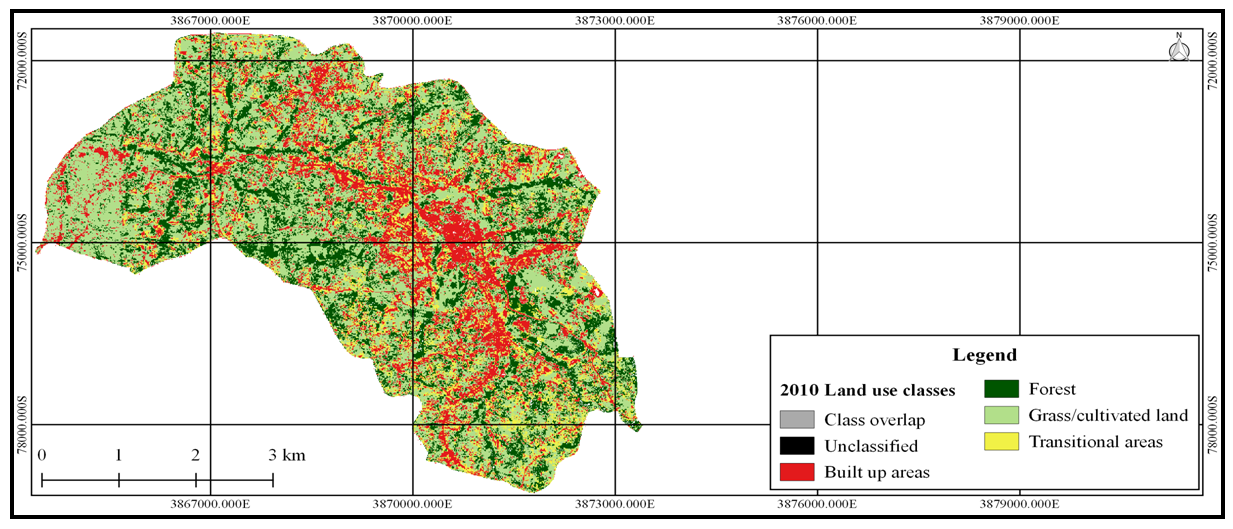 | Figure 3. Land Use Cover Change for Kisii Town in 2010 |
3.1.3. Land Use Cover Change in 2017
The overall accuracy attained for the 2017 classification was 92.07%. This was also above Anderson et al. (1976) recommendation of a minimum of 85%. Moreover, the Khat classification was also 0.87, which is greater than 0.8, for that reason depicting a strong assessment and good accuracy. This epitomises a probable 85% better accuracy than if the classification resulted from a random assignment. Results postulated that grassland/cultivated areas was dominant, as supported by 47.6%, followed by built up areas, forest and transitional areas, which respectively occupied 27.05%, 23.08%, and 2.09%. A comparison with the previous classification (2010) reveals that coverage under built-up areas increased from 680.43 hectares to 944.37 hectares, a further expansion by 38.90%. In the same fashion, forested areas increased from 775.26 hectares in 2010 to 806.19 hectares in 2019, denoting 4.0% increase. Grass/cultivated land equally witnessed a marginal increment by 2.0% from 2010 (1634.95 hectares to 1667.38 hectares). Transitional areas markedly experienced a reduction from 394.34 hectares in 2010 to 72.99 hectares in 2017 signifying a decline by 81.49%. This reduction may be explained by the circumstance that by the time satellite image had been taken, the land use category might have already converted to other users, particularly built-up areas, which has maintained a remarkable expansion. The spatial distribution for 2017 land use categories further shows that built-up areas have continued to laterally expand outwards from the town centre covered by the development plan (Figure 4).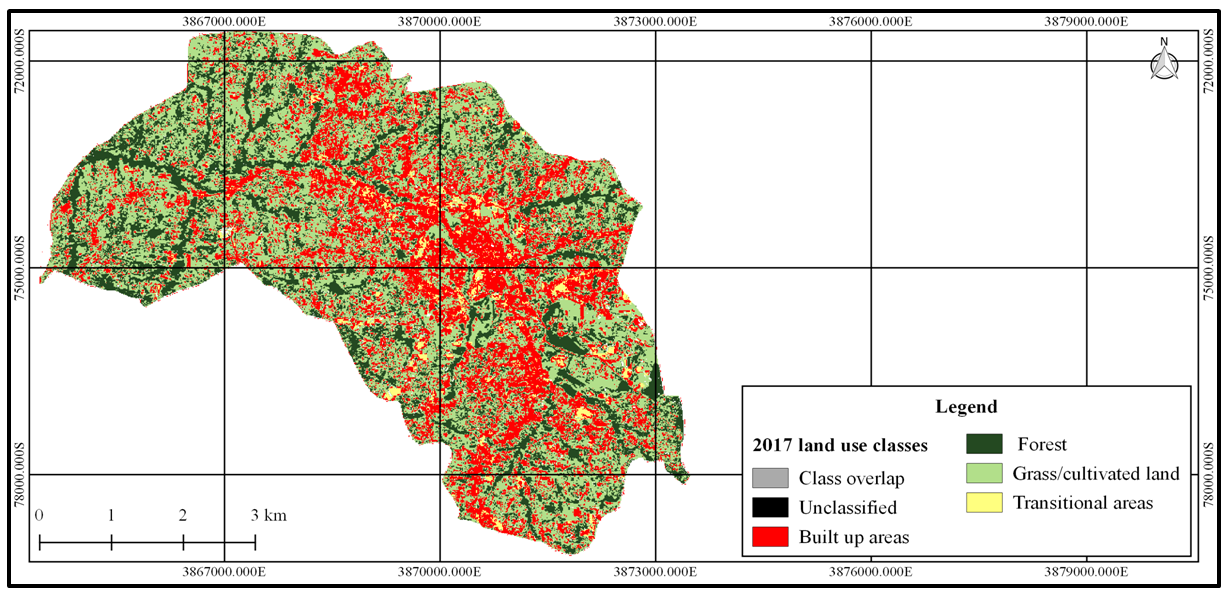 | Figure 4. Land Use Cover Change for Kisii Town in 2017 |
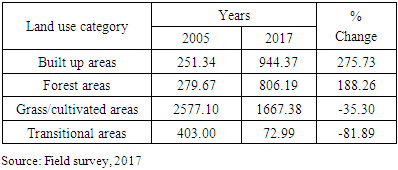
3.1.4. Comparative Land Use Change, 2005-2017
Land use in Kisii Town has undergone through a momentous transition between 2005 and 2017. For example, in 2005, built-up areas which covered 251.34 hectares exponentially increased to 1036.32 hectares by 2017, a transition by 275.73%. This may be explained by two competing standpoints. First is the increased population which was 64,311 in 1999 and increased to 101,511 in 2017, compounded by a corresponding increase in the number of households from 15,486 in 2009 to 22,336 in 2017. This hastened pressure on land use as demand to develop more housing and attendant infrastructure escalated. Second, in 2017 as the case of preceding years, much of the commercial activities were concentrated within the CBD. However, this changed owing to rapid population increase, as a consequence creating demand for intensified commercial land use in the CBD and neighbourhoods such as Nyanchwa, Mwembe Tayari, Nyamataro and Jogoo. The inception of devolution in 2003 which designated Kisii Town as the county head quarter further contributed to intensification of commercial land use. Alongside these two factors, the town has equally experienced rapid infrastructural development, further fuelling a rapid expansion of built-up areas. Although one would expect a decline in forest cover attributable to probable consumption by built-up areas, land under forest recorded a significant increase by 188.26%. As observed during ground truthing, this increase was occasioned by commercial planting of trees by farmers predominantly along river banks, as well as planting of the same by institutions having large tracks of land such the Kisii Sports Club, Coffee Research Foundation (CRF), Gisii National Polytechnic and Kisii University Main Campus. Unlike built-up areas and forest land which concurrently witnessed significant positive expansion, grass/cultivated land as well as transitional areas in contrast experienced a noticeable decline confirmed by -35.30 and -81.89% correspondingly. This was attributed to land previously under their coverage being consumed by built-up areas (Table 2).Table 2. Comparative Land Use Change, 2005 to 2017
 |
| |
|
In general, rapid expansion of built-up areas in Kisii Town mostly occurred between 2008 and 2017. According to Miruka (2010), the town offered solace to many entrepreneurs after the 2008 Post Election Violence (PEV) that affected Kenya. During this time, a majority of entrepreneurs from neighbouring towns such as Kisumu, Kericho and Eldoret migrated to the town, further transforming its stature in land use. This contributed to increased economic activities resulting to a multiplier effect in growth of real estate as well as industrial and commercial activities. This assertion was validated by Tinega (2018) who observed that during PEV, the town became a hub of all retail and wholesale trade in the entire South Nyanza and parts of Southern Rift Valley owing to its tranquility. It was however unfortunate that this rapid growth rate was not concomitant with effective development control.
3.2. Relationship Population Increase and Expansion of Built-Up Areas in Kisii Town
The second objective of this study sought to determine the relationship between population increase and expansion of built-up areas between 2005 and 2017. Analysis commenced by a descriptive comparison of population increase and corresponding built-up areas (Table 3).Table 3. Population Increase and Built-up Environment, 2005-2017
 |
| |
|
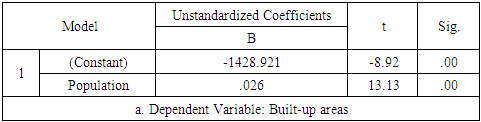
Based on above findings, a simple linear regression was conducted to predict expansion of built-up areas based on population increase. In this case, data on population increase was taken as the independent variable while that of areas covered by built-up areas (hectares) was the dependent variable. Preliminary results showed that the correlation coefficient (R) between the two variables, r = .970, p = .000, was not only highly positive, but equally statistically significant. This supports that an increase in the town’s population significantly contributed to land use change through a corresponding expansion of built-up areas. Moreover, the coefficient of determination (R2) showed that 94.0% of variation in the dependent variable (expansion of built up areas) was explained by the independent variable (population increase).This further maintains that the independent variable significantly predicted the dependent variable. Further, in reference to the linear regression model, because the F-statistic of 172.277 was greater than the F-critical of 4.84, the relationship was highly significant, F (1, 11) =172.277, p = .000, suggesting a good fit. The effects of the regression coefficient was further demonstrated (Table 4).Table 4. Coefficients for Built-Up Area and Population Increase
 |
| |
|
Results shows that an increase in population by one unit/person increased expansion of built-up areas by .026 units/hectares, thus a key determinant of land use change.
3.3. Relationship between Population Increase LCR and LAC in Kisii Town
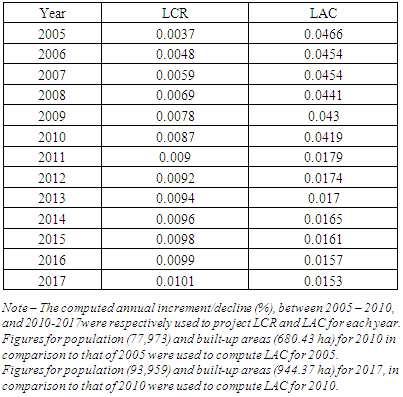
Based on the presented spatio-temporal analysis, the third objective determined the relationship between LCR and LAC in Kisii Town. LCR is a measure of compactness of urban structures and indicates the spatial expansion of a city. The high value of LCR shows crowdedness while low value indicates free spaces. Conversely, LAC measures change in consumption of new urban land by each unit increase in urban population (Yeates & Garner, 1976; Oyugi, Odenyo & Karanja, 2017). It furthermore draws attention on how new land is being used for built-up purposes, leading to urban sprawl (Dadhich, Goyal & Dadhich, 2017). LCR and LAC were computed in Microsoft Excel 2013 software using the following formula recommended by Yeates & Garner (1976):Ÿ LCR =A ÷ P, where, A = Areal/spatial extent of the city in hectares and P = Population.Ÿ LAC = A2 – A1÷ P2 – P1, where, A2 and A1 = Areal extents (in hectares) for the early and later years, and P2 and P1 = Population figures for the early and later years, respectively.While the LCR in 2005 was 0.0037, it improved to 0.0087 in 2010 and further to 0.0101 in 2017 a significant increment by 172.97%. This discloses that built up-areas in Kisii Town have been in the last twelve years spatially sprawling outwards due to upsurge in population growth occasioned by overcrowding, suggesting the need for effective spatial planning and development control.The figures used for computing the relationship between LAC and LCR is presented in Table 5. Table 5. Comparison of LCR and LAC
 |
| |
|
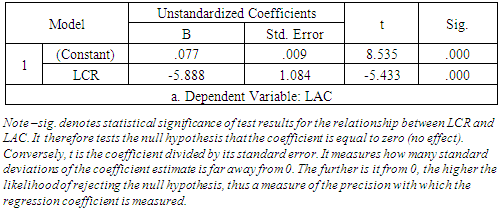
As the case of the second objective, the relationship between LCR and LAC in the study area was also tested using a simple linear regression model where LAC was the dependent variable and LCR the independent variable. The relationship was first tested using Pearson’s bivariate correlation to determine the statistical significance between the two variables. There was a strong negative linear correlation between LAC and LCR, which was statistically significant (r = .854, p = .005), suggesting that a decrease in LAC elicited a parallel increase in LCR. Results of the coefficient of determination (R2) in the linear regression model also indicated that 72.9% of variation in the dependent variable (LAC) was accounted for by the independent variable (LCR), an indication that LCR was an indicator for a decreased LAC in Kisii Town. Since the F-statistic of 29.518 in the model was greater than the F-critical of 4.84, the relationship was highly significant, F (1, 11) =29.518, p = .000, suggesting a good fit. The impacts of the model’s regression coefficients was further determined (Table 6).Table 6. Coefficients for LCR and LAC
 |
| |
|
Above table postulates that an increase on one unit of LCR relates to a corresponding decline in LAC by .124 units. This corroborates that as consumption of new urban land use declines attributable to an increase in population, LCR of the built-up environment increases, through spatial expansion. This discloses that built up-areas in Kisii Town have been in the last twelve years spatially sprawling outwards due to upsurge in population growth occasioned by overcrowding within the town centre. The impacts of declining LAC was further depicted spatially through high resolution satellite imagery using a selected neighborhood in Nyanchwa residential estate (Figures 5 and 6).While the first satellite image shows built-up areas in 2005 (Figure 5), the second one covers 2017 (Figure 6). It can be seen that in 2005, most building developments seemed to be limited to the ground floor. Additionally, it is evident that a lot of land seemed to be available for development. Conversely, in 2017, the same site was characterized by increased building developments elicited by increased densities and a corresponding decline in the previously available open spaces which attracted developments. This was credited on increasing LCR and declining LAC, a relationship tested using Pearson’s correlation, where results revealed a strong negative correlation which was statistically significant (r = -.854, p = .000), suggesting that a decline in LAC prompts an increase in LCR on the account of scarcity of land that could support more urban development.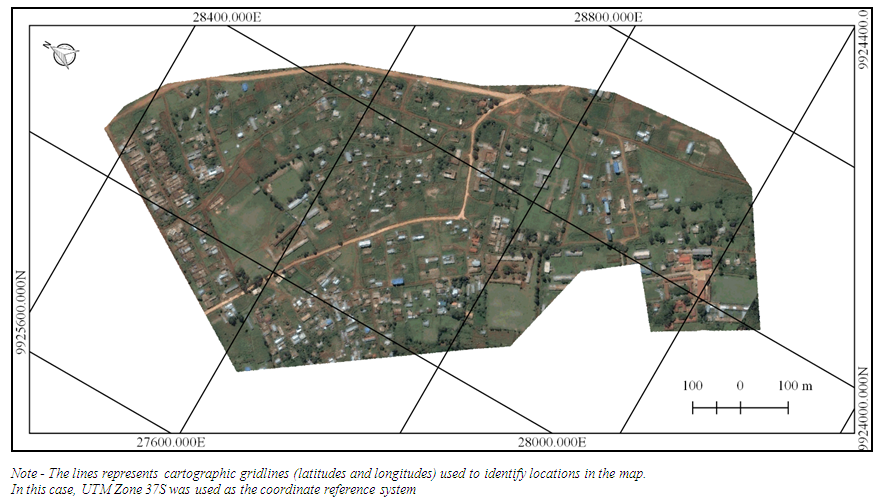 | Figure 5. Effects of LCR and LAC in part of Nyanchwa estate, 2005 |
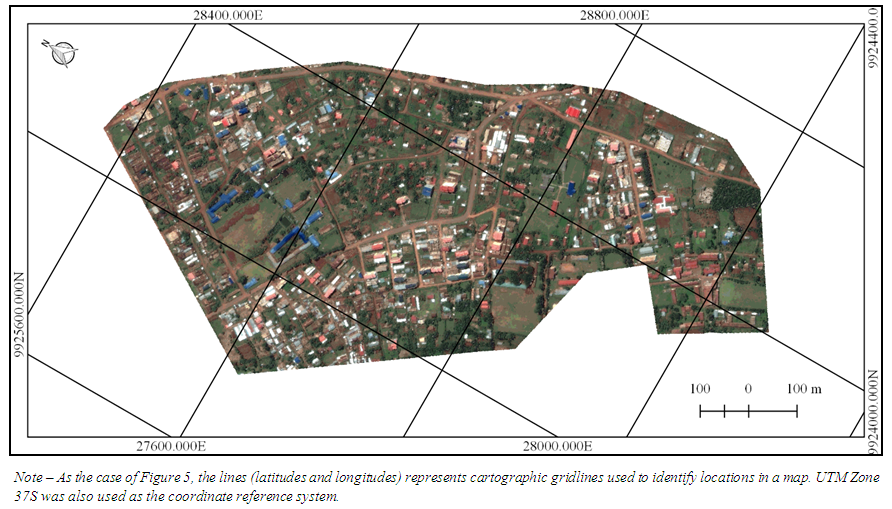 | Figure 6. Effects of LCR and LAC in part of Nyanchwa estate, 2017 |
4. Conclusions
Land use in Kisii Town underwent through major transitions between 2005 and 2017, with built-up areas accounting for the highest expansion. As such, the central argument maintained in this study was that the observed spatio-temporal change, in absence of current strategic spatial planning, has predominantly been hastened by increased population, leading to a decrease in LAC, which in turn accelerates LCR, further contributing to uncontrolled sprawl of built-up areas by the planning authorities.Ideally, observed change should be accompanied by corresponding initiatives towards effective development control. However, this is not the case in Kisii Town where unregulated land use change is typified by challenges such as nonconformity to the approved physical development plan by ensuing land use patterns as well as noncompliance with recommended physical planning standards. These problems continues unabated irrespective of the existing policy guidelines and legal framework that grants the County Government of Kisii the mandate of undertaking development control. Thus, in a foreseeable future, it is predicted that in absence of visionary spatial planning initiatives, unregulated land use change as already spatially demonstrated, will continue to fuel unsustainable urban development. As alluded to before, the problem exacerbates owing to the fact that the 1972 physical development plan which is currently used by the County Government to control development is not only outdated, but similarly covers only 4.35 km2 of the total town’s area of 34 km2 (12.79%), indicating that 87.21% of the town in not planned (Figure 1). As such, observed rapid land use change in Kisii Town occurs without a comprehensive land use development plan, effectively making developers, who induce land use change, to be constantly ahead of planners. The County Government of Kisii, in consultation with key stakeholders should therefore prepare a comprehensive Integrated Urban Development Plan that covers the entire town as construed under section 36 of the Urban Areas and Cities Act (2012). The plan should provide a clear spatial planning framework for development control by demarcating the town into distinct zones with prescribed minimum physical planning standards. This will ensure that the observed and anticipated spatio-temporal land use change is accompanied by comprehensive strategic spatial planning.
References
| [1] | Anderson, J.R., Hardy, E.E., Roach, J.T., and Witmer, R.E. (1976). A land use and land cover classification system for use with remote sensor data: Geological Survey Professional Paper 964. |
| [2] | Dadhich, A.P., Goyal, R., and Dadhich, P.N. (2017). An assessment of urban space expansion and its impact on air quality using geospatial approach. Journal of Urban and Environmental Engineering, 11(1), 79-87. |
| [3] | Du, X., Jin, X., Yang, X., and Zhou, Y. (2014). Spatial pattern of land use change and its driving force in Jiangsu Province. International Journal of Environmental Research and Public Health, 11, 215-3232. |
| [4] | Geist, H., McConnell, W., Lambin, E.F., Moran, E., Alves, D., and Rudel, T. (2006). Causes and trajectories of land-use/cover change. In E.F. Lambin, H.J. Geist (Eds.), Land-use and land-cover change: Local processes and global impacts (pp. 41-70). New York: Springer. |
| [5] | Hegazy, I.R., Kaloop, M.R. (2015). Monitoring urban growth and land use change detection with GIS and remote sensing techniques in Daqahlia Governorate Egypt. International Journal of Sustainable Built Environment. Retrieved from http://dx.doi.org/10.1016/j.ijsbe.2015.02.005. |
| [6] | Kiio, M.M., and Achola, O.P. (2015). Land use land cover changes and their effects on agricultural land: A Case study of Kiambu County. Kenya. Kabarak Journal of Research & Innovation, 3 (1), 74-86. |
| [7] | Kumar, P. (2009). Assessment of economic drivers of land use change in urban ecosystems of Delhi, India. AMBIO: A Journal of the Human Environment 38(1), 35-39. |
| [8] | Miruka, B. (22 July 2010). Post-poll immigrants spur Kisii town's growth. Standard Newspaper. Retrieved from https://0x9.me/BSYzJ. |
| [9] | Moomaw, R.L. and Alwosabi, M.A. (2007). Urban primacy, gigantism, and international trade: Evidence from Asia and the Americas. Journal of Economic Integration, 22 (2), 439-460. |
| [10] | Mosammam, H.M., Nia, J.T., Khani, H., Teymouri, A., and Kazemi, M (2017). Monitoring land use change and measuring urban sprawl based on its spatial forms: The case of Qom city. The Egyptian Journal of Remote Sensing and Space Science. 20 (1), 103-116. |
| [11] | Oyugi, M.O., Odenyo, V.A., and Karanja, F.N. (2017). The implications of land use and land cover dynamics on the environmental quality of Nairobi City, Kenya. American Journal of Geographic Information System, 6(3), 111-127. |
| [12] | Republic of Kenya (2012). Urban Areas and Cities Act. Nairobi: Government Printer. |
| [13] | Republic of Kenya (1999). Population and Housing Census Surveys. Nairobi: Government Printer. |
| [14] | Tinega, I.C. (2018). Post-election violence in Kisii Town: Positive economic influence 2007-2013. British Journal of Education. 6 (2), 32-44. |
| [15] | Thuo, A.D.M. (2013). Qualitative analysis of land use change pressures, conditions and drivers in rural-urban fringes: A case of Nairobi rural-urban fringe. International Journal of Innovation and Applied Studies, 3 (3), 820-828. |
| [16] | UNDP. (2009). Kisii Strategic Urban Development Plan. Urban Design and Planning Services Unit. |
| [17] | Yeates, M and Garner, B. (1976). The North American City. New York: Harper and Row Pub. |

 Abstract
 Reference
 Full-Text PDF
 Full-text HTML