-
Paper Information
- Paper Submission
-
Journal Information
- About This Journal
- Editorial Board
- Current Issue
- Archive
- Author Guidelines
- Contact Us
American Journal of Geographic Information System
p-ISSN: 2163-1131 e-ISSN: 2163-114X
2018; 7(1): 40-47
doi:10.5923/j.ajgis.20180701.04

Spatial Distribution of Solid Waste Disposal Methods, Predictions and Risk Susceptibility Using Multiple Regression Model in Nigeria
 Abstract
 Reference
 Full-Text PDF
 Full-text HTML
Murtala Rabiu1, Mohmad Al-Sheik2
1Department of Geography, Isa Kaita College of Education, Dutsinma, Nigeria
2Department of Geography and History, University of Gezira, Gezira, Sudan
Correspondence to: Murtala Rabiu, Department of Geography, Isa Kaita College of Education, Dutsinma, Nigeria.
| Email: |  |
Copyright © 2018 The Author(s). Published by Scientific & Academic Publishing.
This work is licensed under the Creative Commons Attribution International License (CC BY).
http://creativecommons.org/licenses/by/4.0/

There have been miniature researches in the area of geo-spatial demography (GSD), though studies were conducted to look in to spatial reference data for geo-demographic analysis, the location of social infrastructures, decision making processes for the provision and distribution of products and services, spatial variability that are limits to natural causes and in analyzing tertiary education institutions clustering in a particular sub-national regions to mention but a few. This study focus on analyzing the spatial distribution of conventional solid waste disposal methods sourced from National Population Commission across Nigeria through prediction of risk prone states by using multiple regression model and visual display of spatial distribution pattern of (NEFWDM) among Nigerian states using GIS pattern analysis. The R value of 0.735 suggest a good level of model’s prediction, R2 value of 0.541 shows the dependent variables NEFWDM explained 54.1% of the variability of dependent variable. F value of 9.427 suggests good improvement in fitting the model F>1, it is very unlikely to have happen by chance. As the number of households using NEFWDM increases, number of households at risk increases. The Getis-Ord Gi* suggest states with high risk of vulnerability to communicable diseases for each predictor variable in NEFWDM. These states visually found clustered across Nigeria. Moran’s I spatial association suggest the rejection of Ho of complete spatial randomness (CSR) for buried waste p<0.01, for unapproved waste and other p<0.05. Ho for burnt waste has to be accepted p>0.10. This research will be good resources for disaster managers in pre-disaster phase, environmental management and health/sanitation controls. It has implication in authorities’ budgetary provisions. This research reduced to methods of solid waste disposal, there is little known in terms of type of waste generated, we recommend further studies to foster identification of hazardous materials and their respective sources. Provision of adequate sanitary solid waste disposal methods such as collected in polythene bags and government approved dump sites has to be promoted, mass public awareness be encouraged among households about possible risk of persistence adoption of NEFWDM.
Keywords: GIS, Prediction, Regression, Risk, Solid Waste, Spatial
Cite this paper: Murtala Rabiu, Mohmad Al-Sheik, Spatial Distribution of Solid Waste Disposal Methods, Predictions and Risk Susceptibility Using Multiple Regression Model in Nigeria, American Journal of Geographic Information System, Vol. 7 No. 1, 2018, pp. 40-47. doi: 10.5923/j.ajgis.20180701.04.
Article Outline
1. Introduction
- There have been miniature researches in the area of geo-spatial demography (GSD). Though some researchers have shown their interest in simplifying spatially referenced data for geo-demographic analysis by presenting spatial interaction modification model (SIMM2) (Son et al., 2013). This is spatial thinking, but the long traditional geo-spatial studies however, aimed at facilitating human needs without foreseeing risk contained in it, the location of social infrastructures for instance by integrating spatial analysis and community needs assessment to improve service accessibility (Baig et al., 2016). Most geo-demographic analysis studies were used in many decision making processes in solving problems of provision and distribution of products and services, different models were proposed to aid this dimension such as kernel fuzzy geographically clustering (Son, 2015), they failed to tackle upshots might crop up from those processes.There are researches though, dealt with human population and demographics in assessing and converting risk, but limits to natural causes omitting socio-economic operations which could result to posing hazard in the societies, the examination of spatial variability related to natural hazard for example hurricane were confronted by using risk index and social vulnerability index (Chakraborty et al., 2005). It is interesting researchers utilizes the benefit of geo-demographic-spatial data in analyzing tertiary education institutions clustering in a particular sub-national regions with no cognizance to population size, in country like Nigeria were clustering of such institutions were in the south-western region (Ingwe et al., 2011), there isn’t any predictable risk manifest therein.This study focus on analyzing the spatial distribution of conventional solid waste disposal methods across Nigeria to resuscitate inconsistencies of sub-national leave out. It fosters desirable environmentally friendly solid waste disposal methods (EFWDM) and non-environmentally friendly solid waste disposal methods (NEFWDM) from the conventional solid waste disposal methods. The uniqueness in this research is the proposed model to predict risk on board the persistence utilization of (NEFWDM).The main purpose of this study is to investigate how continuing utilization of (NEFWDM) could trigger households at risk of varied disaster. This can be achieved through prediction of risk prone states by using multiple regression model and display of spatial distribution of (NEFWDM) among Nigerian states using GIS pattern analysis. The review of related literature herein could better the understanding of scope of this study. Data from National Population Census was used and it carries the distribution of regular households by method of solid waste disposal in Nigerian states.Prediction of solid waste generation has been given concern in developing countries, many reasons are given as causative agents of solid waste generation, in Oyo state Nigeria Income, Household size, Social status, Educational level, Occupation and Season of the year have explained 88.8% of solid waste generated (Abel and Afolabi, 2007), this is traditionally a non-spatial regression which may not provide sufficient information for better solid waste management as asserted by Kaser et al (2012). In another dimension, binary logit estimates model suggested determinants of solid waste management by households encompass Income, Travel time to the dump site, Marital status as well as awareness of laws concerning waste disposal and activities of sanitary inspectors (Ezebilo and Animasaun, 2011). In a similar vein, a study was undertaken to examine the performance of public private partnership in household solid waste generation in Lagos Nigeria, indicates that the public private partnership performance is significantly influenced by economic status, affordability, flexibility, consistency, cleanliness, coverage and accessibility, as well as number of waste collection vehicles, vehicle maintenance, capacity, trip rate, frequency, number of personnel and quality of personnel (Ibrahim Rotimi et al., 2014). The research concluded that Lagos residents have strong positive perception of public private partnership as a waste collection policy framework.Regression models however, have been used in other segment of physical sciences, Chang and Li (2000) have used the model for modeling snow accumulation. It has also been used in wildlife home ranges (Anderson et al., 2005), in soil moisture (Lookingbill and Urban, 2004). In the crime management (Ceccato et al., 2002, Malczewski and Poetz, 2005, Bennell and Canter, 2002, Osgood, 2000), and in non-point pollution risk in North Carolina (Potter et al., 2004).There have been applications in spatial demography to put right space in respect of visualization in map to sophisticated spatial statistical methods that cast around to expound why a particular spatial pattern is observed. These applications offer the unique chance to revisit old issues in demography and revitalizes momentous facts for the design and evaluation of realistic public policies (de Castro, 2007), this therefore, makes this study timely and went in line with Tobler’s assertion in his first low of geography where he advocated the similarities of closer phenomenon on space than those that are far away from that particular location (Tobler, 1970).
2. Materials and Methods
2.1. Data
- The Nigerian population and housing census data was used in this study, a total of 28,197,085 households were surveyed. There are six conventional methods of solid waste disposal as reported by NPC (2009), these include;a- Solid waste collected in polythene bagsb- Solid waste buried by householdsc- Solid waste in public approved dump sitesd- Solid waste in unapproved dump sitee- Solid waste burnt by householdsf- Other unidentified methodsWe classified these methods in to Environmentally Friendly Waste Disposal Methods (EFWDM) and Non-environmentally Friendly Waste Disposal Methods (NEFWDM). The NEFWDM methods constitute 60.30% of the total households comprising Buried waste, Un-approved dump sites, Burnt waste, and Other method. The EFWDM make up 39.70% of the total households to cover Collected waste and Approved dump sites clearly shown on Figure 1 below;
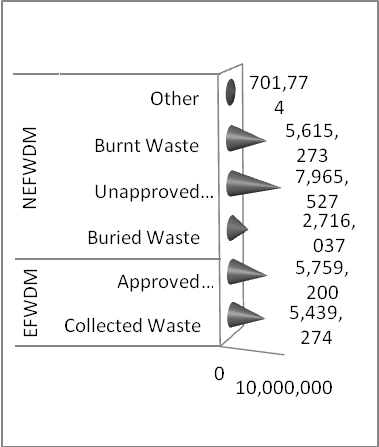 | Figure 1. Solid waste Disposal Methods |
2.2. Methods
2.2.1. Multiple Regression Model
- Multiple regression models are the methods preserved in this study that remained to predict and explain the variation of a single dependent variable y from a number of independent variables or predictor variables (Wheeler et al., 2013). The total number of households in each state under study is the dependent variables used while NEFWDM are termed the independent variables. IBM SPSS 20 software was used, thus the model propound is in the form of the following equation;
 | (1) |
2.2.2. Analyzing Pattern
- a- Getis-Ord General G Statistics:- This is a hot spot analysis to evaluate clustering of NEFWDM solid waste disposal methods across the Nigerian states in to Low Risk States, Medium Risk States and High Risk States. It is given in equation 2 below;
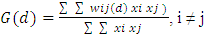 | (2) |
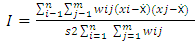 | (3) |
3. Results and Discussions
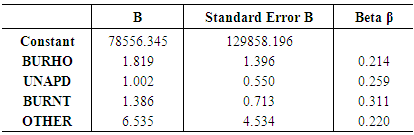
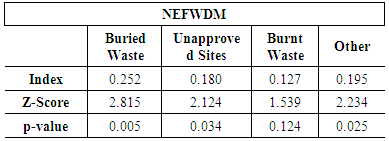
- The multiple correlation coefficient R which measure the quality of the prediction of the dependent variable “households at risk” reveal a value of 0.735, this figure gives a good level of prediction. The coefficient of determination R2 which is the proportion of variance in the dependent variable “households at risk” that can be explained by the independent variables “NEFWDM”, has R2 value of 0.541 as suggested in the model summary. The independent variables hence, explained 54.1% of the variability of our dependent variable.The F value F=9.427 suggest improvement due to fitting the regression model is much greater than the inaccuracies within the model since the value is >1 hence, it is very unlikely to have happen by chance. The final model therefore, significantly improves our ability to predict the outcome variable. The result of coefficient (b) in Table 1 which indicates individual contribution of predictors to the model, revealed a positive relationship between predictors and the outcome, as the number of households using NEFWDM increases, number of households at risk increases. The standardized coefficient β shows that BURNT β=0.311 has slightly more impact in the model followed by UNADP β=0.259, OTHER β=0.220 and BURHO β=0.214 respectively. The final model is therefore shown in equation 4 below;
 | (4) |
|
3.1. Why Households at Risk of Using “NEFWDM”?
- Solid waste disposal is inexorable human activity as a result of his dynamic socio-economic and cultural striving interactions for survival. Waste generation can be rooted from the rapid population growth, industrialization, per capita income and urbanization (Okeniyi and Anwan, 2012). In Nigeria, solid waste disposal has been a challenging health and environmental concerns. Solid waste disposal differ at a spatial scale, it differs from developed to developing countries, urban to rural communities, residential to commercial and industrial locations. The percentage of households patronizing NEFWDM in Nigeria outnumbers those patronizing EFWDM by 21.4% which is more than six million households. These methods dearth air and water pollution control, therefore households opt to burnt their solid waste generated, buried on any bare land at their disposal, dump in an unapproved locations or use any other method they feel convenient at that moment. In the long run, these resent the insinuation that, it turns to flies breeding sites, attractive locations for vermin as well as promoting waste/used materials picking and scavenging behavior which is becoming prominent among rural youths for lively hood in Nigeria and in many developing poor countries.The final consequence of these incidents depicted above is the outbreak of varied diseases. These flies are vector insects they transmit bacterial diseases from one location to another, causing diarrhea, cholera e.tc. In event of rain fall, the waste is transported and dumped in to available open water sources common in rural Nigeria, this lead to water adulteration. This has great health implications in 1991 for example the world deaths as a result of cholera were 14,400 out of which half occurred in Nigeria (Wisner et al., 2008). Cholera is believed to happen largely due to drinking of contaminated water. The rate of youth engaging into waste/used materials picking is alarming, they do scavenge from one waste dump site to the other mostly in search of scrap metals, in so doing they served as agents of transporting bacterial diseases to their various households. They are subjected to vulnerable risk and rarely attend schools.
3.2. Spatial Pattern of “NEFWDM” Distribution
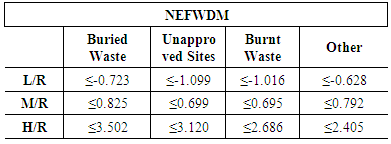
- A hot spot analysis Gi* statistic was run using ArcGIS 10.1 software and the result returned for each predictor in the NEFWDM a z-score value. The statistically significant positive z-scores, the larger the z-score is, the more intense the clustering of high values (hot spot). The statistically significant negative z-scores are, the smaller the z-scores are, and the more intense the clustering of low values (cold spot). We classified the hot spot states in to low risk states, medium risk states and high risk states taking cognizance the quantities of Gi* Z-Score values and how statistically significance they are. Table 2 below portrays the Gi* Z-Score values for each predictor in NEFWDM;
|
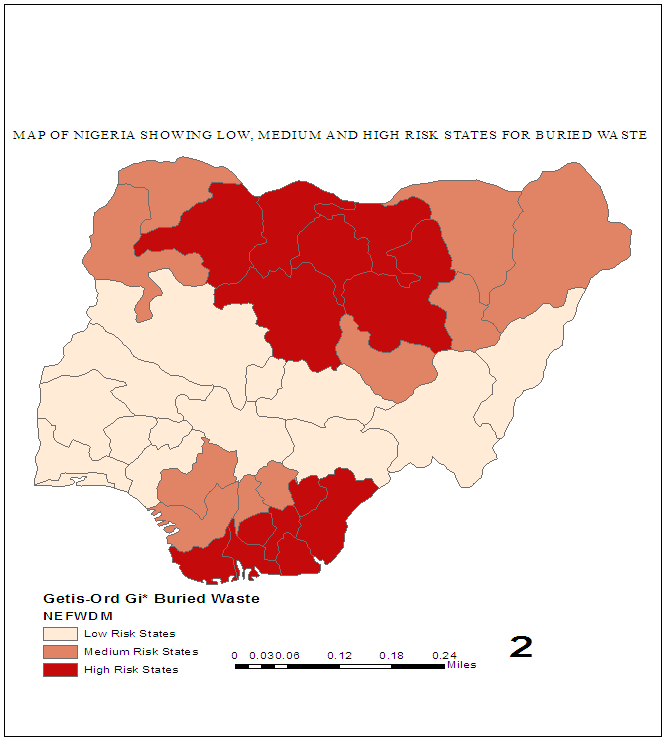 | Figure 2. Getis-Ord Gi* Buried Waste |
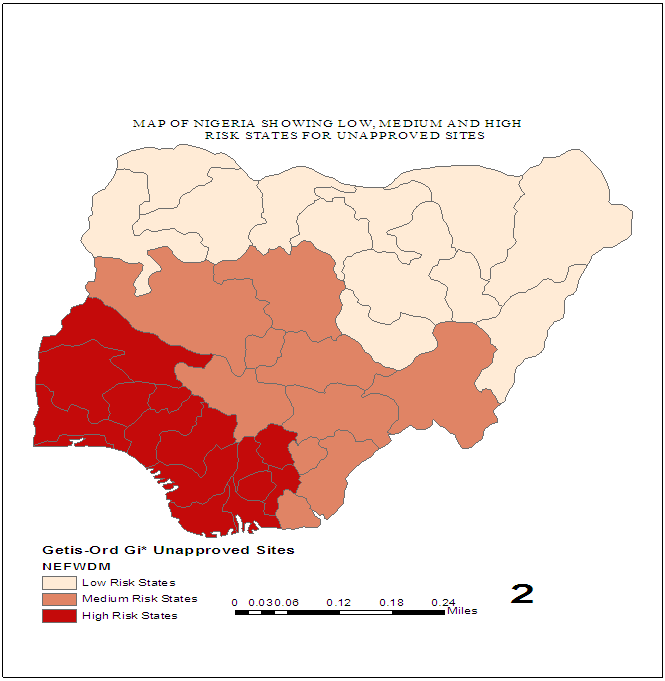 | Figure 3. Getis-Ord Gi* Unapproved Sites |
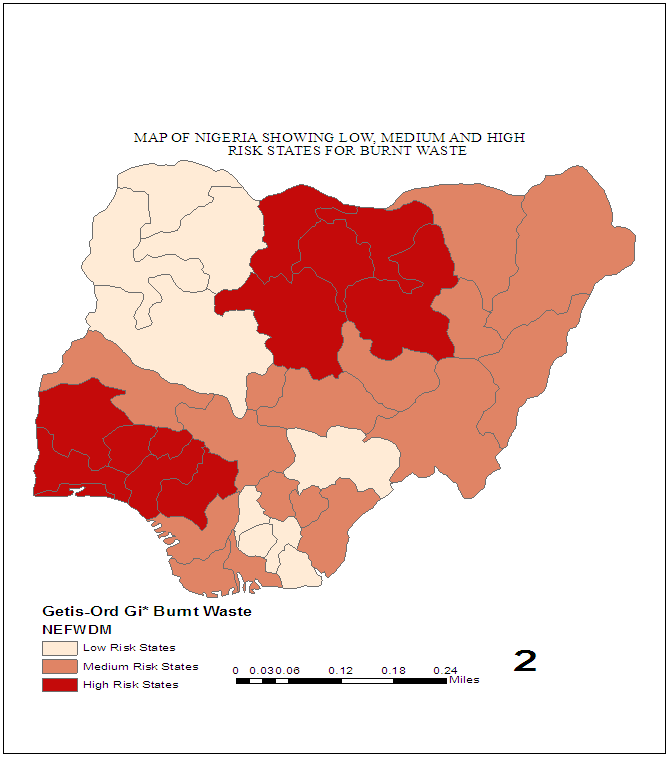 | Figure 4. Getis-Ord Gi* Burnt Waste |
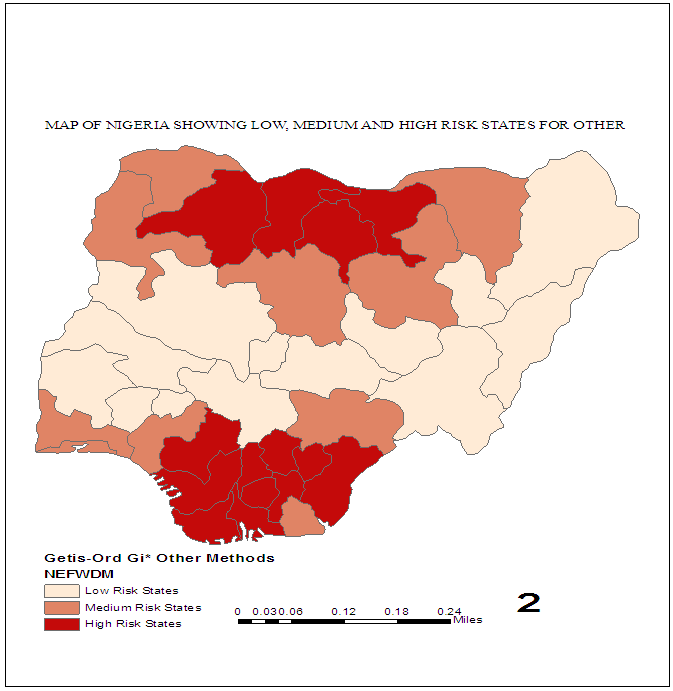 | Figure 5. Getis-Ord Gi* Other Methods |
|
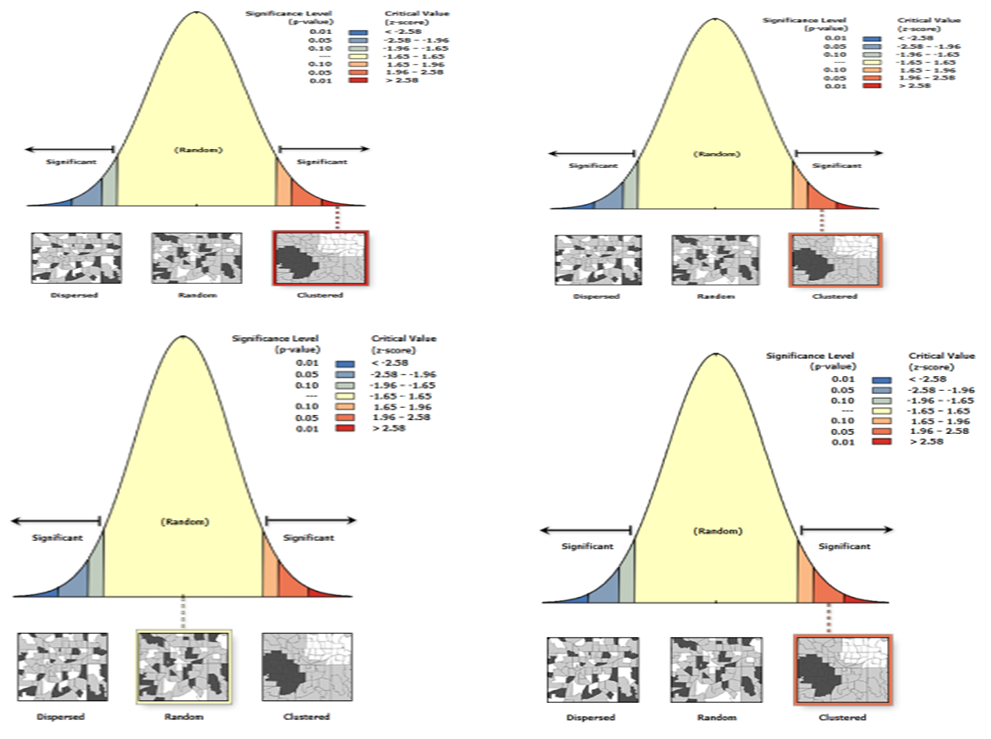 | Figure 6. Spatial Autocorrelation (Global Moran’s I) Clusters |
4. Conclusions
- This study focus on analyzing the spatial distribution of conventional solid waste disposal methods across Nigeria through prediction of risk prone states by using multiple regression model and display of spatial distribution pattern of (NEFWDM) among Nigerian states using GIS pattern analysis to bridge unresolved issues because, researches in the area of geo-spatial demography (GSD) are much smaller than should be. Though studies were conducted to look in to spatial reference data for geo-demographic analysis, the location of social infrastructures, decision making processes in solving problems of provision and distribution of products and services to mention but a few. There are also researches with basis on spatial variability that are limits to natural causes omitting socio-economic operations which could result to posing hazard in the societies. It is interesting researchers utilizes the benefit of geo-demographic-spatial data in analyzing tertiary education institutions clustering in a particular sub-national regions with no cognizance to population size in some developing countries.The R value of 0.735 suggest a good level of model’s prediction, R2 value of 0.541 shows the dependent variables NEFWDM explained 54.1% of the variable of households at risk (the dependent variable). F value of 9.427 suggests improvement due to fitting the regression model is much greater than the inaccuracies within the model F>1, it is very unlikely to have happen by chance. As the number of households using NEFWDM increases, number of households at risk increases. The Getis-Ord Gi* suggest states with high risk of vulnerability to communicable diseases for each predictor variable in NEFWDM. These states are visually found clustered across six geo-political zones of Nigeria. Moran’s I spatial association suggest the rejection of Ho of complete spatial randomness (CSR) for buried waste p<0.01, for unapproved waste and other p-<0.05. Null hypothesis for burnt waste has to be accepted p>0.10, it exhibited a random clustering.This research will be good resources for disaster managers especially in the pre-disaster phase, environmental management and health and sanitation controls. It has implication also in authorities’ budgetary provisions. This research reduced to methods of solid waste disposal, there is little known in terms of type of waste generated, if it contains hazardous or nonhazardous materials, we recommend further studies to foster identification of hazardous materials and their respective sources. Provision of adequate sanitary solid waste disposal methods such as collected in polythene bags and government approved dump sites has to be promoted, mass public awareness should also be encourage among households about possible risk of persistence adoption of NEFWDM.
ACKNOWLEDGEMENTS
- We wish to acknowledge the following for their contribution towards development of this article;1- Tertiary Education Trust Fund, Nigeria for providing funds.2- Professor Badamasi Lawal Charanchi, S.A High Education Katsina State, Nigeria for giving general support.3- Department of Geography, Federal University Dutsinma, Nigeria for technical help.