-
Paper Information
- Paper Submission
-
Journal Information
- About This Journal
- Editorial Board
- Current Issue
- Archive
- Author Guidelines
- Contact Us
American Journal of Geographic Information System
p-ISSN: 2163-1131 e-ISSN: 2163-114X
2018; 7(1): 1-14
doi:10.5923/j.ajgis.20180701.01

The Spatio-Temporal Pattern of Urban Green Spaces in Southern Ethiopia
 Abstract
 Reference
 Full-Text PDF
 Full-text HTML
Mikias Biazen Molla1, 2, C. O. Ikporukpo3, C. O. Olatubara4
1Pan-Africa University, Life and Earth Sciences Institute (including Health and Agriculture) University of Ibadan, Ibadan, Nigeria
2Hawassa University, Wondo Genet College of Forestry and Natural Resources, Shashemene, Ethiopia
3Department of Geography, University of Ibadan, Ibadan, Nigeria
4Department of Urban and Regional Planning, University of Ibadan, Ibadan, Nigeria
Correspondence to: Mikias Biazen Molla, Pan-Africa University, Life and Earth Sciences Institute (including Health and Agriculture) University of Ibadan, Ibadan, Nigeria.
| Email: |  |
Copyright © 2018 Scientific & Academic Publishing. All Rights Reserved.
This work is licensed under the Creative Commons Attribution International License (CC BY).
http://creativecommons.org/licenses/by/4.0/

Global population has become increasingly concentrated in urban centres, as a result, the quality of the urban environment is being deteriorated. Human interferences are accountable for spatial pattern changes of green spaces in cities/towns. This paper analyses the spatio-temporal pattern changes of green spaces in Southern Ethiopia using geospatial analysis tools. In Hawassa the spatial coverage of green space was 30% in 1975 but decreased to 12% in 2015. While in Wolayita Sodo town it was 53% in 1975 and decreased to 24% in 1995, but it increased to 33% in 2005 and again decreased to 29% in 2015. In Bodity town it was 48% in 1975 and 23% in 1995, but it increased to 25% in 2005 and 30% in 2015. Accordingly the ANOVA result there was overall significant (p= 0.003) difference in the spatial coverage change of green space among urban centres. Similarly, there was a significant difference in between Hawassa and Bodity (p = 0.007) and Bodity and Wolayita Sodo town (p = 0.005), but no difference between Hawassa and Wolayita Sodo town (p = 0.974). Expansion of urban centres, population growth, natural hazards (drought), lack of policy that supports the conservation of green space and lack of awareness were the main causes of the change of green space over time. The change varied, depending on the structure of the urban centres development. Proper spatial planning and its conversion into action is an important tool in improving urban green infrastructure.
Keywords: Urban Green Space, Spatiotemporal patterns, Geospatial tool, Southern Ethiopia
Cite this paper: Mikias Biazen Molla, C. O. Ikporukpo, C. O. Olatubara, The Spatio-Temporal Pattern of Urban Green Spaces in Southern Ethiopia, American Journal of Geographic Information System, Vol. 7 No. 1, 2018, pp. 1-14. doi: 10.5923/j.ajgis.20180701.01.
Article Outline
1. Introduction
- As a result of urbanization, the world’s population has become increasingly concentrated in cities or towns. Rapid urbanization worldwide has become a critical issue in the 21st century [1, 2]. The world urban population is expected to increase by 84% from 3.4 billion in 2009 to 6.3 billion in 2050 [3, 4]. The number of mega-cities has significantly increased since 1970, with the newest ones emerging in developing countries [5]. Large cities are reaching human saturation levels, and are unable to cope with diverse types of human-induced pressures [6]. Urban development involves the replacement of vegetated landscapes with impermeable surfaces; this process can exert profound influences on the biogeochemical cycle, hydrological process, climate change, and biodiversity in terrestrial ecosystems at multiple scales [7, 8]. Urbanization and population growth significantly influence the functioning of the local and global ecosystem and the services [9]. As [10] reported that urban development fragments, isolates and degrades natural habitats; disrupts hydrological systems, and modifies energy flow and nutrients cycling. Urbanization has had and continues to have a negative impact on the natural environment (green space) within cities [11]. Most impacts can be mitigated by restoring some components and functions of natural ecosystems in urban areas, through careful design of urban green spaces, semi-natural landscape and preserving wilderness in some valuable natural habitats near the city [9, 12]. In this regard, urban green spaces are one of the fundamental components in the restoration and management of healthy urban ecosystem. Urban green spaces have significant social, ecological, and cultural value. Several studies have demonstrated that urban green spaces offer benefits relating to individuals’ health and wellbeings such as relaxation [13, 14], recreational opportunities [15, 16], and a connection to nature [13].Urban green spaces can be defined as outdoor places with significant amounts of vegetation, and exist mainly as semi-natural areas [17]. Studies conducted by [18] and [19] stated that urban green spaces are viewed as the last remnant of nature in urban areas [20]. Similarly, several studies such as [21-23] revealed that urban green space typically performs important functions, including maintaining biodiversity, preventing soil erosion and mitigating urban heat island effects. Urban green spaces can also provide various multi-functional social economic and cultural benefits, such as providing amenity-recreation venues, improve cultural heritage values, reducing work-related stress [24, 25], and increasing property values [26, 27]. Studies have shown that urban green spaces are key components of ecosystem services that evidently contribute to the mitigation of high temperatures [28, 6], reduction of air and noise pollution [29]. Urban green spaces encourage outdoor activity and social communication that contribute to the health of local residents. Spatio-temporal analysis has become an important tool to generate evidence for decision-makers, spatial planners, local communities, or actors who are operating within a given landscape to formulate appropriate policies and strategies, generate data for spatial planning, and develop detailed land use plans as well as understand agents of change [30]. Examining the relationship between the use of urban green spaces and factors influencing their utilization can provide essential references for green space site selection in urban planning [14]. Hence, spatio-temporal analysis helps decision-makers ensure sustainable development and understand the dynamics of the changing environment [32]. The current debate on the importance of the urban landscape approach requires sufficient spatial data on the past and present conditions of green spaces in the urban centres to continue to successfully manage the urban environment. Therefore, information on spatial and temporal analyses of green spaces becomes essential in order to improve the urban green spaces planning in the urban centres. Various researchers assessed the interaction between population and urban expansion in Ethiopia, but most of the authors missed the temporal aspect and their focus varying greatly in terms of thematic area as well as spatial locations [33-35]. Besides, countrywide, particularly in the study area, the spatial pattern change of green spaces and its driving forces did not clearly assess [36]. As a result planners and decision makers did not consider the provision of green space for urban ecosystem services on their action plan [37]. Therefore, this study was were covering the distribution of green space coverage using in the case study area. The specific objective of the study was, therefore, to analyze the spatial patterns change of green space between 1975 and 2015 using geospatial analysis techniques and identify major driving forces of the change of green spaces.
2. Materials and Methods
2.1. Description of the Study Area
- This study was conducted in three different sized urban centres, these include; Hawassa, Wolayita Sodo and Bodity town. The selection was done in consultation with the Regional Sanitation and Beautification Park Administration and Development Office. Hawassa city is the capital city of South Nation and Nationalities Peoples (SNNP) Regional State one of the selected case study areas. The city is located between 37° 521 - 39° 11’ East longitude and 06° 27' - 07° 40’ North latitude with an elevation of 1708 meters above sea level (Fig, 1). It is found at a distance of 275km far from Addis Ababa (capital city of Ethiopia) in the South part of the country, within the rift valley depression bordered by Lake Hawassa to the West. According to [38] report, Hawassa city accommodates 210,676 inhabitants. It covers 50.24 square kilometres, divided into eight sub-cities and each sub-city further divided into kebeles. Figure 1 shows the location of the selected case study in urban centres in the region. The land use of the study area includes approximately 19.27% for residential area, 20.20% for transportation (road), 7.06% for commercial area, 2.10% for institution, 12.20% for social services area, 5.74% for production and sailing area (marketing) area, 16.4% for green infrastructure (trees and forest) area, 4.03% for mixed-use services area, 13.10% for other services area [39]. The study area has a variety of tree and forest resources such as coniferous and broad-leaved (reserved) forest that are distributed according to its environmental condition.
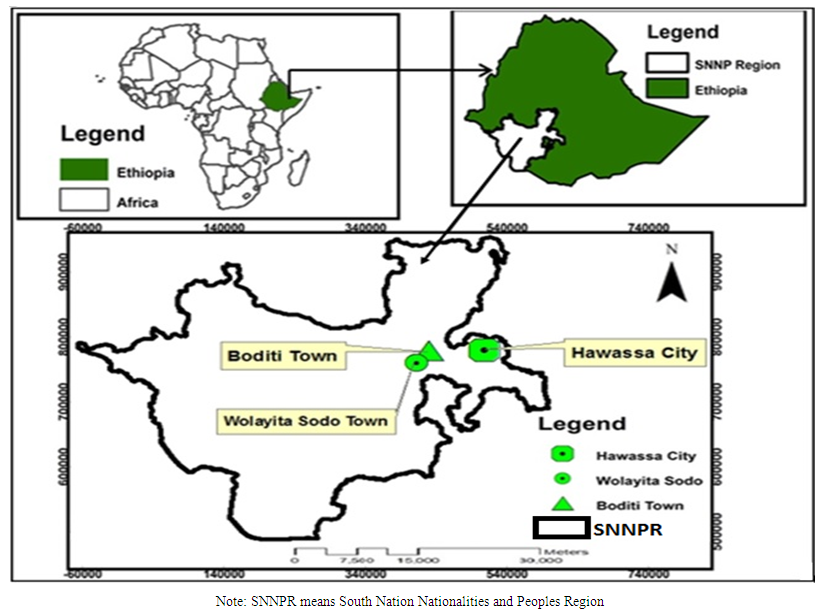 | Figure 1. The Location of Sample City/Towns, Source: Author |
2.2. Methods of Data Collection
- Most of the spatial data were obtained from secondary data sources through purchasing from the Ethiopian Map Agency (EMA) and downloading cloud-free images from Earth Explorer. These include; (1) 1975 landsat (resolution 30m, 7 band), 1985 landsat images (resolution 30m, 7 bands), 1995 landsat images (resolution 30 m, 7 bands), 2005 spot images (resolution 10m; 1 band), and 2015 spot images (resolution 10m; 1 band); (2) a topographic map (1:10,000) created in 2000; (3) Google Earth data were extracted from the internet; (4) urban planning data obtained from the SNNPRS urban development and planning bureau and census data obtained from the regional statistics bureau (auxiliary information). The Landsat program is the oldest Earth Observation Program, which was started in 1972 (Bakker et al., 2001). Landsat is very useful for detail mapping of land cover, land use, soils, and geology is worth noting [40, 30]. Dry season and cloud-free images were used since they make conducting the analyses easier. The satellite images cover 185-185 km with a spatial resolution of 30 m, i.e., a single pixel in the image represents 30-30m on the ground. The acquisition dates of the satellite images slightly differ within and between years, though the acquisition was carried out within the months of December, January, and February. ERDAS Imagine and ArcGIS 10.4 software’s were used during image processing and classification as well a production of the final LULCC maps. The land use and land cover change analyses followed standard procedures (Figure 1). Ground control points (GCPs) were also acquired from field surveying using a handheld GPS. The GCPs data were used for image classification accuracy assessment.
2.3. Image Processing
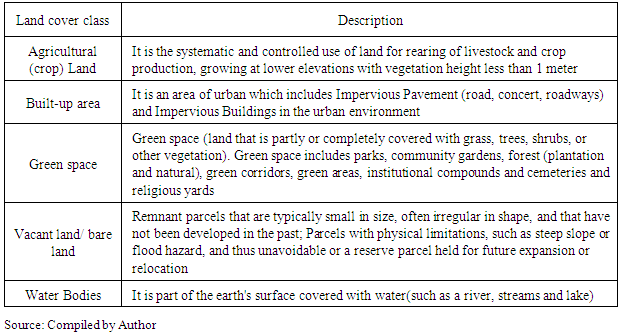
- To obtain urban green space information for the five decades (1975, 1985, 1995, 2005 and 2015) the Landsat and spot images were used. The images were rectified and georeferenced to the Universal Transverse Mercator (UTM) 37N coordinate system by using the Earth Resource Data Analysis System (ERDAS) Imagine system (Version 10.1). The major image processing steps undertaken were layer stacking, re-sampling, and image enhancement of the image dataset, which are of utmost importance for LULC analyses. Layer stacking is a technique to build a new multi-band or multispectral image file from geo-referenced images of various pixel sizes, extents, and projection system. Secondly, the re-sampling operations were conducted to reduce positional inaccuracies which stem from the geometric instability of the satellites during the data acquisition [41]. The coordinates of each output pixel were used to calculate a new value of close-by pixel values in the input map using the nearest neighbour re-sampling method [42]. Image enhancement makes raw image readily interpretable for a particular application [40]. False colour composite, edge enhancement and linear stretching were applied for the improvement of image interpretability [40, 43]. After all the images were corrected in the same way, the corrected satellite images were also clipped by the boundary of the study area using in ArcGIS V.10.5 spatial analysis tools and images were ready for classification purpose.A total of five land use and land cover classes were identified in all images representing the years under investigation in a consistent manner. These include agricultural land, built-up area, green space, and vacant/open land and water bodies (Table 1).
|
 | (1) |
2.4. Accuracy Assessment
- Image classification is based on samples of the classes. Hence, the quality should be checked and quantified [4]. A total of 220 GCPs was used, to verify and assess the accuracy of the final classification. Accuracy assessment is a measure of similarity of an estimate of the true value [42]. Accuracy was determined by superimposing the points on the classified image and obtaining the kappa coefficient. According to [45], the recommended standard of accuracy in the identification of the LU/LCC mapping from the remote sensor data should be 85% - 90%. The other information in accuracy assessment is a kappa coefficient (Kc) which is an estimate of the overall agreement between image data and the reference (ground truth) data. According to [46] and [47], kappa values are classified into three groups: a value greater than 0.80 strong agreements, a value between 0.40-0.80 represents a moderate/good agreement and a value below 0.4 represents a poor agreement. Therefore, kappa coefficient is calculated using the following formula.
 | (2) |
2.5. Data Analysis
- Geospatial analysis tool was used to analyse, present and interpret the spatial pattern of green spaces in the case study area. A one-way analysis of variance (ANOVA) was used to test the difference between the means of three case study areas spatial pattern changes of green space. Differences were deemed significant at P (0.05). Analyses were performed using the Statistical Package for Social Sciences (SPSS) version 21. Qualitative data was used to support the discussion of results.
3. Result and Discussion
3.1. Spatial Distribution of Green Space in Hawassa City (1975-2015)
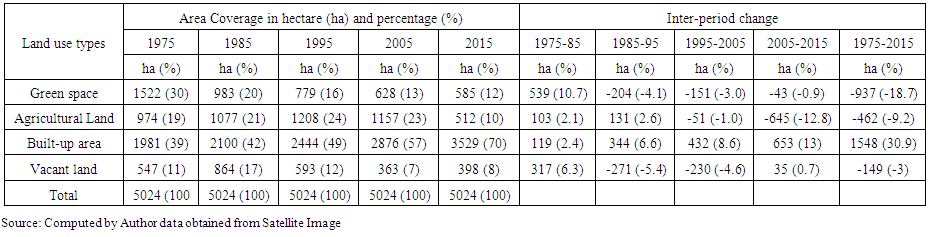
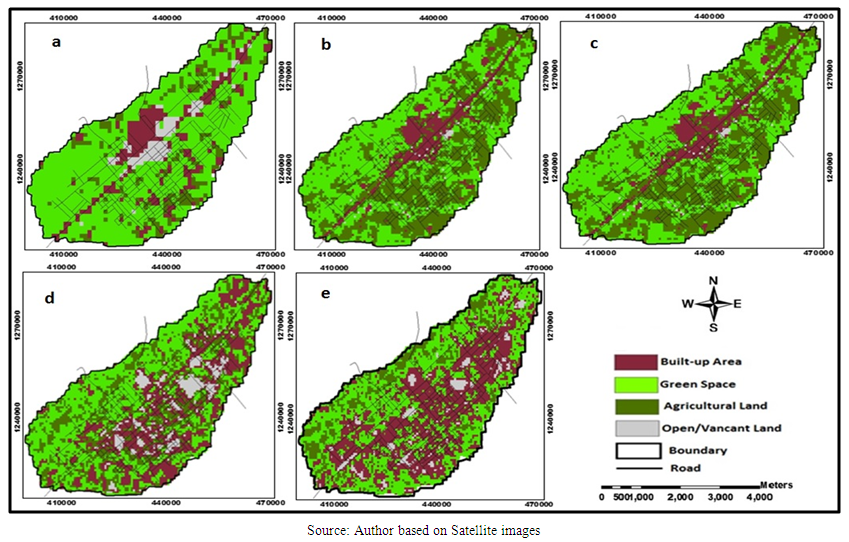
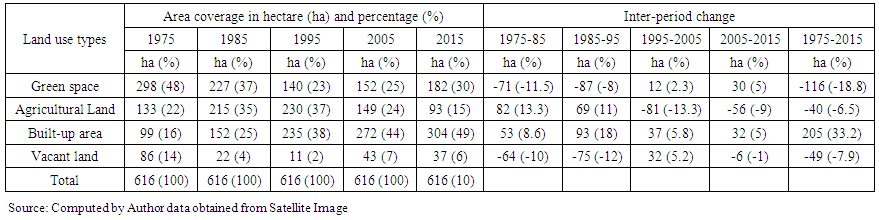
- As shown in Figure 2, there was only one single urban centre clustered in the North-Western and South-Western with scattered development in 1975. The spatial coverage of green space was 1,522 hectares (28%) of land from the total area 5,024 hectares (Table 2). The spatial distribution of green spaces in 1975 analysis was more prevailing in the periphery of the city. Similarly, the Northern and North-Eastern parts of the city have large area coverage of green spaces (Figure 2). On the other hand, along with the Lakeshore of Hawassa, South, South-Western, and South-Eastern parts of the city have good green space coverage than other parts of the city. The detailed spatial distribution of green space in 1975 illustrated in Figure 2, while the temporal parts presented in Table 2. The spatial distribution of green space in 1985 shows a decreasing trend as compared to 1975. As illustrated in Table 2, the coverage of green space was 983 hectares (20%), this indicates that green space coverage decreased by 539 hectares (10.7%) from 1975. Similarly, the built-up area covered 2100 hectares (42%), agricultural land 1077 hectares (21%), and open/vacant land 864 hectares (17%).
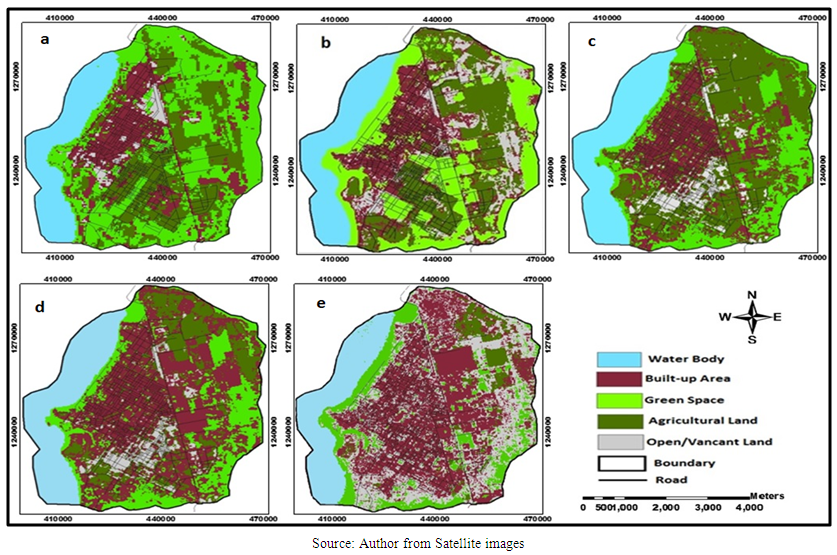 | Figure 2. The spatial distribution of green space in Hawassa, 1975-2015, (a = 1975, b = 1985, c =1995, d = 2005, and e = 2015) |
3.1.1. Spatio-Temporal Changes of Green Space in 1985-1995 Period
- As illustrated in Table 2, the spatial coverage of green space in 1985 was 983 hectares (20%). The spatial distribution was relatively concentrated at the edge of Lake Hawassa, central and South-East edges of the city. However, in 1995, the total area coverage of green space was 779 hectares (16%) and its declines by 4% as compared to 1985. The coverage of green spaces evolved to become smaller patches/areas, as reflected by a continuous reduction in green space size and increase in patch number. They both indicated an acute problem of habitat degradation and urban encroachment.
 | Table 2. Area and proportion of Green space and other land use in Hawassa, 1975-2015 |
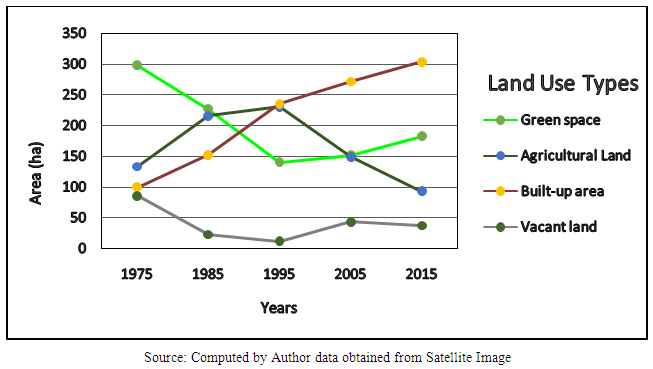
 | Figure 3. Green space and other land use changes in Hawassa during 1975–2015 |
3.1.2. Spatial-temporal Changes of Green Space in 1995-2005 Period
- Based on the analysis result of 1995 image, the majority of the green spaces and open land had been converted into other land use types such as urban settlement and agricultural land (Figure 2). Similarly, in 2005 the reduction and transformation of green spaces into other land use progressively continued, especially green spaces found along the lakeshore and central parts of the city which were completely replaced by settlement and other urban services. In 2005 the spatial coverage of green space was 628 hectares (13%), it decreased by 3% as compared to the 1995 areal coverage (Figure 3). In 2005 the spatial distributions of green space showed the slight difference from the overall green space distribution of the area. In the 2005 image analysis result, South, South-Western, and South-Eastern parts of the city had good green space coverage than other parts of the city. Similarly, in a linear approach along the lakeshore, there was also undisturbed green space. The other changes observed in 2005 were the reduction of agricultural land and open/vacant land. In this year (2005) agricultural land decreased by 51 hectares (1.0%) and open/vacant land decreased by 230 hectares (4.6%) in 2005. However, in this year built-up area has shown very high incremental change; it increased by 432 hectares (8.6%) (Figure 3).
3.1.3. Spatial-temporal Changes of Green Space in 2005-2015 Period
- A comparison of data from 1975-2005 indicates that there was significant overall urban green space reduction in Hawassa city at different rates. The different rates of changes in urban green space and other land use were attributed to the expansion of agriculture and ongoing urbanisation process (Figure 2). In 2015, the area coverage of green space was 585 hectares (12%), this means it decreased by 43 hectares (0.9%) from 2005 In this year (2015) agricultural land showed a very high decreasing change; it decreased by 645 hectares (12.8%). Built-up area and open/vacant land increased by 653 hectares (13%) and 35 hectares (0.7%) respectively (Figure 3). In 2015 the spatial distribution of green space was very dispersed across the city. Majority of the green spaces in South, South-Western, and South-Eastern parts of the city were replaced by open/vacant areas. However, green space along the lakeshore, South and South-Eastern parts of the city were maintained. In addition, the city administration was conducting some conserve and management activities on the existing forests and green spaces along the lakeshore of Hawassa (Figure 2).In general, as illustrated in Figure 3 and Table 2 green spaces showed downward trends in the last 40 years (1975-2015). Green space decreased from 1522 hectares (30%) in 1975 to 585 hectares (12%) in 2015; it decreased by 937 hectares (18.7%) in between 1975-2015. Similarly, the agricultural and vacant land showed an overall decreasing trend in the last 40 years in Hawassa city. Agriculture decreased by 462 hectares (9.2%) and vacant land also decreased by149 hectares (3%). However, built-up area showed a dramatic increasing trend, and it increased by 1548 hectares (30.9%) in the last forty years (1975-2015).
3.2. Spatial Distribution of Green Space in Wolayita Sodo Town (1975-2015)
3.2.1. Spatial Distribution of Green Space in 1975-1985 Period
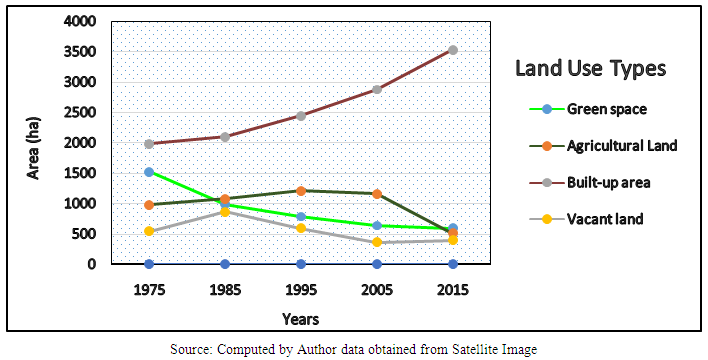
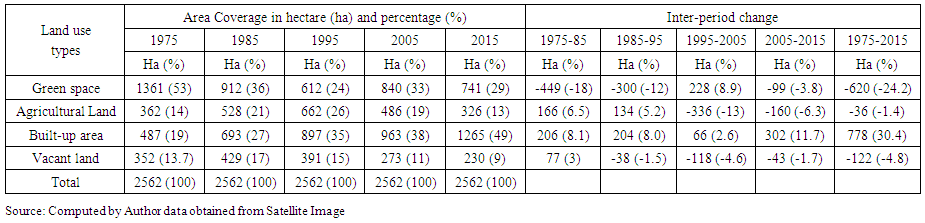
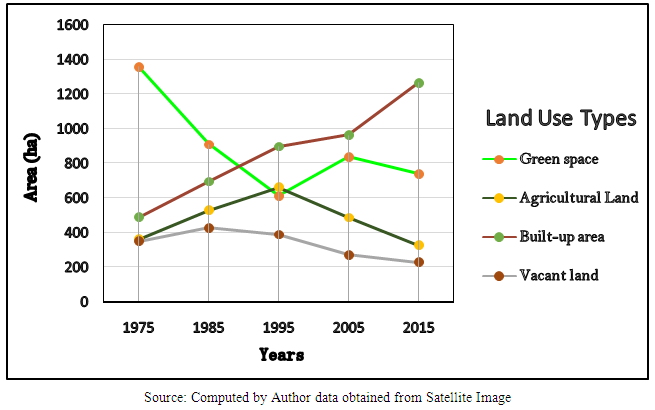
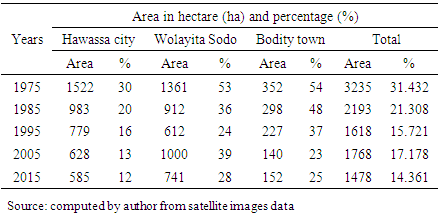
- In 1975, green space had the highest percentage area coverage and largest patches over the total area of the landscape in Wolayita Sodo town. The total area coverage of green space was 1361 hectares (53%) in 1975. The spatial distribution of green space was more dense and undisturbed in North-Eastern and South-Western parts of the town (Figure 4). During this year (1975) the natural and human interference was very low (Figure 4). While the coverage of agricultural land was 362 hectares (14%), built-up area was 487 hectares (19%), and open/vacant land 352 hectares (13.7%) (Table 3).
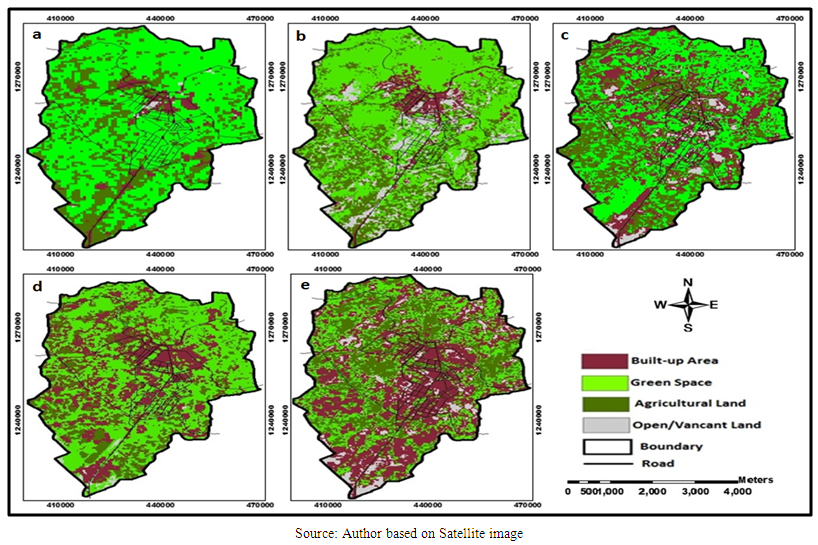 | Figure 4. Spatial distribution of green space in Wolayita Sodo, 1975-2015, (a = 1975, b = 1985, c =1995, d = 2005, and e = 2015) |
 | Table 3. Area and proportion of Green space and other land use in W-Sodo, 1975-2015 |
3.2.2. Spatial Distribution of Greenspace in 1985-1995 Period
- A study conducted by Shibru and Kifle (1998) revealed that the occurrence of massive drought in 1985 across the country including the case study area devastated green space and agricultural practices in the country. As a result, the coverage of green spaces was shifted into a vacant/open area with no vegetation. In 1995 the spatial coverage of green space was 612 hectares (24%), and it shows very high decreasing trend from 1985. As illustrated in Table 3, due to the expansion of agricultural land and town, the spatial coverage of green space and open/ vacant land decreased by 300 hectares (12%) and 38 hectares (1.5%) respectively.Similarly, agriculture and built-up area showed an increasing trend by 134 hectares (5.2%) and 204 hectares (8.0%) respectively (Table 3). In 1995 green space in the Northern, North-West and North-Eastern parts of the town has good and undisturbed coverage. However, the spatial distribution of green spaces in the South-West and South-Eastern parts s of the town shown a decreasing trend in 1995 as compared to 1985 (Figure 5). The transformation of green spaces into other land uses from 1975 to 1985 can be observed in Figure 4 and Table 3. Majority of the green spaces in South-Western and South-Eastern parts of the town was converted into agricultural land and built-up area or settlements. In between 1985 and 1995, the wider coverage of green areas was sub-divided into various smaller pieces of green areas.As illustrated in Figure 4, disintegrations of green spaces increased and resulted in a smaller parcel of green areas in the town. On the other hand, in 1995 vacant/open area was decreased by 38 hectares (1.5%) and shifted into agricultural land and built-up area. According to [50] report, in between 985-1995 there was a drought that all over the country including the study area, which caused have facilitated the expansion of open/vacant land.
3.2.3. Spatial Distribution of Green Space in 1995-2005 Period
- In order to rehabilitate the degraded land, the town administration conducted massive tree planting and implemented environmental conservation programmes in and around the town starting from 2003. Hence, in 2005 the spatial coverage of green space showed an increasing trend as compared to 1995. Overall green space increased from 612 hectares (24%) in 1995 to 840 hectares (33%) in 2005. The Northern, Northeastern, North-Western, and South-Eastern parts of the town were covered by dense green spaces (Figure 4). On the other hand, agricultural land and open/vacant land decreased by 336 hectares (13%) and 118 hectares (4.6%) (Figure 5). Most of the open/vacant land was converted into vegetation and grasses. While built-up area increased by 66 hectares (2.6%) and caused for the reduction of agricultural land in the town.
 | Figure 5. Green space and other land use changes in Wolayita Sodo during 1975–2015 |
3.2.4. Spatial Distribution of Green Space in 2005-2015 Period
- In 2015 the spatial coverage of green spaces showed a decreasing trend as compared to 2005. Poor management and conservation activities and lack of attention were the main reasons for the reduction of green space in 2015. Especially, green spaces in the Northern and North-Eastern parts of the town showed a dispersed distribution (Figure 4). In 2015 the total area coverage of green space was 741 hectares (29%), this means that it decreased by 99 hectares (3.8%). Similarly, agricultural land and open/vacant land also decreased by 160 hectares (6.3%) and 43 hectares (1.7%) respectively. While, built-up area increased by 302 hectares (11.7%) and caused for the reduction of green space, open area and agricultural land in the town (Figure 5). In 2015 green space in the central and south-eastern parts of the town were extremely disintegrated and shifted into a built-up area and agricultural land. Hence, the expansion of built-up area has caused the reduction of green space across the town. In general, the spatio-temporal change of green space in the last forty (40) years (1975-2015) shown a decreasing trend. It decreased from 1361 hectares (53%) in 1975 to 741 hectares (29%) in 2015. Thus, green space declined by 620 hectares (24.2%). Agricultural land and vacant land also decreased by 36 hectares (1.4%) and 122 hectares (4.8%) respectively (Figure 5). However, built-up areas increased by 778 hectares (30.4%) in between 1975 and 2015. The main reasons for the reduction of green spaces were the expansion of agricultural land and built-up area, lack of continuous conservation, maintenance, and improper management of urban green spaces.
3.3. Spatial Distribution of Green Space in Bodity Town (1975-2015)
3.3.1. Spatial Distribution of Green Space in 1975-1985 Period
- In 1975, a large area of the town was covered with different green spaces. These include; green vegetation, shrubs, forest and grassland. The southern and central parts of the town occupied by built-up and agricultural practices in 1975 (Figure 6). In Bodity town, the green area coverage was 298 hectares (48%) in 1975, built-up area 99 hectares (16%), agricultural land 133 hectares (22%) and vacant/open area 86 hectares (14%) from the total area (616 hectares). However, as illustrated in Table 4 in 1985 the green space coverage was 227 hectares (37%). Whereas built-up area 152 hectares (25%), agricultural land 215 hectares (35%) and vacant land 22 hectares (4%). This means both green space and vacant land decreased by 71 hectares (11.5%) and 64 hectares (10%) respectively. While built-up area and agricultural land increased by 8.6% and 13.3% respectively (Table 4). Because of human interference in 1985, the coverage of green space declined and shifted into agricultural land. In 1985 green space coverage declined by 12% as compared to the year 1975. In this year (1985), green space more concentrated in the North-West and South-Western parts of the town. However, other parts of the town had disintegrated and created smaller pieces of isolated green areas.
3.3.2. Spatial Distribution of Green Space in 1985-1995 Period
- In 1995, the coverage of green space was 140 hectares (23%) and it decreased by 8%. Whereas other land uses such as built-up area and agricultural land increased by 18% and 11% respectively, but the vacant/open land was decreased by 11 percent. This indicates both green space and the open or vacant land was occupied by built-up area and agricultural land (Table 4). Green space was more concentrated in the South and South-Western parts of the town, but green spaces in the central and South-Eastern parts of the town were replaced by built-up area in 1995. This is mainly attributed to the expansion of built-up area and agricultural practices in the area. Green space cover which previously formed a continuous patch in the town had obviously retreated. Built-up area replaced the central and South-Eastern parts of green vegetation, but some isolated green areas were left behind (Figure 6).
 | Figure 6. Spatial distribution of green space in Bodity town, 1975-2015, (a = 1975, b = 1985, c =1995, d = 2005, and e = 2015) |
3.3.3. Spatial Distribution of Green Space in 1995-2005 Period
- In 2005, the Southern and North-Eastern parts of the town have relatively good green space coverage as compared to 1995. The newly emerging parcel of green areas (vegetation and green fields) is clearly shown in Figure 6. The green space coverage was 152 hectares (25%), agricultural land 149 hectares (24%), and built-up area 272 hectares (44%) and open or vacant land 43 hectares (7%). Thus, overall green space increased by 12 hectares (2.3%), built-up area increased by 37 hectares (5.8%) and open/vacant land increased by 32 hectares (5.2%), however, agricultural land decreased by 81 hectares (13.3%).The distribution of occupants/residents were relatively more concentrated in the eastern parts of the town. As a result, the distribution of green space was dispersed. On the other hand, the western parts of the town have lower population pressure and have better green spaces. In 2005, many parcels of green space were cleared and left open for various purposes (institutions settlement, open market, and residential). In this year (2005), the coverage of open or vacant land was increased by 5.2% from the total area. The study gives an excellent example of human-induced land use change; it becomes clear with the increase of built-up area (Table 4).
 | Table 4. Temporal change of green space and other Land uses types in Bodity (1975-2015) |
3.3.4. Spatial Distribution of Green Space in 2005-2015 Period
- In 2005, the spatial coverage of green space was 25%, while in 2015 the spatial distribution increased by 5% (Figure 6). In 2015, the total area coverage of green space was 182 hectares (30%), it increases by 30 hectares (5%) (Figure 7). Additionally, agricultural land covered 93 hectares (15%), built-up area and open/vacant land covered 37 hectares (6%). In 2015, the spatial distribution analysis result showed that the built-up area has the highest area coverage of 304 hectares (49%). The distribution of green space in 2015 was more concentrated in the Northern, Southwest and edge of all the boundaries of the town. However, the majority of the eastern parts of the town was covered with the built-up area; while, agriculture was intensively practised in the North-Western parts of the town in 2005.
 | Figure 7. Green space and other land use changes in Bodity during 1975–2015 |
3.4. The Spatio-Temporal Variation of Green Space Change in the Study Area
- ANOVA was used in order to test the variation of changes in the pattern of spatial pattern of green spaces in each case study area. Thus based on Table 5, information the variation of changes in the spatial pattern of green space was extracted. Therefore, the ANOVA analysis results showed that there was a statistically significant (p = 0.003) difference in the spatial pattern changes of green space coverage among the three urban centres (Table 5).
|
4. Conclusions
- This study focused on analysing the spatio-temporal pattern of urban green spaces in southern Ethiopia during the last five decades (1975-2015) and identify major driving forces of the change of green spaces. The statistical result of this study showed that there is a spatial variation in the pattern of green space in the last decades (975-2015), it is depending on the hierarchy and development of the urban centres, population pressure and structure of the urban cities/towns. This study helps to show the trend of green space changes over time and identifies the main driving forces that contribute to the changes of green spaces. It also generated valuable and baseline information required for decision makers and planners to come up with appropriate planning for the development of green infrastructure. This study could be used as an educational tool to inform the common citizen about the degradation and loss of urban green spaces in the case study area as well as in the country. This study will provide a lesson to cities and towns elsewhere, especially in the emerging towns that the destruction or loss of urban green spaces should be treated as multi-dimensional problems. In addition, the findings of this study will play a significant role in motivating the interest of other scholars, professionals, policy analysts and other stakeholders in planning, development and management of green infrastructure and related studies. Based on the spatiotemporal change of urban green spaces, it could be concluded that urban greening policies and urban expansion, population pressure, illegal settlement and lack of awareness were the main driving forces. Moreover, policies and other legal frameworks relating to green space should be developed, and practically implemented in order to rehabilitate and improve the existing green spaces in and around the urban centres.
ACKNOWLEDGMENTS
- We are grateful to the Pan-African University, African Union (AU), Addis Ababa, Ethiopia for the financial support for this study. We thank all the people who participated in this research. We are also indebted to experts from Bureau of Urban Development and Housing and Municipalities in Hawassa, Wolayita Sodo and Bodity town for allowing us to visit and carry out this study on the selected urban centres and for providing marvellous experiences. We acknowledge the three anonymous reviewers whose comments and suggestions greatly improved the manuscript.