-
Paper Information
- Paper Submission
-
Journal Information
- About This Journal
- Editorial Board
- Current Issue
- Archive
- Author Guidelines
- Contact Us
American Journal of Geographic Information System
p-ISSN: 2163-1131 e-ISSN: 2163-114X
2017; 6(5): 187-200
doi:10.5923/j.ajgis.20170605.03

Estimation of Tree Distribution and Canopy Heights in Ifakara, Tanzania Using Unmanned Aerial System (UAS) Stereo Imagery
 Abstract
 Reference
 Full-Text PDF
 Full-text HTML
Ian Asige Mweresa1, 2, Patroba Achola Odera2, 3, David Ndegwa Kuria4, 5, Benson Kipkemboi Kenduiywo2
1Regional Centre for Mapping of Resources for Development, Nairobi, Kenya
2Department of Geomatic Engineering and Geospatial Information Systems Jomo Kenyatta University of Agriculture and Technology, Nairobi, Kenya
3University of Cape Town, Cape Town, South Africa
4National Lands Commission, Nairobi, Kenya
5Dedan Kimathi University of Technology, Nyeri, Kenya
Correspondence to: Ian Asige Mweresa, Regional Centre for Mapping of Resources for Development, Nairobi, Kenya.
| Email: |  |
Copyright © 2017 Scientific & Academic Publishing. All Rights Reserved.
This work is licensed under the Creative Commons Attribution International License (CC BY).
http://creativecommons.org/licenses/by/4.0/

Tree height estimation is fundamental in forestry inventory especially in the computation of biomass. Traditional methods for tree height estimation are not cost effective because of time, manpower and resources involved. Multiple return LiDAR capabilities offer convenient solutions for height estimations though at equally increased costs. This study seeks to provide an assessment of the accuracy of Unmanned Aerial System (UAS) stereo imagery in establishing tree distribution and canopy heights in open forests as an inexpensive alternative. To achieve this, we: generate accurate 3 dimensional surface and bare earth models from UAS data and using these products; establish tree distribution and estimate canopy heights using data filters; and validate the results using ground methods. A Mavinci Sirius fixed wing Unmanned Aerial Vehicle (UAV) fitted with a 16 Megapixel camera and flying at an average height of 371 m Above Ground Level (AGL) was used to image approximately 2 km2 capturing 380 images per flight. An image overlap of up to 85% was sufficient for stereo generation at a Ground Sample Distance (GSD) of 10 cm for a flight period of 40 minutes. The stereo imagery captured were processed into orthomosaics and photogrammetric point clouds with an average point density of 23 points per square meters using Structure from Motion (SfM) techniques. Point cloud segmentation revealed tree distribution patterns in the Ifakara area, with the Near Infrared band proving useful in filtering out trees from non-vegetated areas. From the tree height estimations and with validation information from 46 sample trees yielded a correlation coefficient, R2=75%. The study highlights a simplified and cost-effective approach for generation of accurate three dimension (3D) models from stereo UAS data. With a survey grade GPS/IMU/INS for direct-on-board geo-referencing, limited controls were required which reduces the cost of the project. With the ease of varying the size of imagery overlap and flying height, imagery with improved radiometry can be obtained hence improving the determination of tree distribution, and with multi-view image matching algorithms processing of UAS imagery is made accurate and inexpensive.
Keywords: Unmanned Aerial Vehicles, Digital Elevation Model, Digital Surface Model, Canopy Height Model, Tree height
Cite this paper: Ian Asige Mweresa, Patroba Achola Odera, David Ndegwa Kuria, Benson Kipkemboi Kenduiywo, Estimation of Tree Distribution and Canopy Heights in Ifakara, Tanzania Using Unmanned Aerial System (UAS) Stereo Imagery, American Journal of Geographic Information System, Vol. 6 No. 5, 2017, pp. 187-200. doi: 10.5923/j.ajgis.20170605.03.
Article Outline
1. Introduction
- The need for estimation of tree distribution and canopy heights stems from the dynamism in forest studies and the emergence of technologies that can effectively achieve this. Forest structures however, due to their heterogeneity and density, are often difficult to assess [1]. Field data describing the height growth of trees over several decades are very scarce, consequently limiting the capacity of analysis in forest dynamics [2]. These limitations also exist in estimation of forest biomass [3] and generally in the monitoring and management of forest resources. This has been as a result of limited accurate field data and limited processing algorithms for estimating tree height and growth. Equally, tree distribution information is important in the general identification of tree locations and in determining the number of tree stands in a forest ecosystem. Tree stand delineation is important in identification and characterization of forest stand conditions in cases of infections [4]; in tree stem mapping [1] and in general determination of forest stand attributes [5]. Forest composition and vertical structure provide essential information for understanding the ecological state and processes in forest ecosystems [6] especially important for assessment of the global carbon cycle. Forest canopy height is an important structural parameter in several forest inventories and very-high-resolution digital models such as those developed using UAS data have been used to identify and quantify individual tree crowns separately using remote technology [7]. An accurate estimation of total biomass and its components including tree height, crown diameter, canopy volume and species type is critical for understanding the carbon cycle in the forest ecosystem [8], and with the high demand for structural information of forest stands in the fields of ecology and forestry [1], there is a need for accurate estimation of forest stands and related stand information as is a critical component in forest biomass estimations.There exists algorithms for Canopy Height Modeling developed by [2] for estimation of canopy heights using airborne LiDAR data and photogrammetric images. Holopainen in [9] also attempts to compare vegetation heights using datasets from Airborne Laser Scanner (ALS), aerial stereo imagery, SAR Radargrammetry and SAR Interferometry datasets; among other studies [10] [11] [12]. A fully automated local-minima algorithm using a Digital Terrain Model (DTM) and a Digital Canopy Model (DCM) derived from an airborne laser scanner was used by [13] to estimate tree heights by isolating LiDAR returns from the tree tops and at ground level. In [14] poor resolution and unknown accuracy of the DTM is noted as the major cause of residuals in the Canopy Height Model (CHM) among other factors such as errors in three dimension (3D) reconstruction of the models and canopy obstruction. From these studies, it can be concluded that the accuracy of the algorithms used in tree height estimation have highly been influenced by the accuracy of the datasets used thus indicating the need for more tests with more accurate datasets.According to the Private Native Forestry Code of Practice Guideline No. 4, there are several ways of measuring tree heights with the most accurate and efficient methods requiring costly instrumentation. These techniques involve use of metric tape measures and clinometers in combination or separately depending on user-expertise and available resources for estimating stand heights. Traditionally, tree height is assessed via labour-intensive and comparatively costly field mensuration techniques or a combination of field measurements and modelling [15]. These methods have been used and are still being used to measure tree stand heights especially in sub-Saharan Africa. However, most of these methods do not provide for convenience of taking such measurements due to cost implications in terms of time, manpower and resources involved [16].With the advent of technology especially in the field of remote sensing, convenient means of tree height measurements have been devised such as through use of RADAR [9] and LiDAR [17] technologies to establish in 3D the location and heights of trees. These technologies utilize the capability of radio and light waves emitted by an active sensor which interact with an object on the ground, with the emitted radiation being captured by the sensor as backscatter. LiDAR multiple return characteristic is essential in processing and generating 3D positions of objects on the surface.LiDAR technology has in the recent past become more popular in the analysis of forest structure and biomass [2] with DTMs and DCMs being used as the basic products with great potential for research in tropical forest ecology and management [13]. Multiple return LiDAR capabilities have been used in forestry applications in estimating ground surface and canopy heights as a fundamental measurement in forestry inventory and a critical variable in quantitative assessment of stand volume, forest biomass, carbon stocks, growth and site productivity [18]. These variables are useful in the management of forest resources and monitoring forest conditions.Use of LiDAR technology is of significance to the traditional forest inventory methods which relied on statistical sampling methods with results being derived from systematical sampling plots in forest stands. This technology overcomes most of these limitations as it offers the capability for extraction of individual tree attributes including tree location, canopy geometric volume, canopy cover and vertical profiles. Tree height information can be used to estimate forest cover volume, biomass, and carbon stores of individual trees and to compute site index and various indices of forest structure [15]. However, one major challenge for use of LiDAR technology is its limited availability mainly due to cost related constraints of purchasing and using LiDAR sensors and associated hardware and software even though they offer efficient solutions to tree inventory measurement. Moreover, LiDAR workflows have in the recent past experienced very little diversification mainly due to the market size for sensors [19]. According to the study, the lack of diversification and subsequent explosion of a variety of UAS processing packages; has fueled interest in the use of UAS in estimation of tree distribution and canopy heights.Imagery from Unmanned Aerial Vehicles (UAV) has in the recent past gained popularity in a number of applications in surveying and mapping, construction for calculation of slopes and for volumetric analysis, urban planning and zoning, and in crop monitoring applications [20] among other applications. These form of imagery provides accurate and cost effective alternative to airborne RADAR and LiDAR technologies. For instance, high resolution UAS imagery has been utilized in forestry applications for canopy height measurement which is of great interest in estimation of forest biomass and carbon stock; and in monitoring of harvests and tree recruitment [14], forest risk assessment, planning and design [21]. More specifically, UAS technology provides for agility in data collection with user defined temporal cycles necessary for observing the dynamics of forest ecosystems. The greatest asset of these images, compared to traditional remote sensing techniques such as satellite photogrammetry or LiDAR based survey, is its high spatial and temporal resolutions [14]. Automation of various aspects of data collection through Global Positioning Systems/ Inertial Measurement Systems/ Inertial Navigation Systems (GPS/IMU/INS) and Real Time Kinematics (RTK) direct-on-board georeferencing (dead reckoning) together with automated image processing algorithms effectively leverage the time between data collection and generation of output necessary for various policy implementation.Review of the current status of UAS regulations [22] show that the use of UAS has become popular despite various challenges in their application especially relating to laws and regulations regarding civilian use. Laws and regulations for use of UAS in various fields are almost non-existent for various countries around the world though some of these countries are stepping up to develop such regulations. For instance, the Kenyan Government under the Kenya Civil Aviation Authority (KCAA) has drafted the Remotely Piloted Aircraft Systems (RPAS) Regulations 2016 to guide in UAS operations in the country. Rwanda has come up with regulations to guide the use of UAS especially for supply of medical equipment across the country. Tanzania is also adopting the use of UAS in monitoring of wildlife in conservation parks in addition to its use in projects such as the GlobE Wetland Project that seeks to provide a balance between the utilization of existing scarce resources and at the same time ensuring food security. This is a positive move that would encourage UAS use in various sectors within East Africa. There are a number of benefits that UAS technology can bring to economies in Africa and around the world. This include and not limited to identification and prioritization of risk locations especially in highly inaccessible areas; reduction in vegetation and forest management costs up to 40% [23]; estimation of forest biomass; and in stand biomass estimation [7] ;estimation of forest volume and biomass [3]; monitoring emission of Green House Gases (GHG) emissions from deforestation and forest degradation [24]; predicting individual-tree height, basal area and stem volume attributes [25]; and in characterization of forest structures [26] that are all essential in forestry applications.Advancements in digital photogrammetry have provided a platform for extraction of 3-dimensional products such as DEMs, DSMs and DCMs useful in forestry applications. Consequently, forest inventory attributes are estimated more and more using point clouds and normalized surface models [9]. Airborne LiDAR has become an effective and reliable way to map terrain and retrieve forest structural parameter [27]. Canopy height models derived from LiDAR data have been applied to extract forest inventory parameters [28] though there is need for assessment of factors such as forest health, defoliation, and rate of canopy closure that are not entirely feasible from the current intermittent LiDAR surveys utilized by most forest managers [18]. There has also been little advancements in the LiDAR industry in terms of development of accessible and cost-effective means of estimation of forest parameters. On the other hand, we have witnessed an improvement in the UAS industry in terms of a cost effective survey approach in combination with very high resolution data for extraction of forest measurements, which greatly motivated this research.The accuracy of data generated from UAS would depend on various factors such as the type of camera and its spatial capabilities, the Ground Sample Distance (GSD), the average flying height of the UAV, and the size of the overlap between adjacent images. With such capabilities, a UAS offers users a cost effective, flexible and reliable means of collecting very high resolution imagery data at user-defined temporal cycles. Spectral capabilities of UAV cameras such as an additional Near Infrared (NIR) sensor enable the monitoring of tree distribution. This study uses stereo UAS imagery processed through a photogrammetric workflow to generate accurate 3D models that are used for estimation of tree distribution and canopy heights. In forestry applications, low-altitude stereo imagery from UAV can be used to characterize forest structure through a Canopy Height Model [14]. These very high resolution stereo datasets are used to generate precise 3D models products including DTMs and DSMs that form part of the inputs for generating canopy height models. The successful implementation of the methodology is useful for estimating forest growth and in assessing patterns of growth, in forest inventory and for forest planning and management. Our contribution is to generate 3D models from UAS stereo imagery and assess their accuracy in estimating tree distribution and canopy heights. To achieve this, we generate accurate 3-dimensional surface models, orthophotos and photogrammetric point clouds from UAS data in a photogrammetric workflow. The study then establishes tree distribution and canopy heights using data filters on photogrammetric point clouds generated from stereo UAS data. Finally, the accuracy of canopy height models generated from these point clouds is evaluated and the distribution and heights of trees determined.The methodology described in Section 2 discusses the various methods of 3D model extraction from UAS data through comparison with other studies. More specifically this section highlights the Structure from Motion (SfM) and the Scale Invariant Feature Transform (SIFT) techniques for feature matching and 3D modeling that are proposed for this study. This section also describes the application of the local-maxima algorithm for automatic tree detection and tree height measurement and its use with UAS imagery. Results of the study are described in Section 3 with their subsequent discussion captured in Section 4. Conclusions and future works drawn from the study are noted in Section 5.
2. Materials and Methods
2.1. Study Area
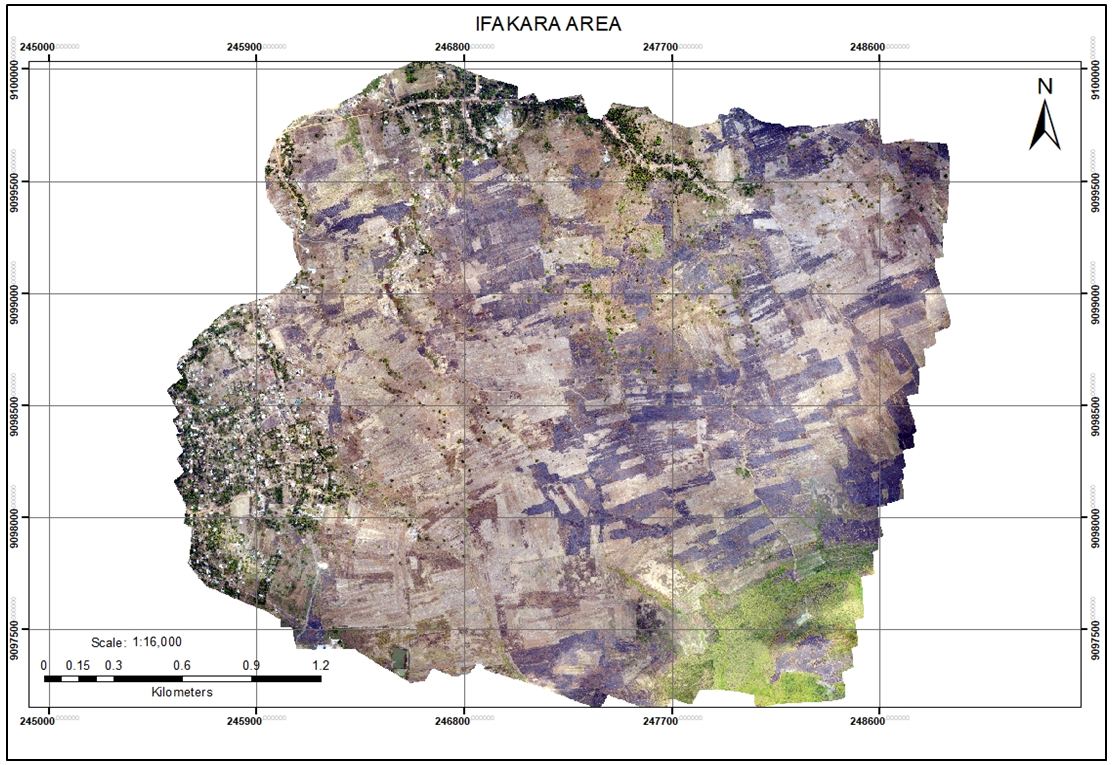
- The test area for this research is in the region of Ifakara in Kilombero district in Tanzania. Ifakara is a town center in Central Tanzania commonly known for trading activities for residents of Kilombero and Ulanga districts. The Tanzania Zambia Railway (TAZARA) traverses the region famous for agricultural activities within the Kilombero valley. The test flight area chosen for this study forms part of the larger area imaged for the GlobE Wetland Project for sustainable wetland use. The GlobE Wetland project comprises a consortium of German and East African partner institutions that seeks to reconcile food security while considering the protection of natural resources and ecosystem services in East Africa. The project areas are in Kenya, Uganda, Tanzania and Rwanda. Figure 1 is a map of the project site in Ifakara, Tanzania. The total area imaged for the project in Kilombero valley of Tanzania covers an approximate area of 16 km2 spanning through a section of the valley. The average difference in elevation is approximately 127 m with the highest point at 268 m Above Sea Level (ASL). For this study, however, a small test site of approximately 7.83 km2 was selected to optimize on image processing. The area is largely covered by scattered trees mostly the teak species that are of economic importance to the republic of Tanzania.
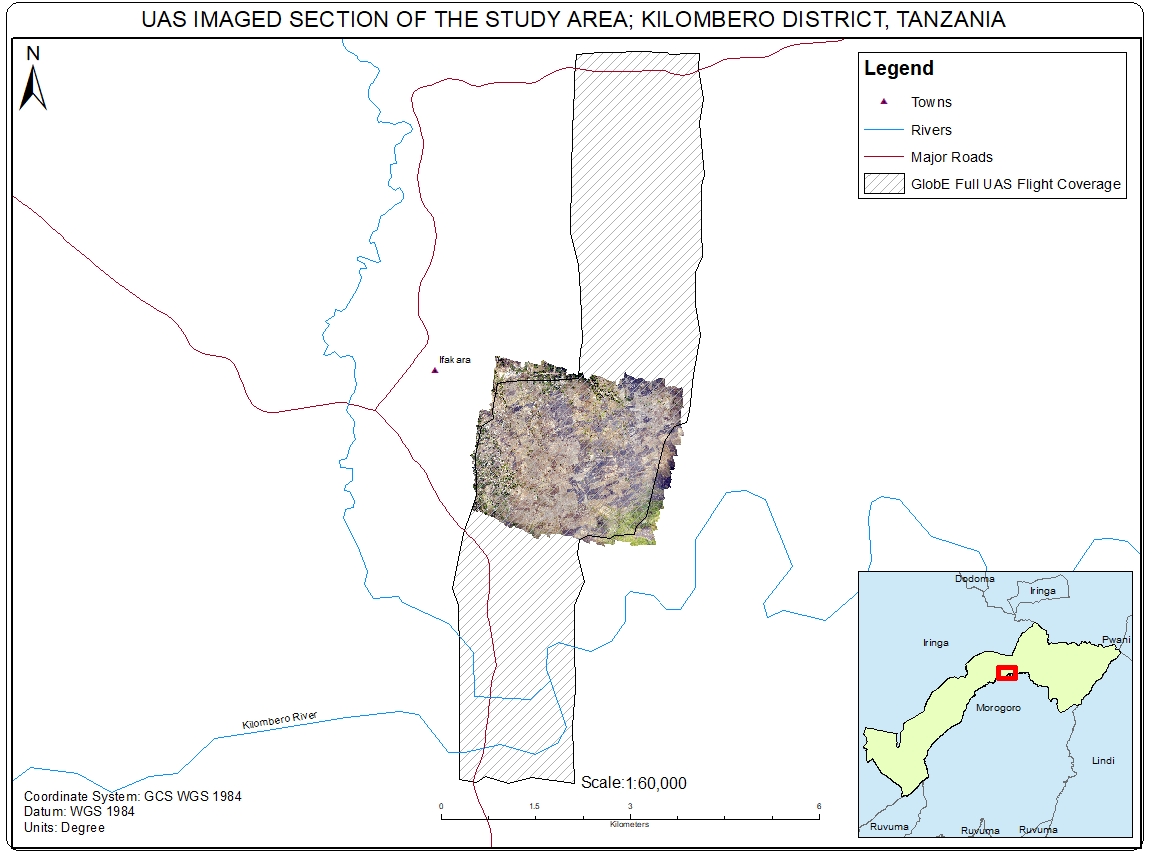 | Figure 1. Map of the Study Area |
2.2. UAS Flights and Data Capture
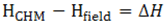
- The flights were conducted using a Mavinci Sirius Pro UAS fitted with a 14 mm fixed focal length RGB camera. The Lumix GX1 Panasonic camera is an advanced high quality lightweight UAS camera with a 16 MP sensor about nine times larger than the common sensors found in compact digital cameras. The camera is mounted with a fixed 14 mm focal length lens to increase the post processing quality of the results. The overall weight of the UAV component is 2.7 kg and capable of cruising at speeds of up to 65 km per hour with average flying heights ranging between 70 m and 743 m Above Ground Level (AGL). The UAV is able to stay airborne for up to 1 hour per flight though it is recommended to have an allowance of about 10 - 15 minutes reserve time for landing purposes. These capabilities enable the Sirius UAV to image large areas in a single flight and the area to be imaged depends on the average flying height, the GSD and the size of the image overlap required for a specific application. These properties can be varied within the Mavinci Desktop flight planning application.For the test area, flights were conducted to obtain imagery of approximately 10 cm GSD. To obtain these levels of accuracies, the UAV was flown at an altitude of 371 m with a maximum overlap of 85% for high quality stereo images. The Mavinci Sirius Pro UAS works on the principle of on-board direct geo-referencing where the UAV component, fitted with a GPS/ INS unit that collects XYZ camera location data together with orientation angles in the XYZ directions (omega, phi and kappa) for all the exposure stations. This implies that the images collected have been directly geo-referenced during the flight as a result of a Wi-Fi connector mounted on the ground, which has a GNSS/GPS/RTK capability. The Wi-Fi Connector captures and sends GPS corrections to the UAV during the flight hence providing the images with location reference information. For optimum results, the flights were conducted during the day between 10am and 1pm from 22nd September, 2014 to 25th September, 2014 to limit the effect of long shadows, though this study focused on a transect of the area to maximize on computer processing speeds. The general methodology structure is illustrated in Figure 2.
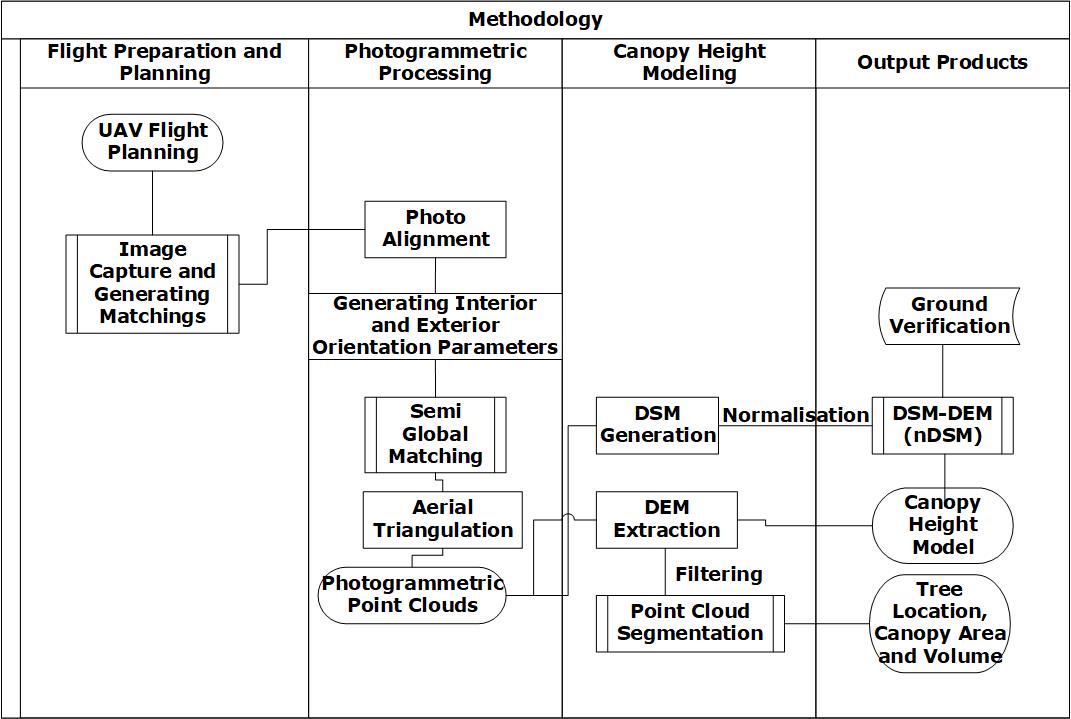 | Figure 2. General Methodology Flowchart |
2.3. Image Processing
- The general methodological structure for this research study is captured in 4 main stages that include:Ÿ Flight Preparation and PlanningŸ Digital Photogrammetric Image ProcessingŸ Tree Distribution and Height ModelingŸ Ground VerificationThe 4 stages are outlined in order to critically assess and evaluate these stages and determine accuracy levels from the products generated at each stage. This is critical since the accuracy of the tree height model generated is highly dependent on the accuracy of the surface models generated from stereo imagery [13]. This implies that quality checks are required in the generation of the 3D models for high quality output. Processing of products from the digital photogrammetric processing entail an evaluation of various post processing software applications and algorithms to determine the accuracies of the products generated.
2.3.1. Flight Preparation and Planning
- The total area of the study site is approximately 7.83 km2 imaged at 10 cm GSD. The size of the image overlap was specified as 85% and as a result, the area imaged by the UAS camera was always larger than the specified Area of Interest (AOI) size. The large overlap sizes was necessary to maximize on the stereo capabilities of the UAS.Assembly of the parts of a UAS is shown in Figure 3. The UAS components are thereafter tested to ensure that they are all functioning correctly before conducting the flights. The flight plans are then sent to the UAV via a Wi-Fi connection. Final checks are recommended at this point to ensure that the GPS and compass are calibrated and are functioning properly. Thereafter a simple hand launch is required to set the UAV airborne for data collection. The UAV flies autonomously with the aid of the GPS/INS fitted in it and the Mavinci Wi-Fi Connector on the ground that sends GPS corrections to the UAV. After conducting flights, the UAV lands in the specified landing point described on the flight planning software application (Mavinci Desktop) through an assisted mode on the Remote Control.
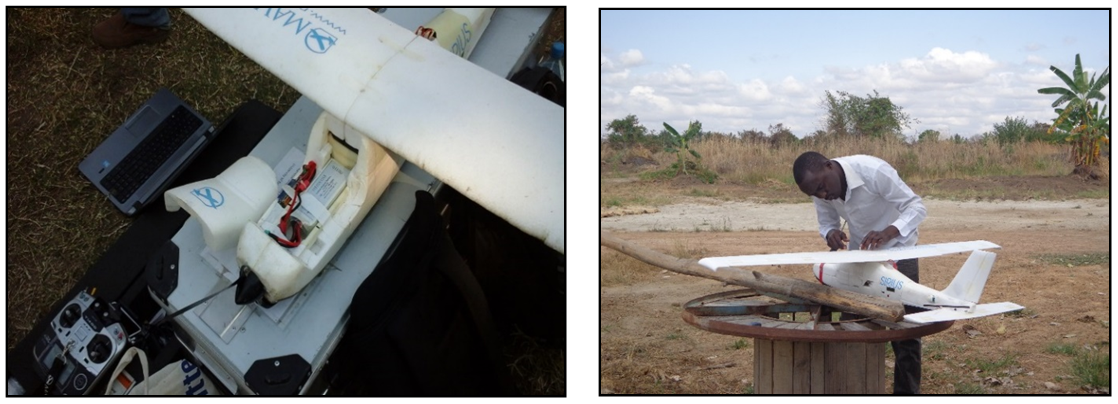 | Figure 3. UAS Assembly |
2.3.2. Digital Photogrammetric Data Processing
- Images captured by a UAS are characterized by low-oblique angles, high rotational and angular variations between successive imagery [29]. Additionally, the consumer grade sensors used in most UAS have a high level of distortion and low geometric stability and with the characteristic large number of images collected by UAS camera as opposed to the traditional aerial platforms, this required the use of newly-developed computer vision algorithms referred to as Structure from Motion [30].Structure from Motion (SfM) is a fully automated technique of directly georeferencing and rectifying aerial imagery with low accuracy camera positions to generate imagery mosaics in real-world coordinates [29]. The SfM algorithm works together with Scale Invariant Feature Transform (SIFT) feature detector for feature extraction and matching to create 3D models from stereo UAS imagery [31]. The SIFT technique was used for automatic tie point extraction and approximate Digital Surface Model (DSM) generation since traditional photogrammetric techniques do not work well with UAS imagery. Photogrammetric image processing employed the techniques of SfM [32] necessitated by the on-board geo-referencing capability of the Sirius Pro UAS. This technique together with SIFT detector for region matching enabled the generation of tie points and approximation of the DSM for the study area. Traditional feature extraction and matching techniques occasionally used in photogrammetry were ignored at this stage since they are unable to provide reliable results under extreme geometrical conditions characterized by UAS imagery. Therefore, Agisoft Photoscan Pro and Pix4D Mapper Computer Vision applications were tested in the processing of UAS imagery while maintaining the standard photogrammetric workflow.Upon download of the UAS data, the images were imported into a post processing application (Agisoft Photoscan Pro) where parameters such as flying height of the UAV platform, focal length of the camera used and coordinate system parameters were specified. Visual quality checks are also recommended to ensure that all images are properly aligned. Orientation parameters of the camera sensor collected using the GPS/ INS onboard the UAV are then specified using a log file that provides interior and exterior orientation properties of the sensor for geotagging of UAS imagery. Image matching techniques using the SIFT detector were applied during photogrammetric processing for generation of tie points and their densification for improved aerial triangulation results. Aerial triangulation and accuracy reports are essential in assessing and determining the accuracy levels of a photogrammetry workflow. Upon photo alignment and creation of an orientation structure for the images, image matching and aerial triangulation was performed to generate a dense point cloud surface. A mesh and a textured surface representing the features in the area was thereafter generated for a smoothened surface. From the methodological structure, the results of the canopy height modeling was highly dependent on the accuracy of the 3D models obtained from the photogrammetry workflow Therefore it was necessary to continuously assess the accuracy of the products generated at this point as they determine the overall accuracy.Following the photogrammetric image processing of the stereo UAS data, photogrammetric point clouds were extracted which could be separated to create a DSM that represents the surface features. Image segmentation was done on the DSM to extract individual trees and to also separate trees from other surface objects such as buildings by utilizing the spectral properties of the UAS imagery. A spatial filter was thereafter applied to the DSM to extract point clouds that represented the bare earth surface.
2.3.3. Tree Distribution and Canopy Height Modeling
- When modeling tree heights, the basic procedure involves subtracting the DTM from the DSM using special filtering techniques to obtain a DCM [13] with the height values in grid and text format. This is necessitated using the Relative Height Model structure illustrated by Figure 4. The DSM and DTM are the basic inputs to this model in raster format where they undergo modeling through subtracting the DTM from the DSM to obtain a canopy height model.
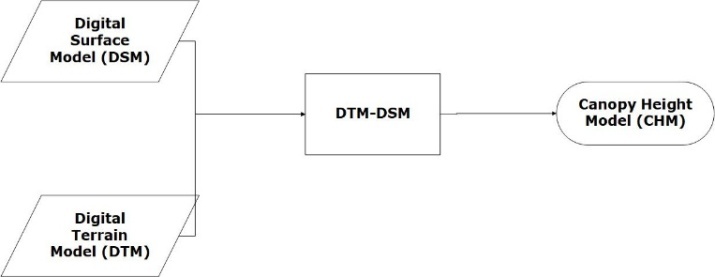 | Figure 4. Relative Height Model |
 | (1) |
 | Figure 5. Schematic diagram describing Tree Identification and Canopy Heighting process |
2.3.4. Ground Verification
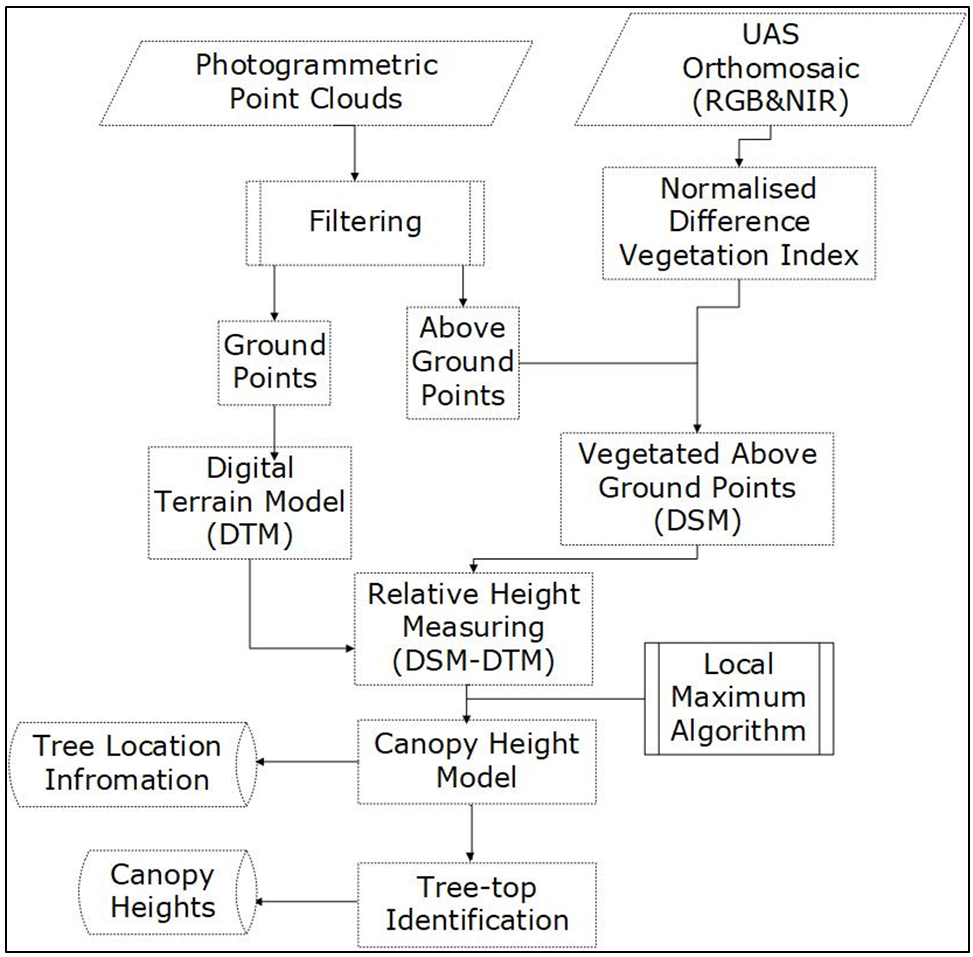
- Ground verification exercise was conducted on sample tree stands using the LaserAce 3D rangefinder to establish in-situ tree height measurements. These ground measurements were then assessed against the results obtained through photogrammetric image processing to establish the variation and the overall correlation coefficient.A LaserAce 3D rangefinder is designed to measure tree heights using the horizontal distance, vertical distance and slope distance from the location of the instrument to the target. These distances together with the vertical angle at the target are in turn used to calculate the vertical heights of trees using the Sine method illustrated by Figure 6.
 | Figure 6. The Sine Method for measuring tree heights using a LaserAce 3D rangefinder (Source: https://www.monumentaltrees.com/en/content/measuringheight/) |
3. Results
3.1. UAS Stereo Imagery Production
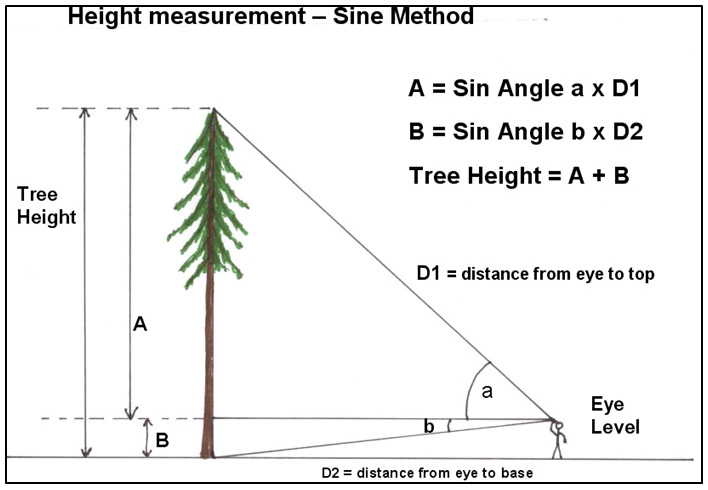
- An average of 380 images were obtained from one flight mission that covered approximately 2 km2. Imagery samples from the UAS are shown in Figure 7. Initial assessment of each flight mission and the images captured at this stage was satisfactory to produce high resolution imagery at centimeter level accuracy.
 | Figure 7. Imagery samples from Mavinci Sirus UAS; Left image showing a dwelling area with several trees while Right image shows a school building among few scattered trees |
3.2. Photogrammetric Image Post-Processing
- An image quality of 79% +/- 5.74% was obtained from stereo imagery processing using the Structure from Motion technique. An orthophoto (Figure 8) of the area of study was also generated at a spatial resolution of 10cm that could be used as a backdrop for overlay of features of interest. Agisoft Photoscan application was efficient in terms of processing speeds and image matching capabilities of very high resolution imagery with large overlaps captured by the UAS. The resulting point clouds produced had a high point cloud density of 23 points per square meter as a result of the large imagery overlaps. A sample of these point clouds is represented in Figure 9.
 | Figure 8. An orthophoto transect of part of the study area processed in Agisoft Phtotscan |
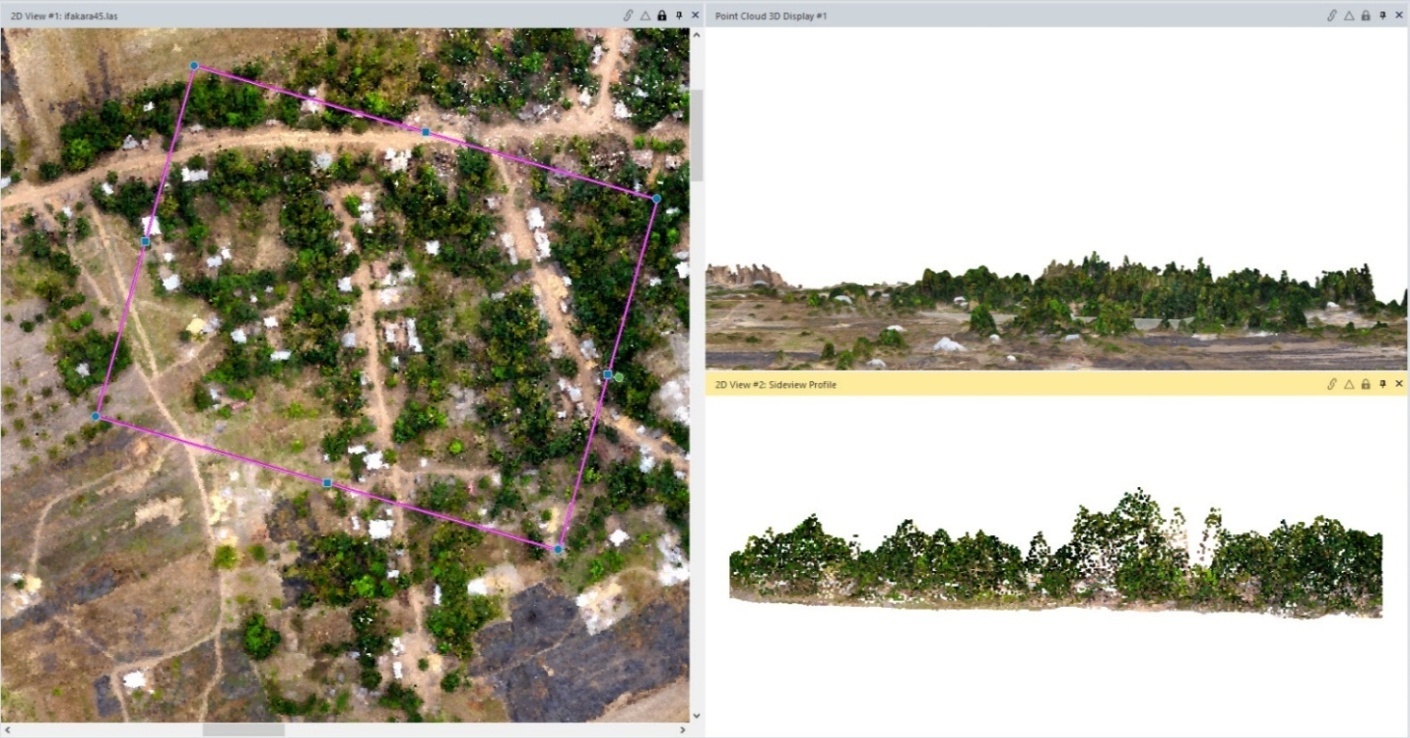 | Figure 9. Sample photogrammetric point clouds displayed using ERDAS Imagine Point Cloud Tools. Clockwise from left shows the selected area; its 3D representation and a side view profile |
3.3. Tree Distribution and Canopy Heighting
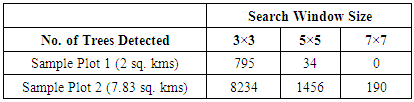
- The FWS of 3×3, 5×5 and 7×7 search window sizes evaluated during the study showed that the 3×3 search window size was able to identify more trees than the 5×5 and 7×7 window sizes for the 2 sample areas tested in this study. The number of trees identified with the 3 window sizes for 2 sample plots of different sizes are shown in Table 1. The 3×3 window size created a lot of redundancy in tree identification and thereby increasing the probability of tree identification. These therefore highlights that the choice of a FWS for a smoothed CHM has a significant influence on the detection of treetops [7] and in further determination of tree locations using the local-maxima algorithm on UAS imagery.
|
3.4. Ground Verification
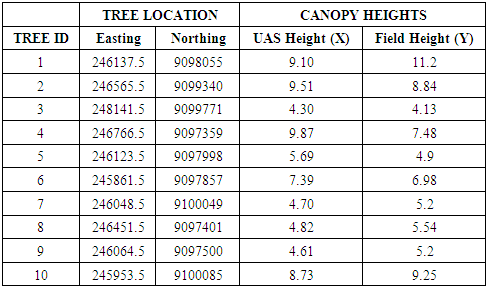
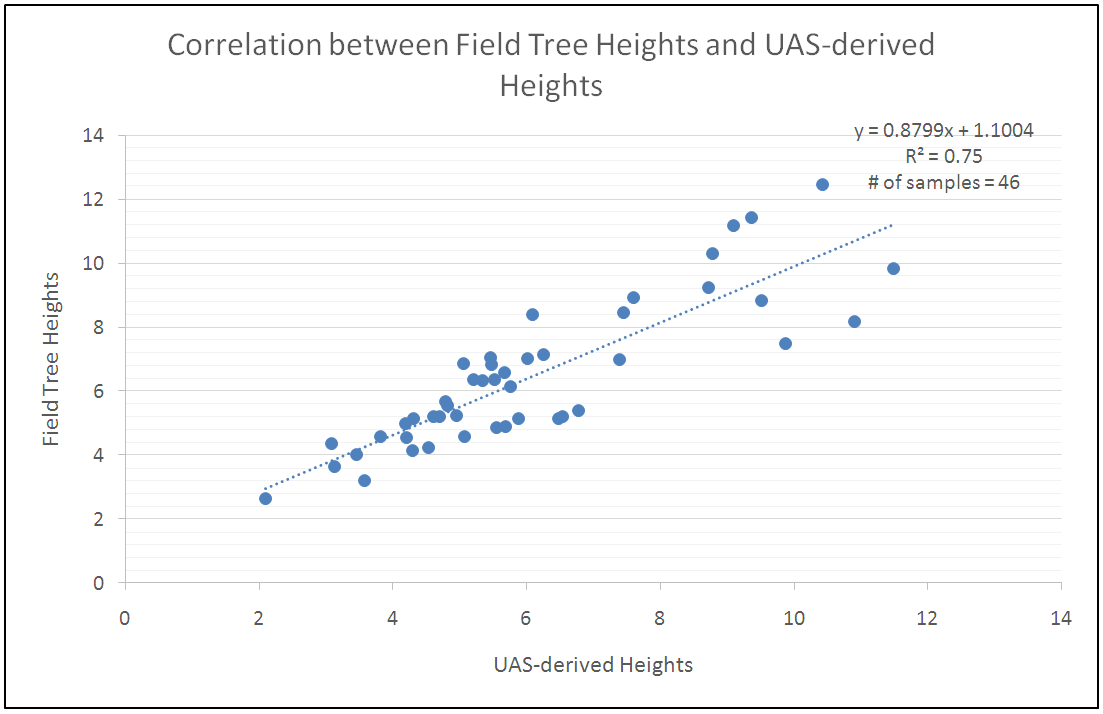
- Ground referencing to evaluate the difference between derived tree heights and the field measurements was conducted through measuring the heights of sample trees to determine the relationship between the measured and the values generated through height modeling. Tree heights derived from the local maxima algorithm were recorded alongside their respective field measurements captured using a LaserAce rangefinder to assess accuracy in canopy heights, as shown in Table 2.
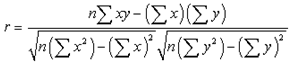 | (2) |
|
|
 | Figure 10. Correlation between Field Canopy Heights and UAS Heights |
4. Discussion
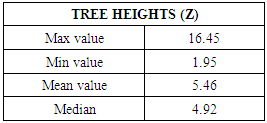
- The objective of this research was to generate 3D models, orthophotos and photogrammetric point clouds from stereo UAS data. These spatial products would be used for tree determination and to assess the accuracy of tree heights processed using the local maxima algorithm. An evaluation of a variety of photogrammetric image processing applications was done though Agisoft Photoscan provided the best solution for stereo UAS imagery processing and extraction of 3D spatial products using the SfM technique. The application also provided an intuitive and seamless integration with Mavinci flight planning software that was used to conduct the flights. This would imply that the flight planning applications could have a bias on the type of post processing software to be used for extraction of UAS products. High point cloud densities obtained from stereo post processing as a result of large image overlaps were suitable for accurate derivation of height information.The technique of local filtering with a variable window size considers fundamental forest biometrics relationships and overall has proven to give better results [34]. This is so especially for smooth rural landscapes like that found in the Ifakara region. According to the study, a 3×3 search size window was used for tree apex identification due to a mixed characteristic of tree species in the area. This aspect was similar in the study area since the area contains mixed tree species though the teak species are dominant. This therefore implies that the decision on the determination of the tree-top location is critical in determining the number of trees that will be detected and it is largely based on the knowledge and experience about the canopy structure of the trees in the study area. A 3×3 window size was determined to be able to detect more trees compared to 5×5 and 7×7 window size while avoiding errors of commission or omission. The variable window characteristic ensures that different tree species can be identified and captured with their multiple tree crown shapes and sizes [34]. This has also been proven to provide better results in CHM smoothing for LiDAR datasets since small Tree-top Window Size (TWS) detect more trees than larger TWS [25] and the same was evident with UAS data. The results show that using the 3×3 window size greatly enhances the number of tree detected for the study area and thus there is an inverse correlation between the search window size and the number of trees that can be detected. The results of tree height modeling show an agreement between heights derived from UAS data with their corresponding field height measurements. However, these could vary for different forest types (closed or open canopies) due to leaf reflection that varies with seasons. The structure of the canopies affects the accuracy of generation of tree models due to smoothing capabilities applied. A correlation coefficient of 75% obtained in this study could be attributed to variations in forest plot structures where image matching algorithms fail to generate below canopy ground points [24] especially in the few areas with closed canopies. It can be concluded therefore that this methodology is best suited for open canopy forests. Photogrammetric point clouds have the capability of high point density and when smoothened are suitable for studies in open forests. These point clouds were adequate for extraction of tree height information by utilizing a fixed window size with an average tree height in the study area approximated at 5.46 m. Sample tree heights in the area were identified and measured using a LaserAce 3D rangefinder and it can be concluded that the scanner performs significantly well for shorter trees below the mean height compared to taller trees above the mean. This may be due to accuracy of identifying the apex (tree-tops) of tree crowns when taking the 3 required measurements i.e. bottom, middle and top of the tree. It is recorded that the LaserAce 3D has a passive range of up to 150 m and therefore the distance from the scanner to the tree may also play a significant role during measurement of tree heights since the rays may be refracted. Therefore more tests need to be conducted to determine the optimum conditions for use of the LaserAce 3D in tree height measurement. The aspect of identifying and extracting tree heights was made efficient through utilizing the reflectance of vegetation in the near infrared portion of the electromagnetic spectrum. Camera capabilities of the Lumix GX1 with RGB and additional NIR capabilities were useful in extracting vegetated areas and differentiating them from non-vegetated areas to provide for identification and extraction of trees. The high point cloud densities from photogrammetric point clouds are sufficient for detecting tree crowns [37] together with NDVI that could prove useful for future studies in determining various characteristics of vegetation. However, this would depend of the type of camera used during data collection. With the continued evolution of UAS payload, various manufacturers are now developing cameras with increased spectral bands and some with LiDAR capabilities though at increased payload weight [38]. Nonetheless, such developments could in turn impact positively on efforts towards afforestation and general environmental conservation.
5. Conclusions and Outlook
- The general objective of this study was to generate 3D models from UAS stereo imagery and assess their accuracy in tree identification and canopy height measurement. We can therefore conclude that SfM techniques can effectively be utilized to process UAS imagery and obtain photogrammetric point clouds with high point densities necessary for tree measurement. It is evident that the accuracy of Canopy Height Models is directly affected by the accuracy of 3D models used to generate it, assuming other factors remain constant. We can also conclude that with direct-geofererencing for UAS with GPS/ IMU/ INS capabilities, UAV flights can easily be conducted in areas with limited or no control stations hence a big reduction in the cost of establishing a control network in an area. This would significantly reduce the cost of mapping projects since control network setup often contribute significantly to increased project costs.In addition, multiple return LiDAR functions for tree identification and canopy height modeling proved effective with UAS data for measurements in open canopies. Tree canopy measurements were achieved from UAS imagery through a combination of various image processing applications with varied capabilities for manipulating photogrammetric point clouds. FUSION LiDAR tools manipulated in R-Statistics were useful in extracting tree height information by providing a simplified and editable algorithm for canopy modeling with UAS data. With more applications in R programming, other packages such as LASmetrics utility can be used to compute statistically based metrics from the point cloud [39]; and LiDARForestStand for producing stand visualization of the point cloud-derived CHM using a 3D scatterplot. These tools originally designed for LiDAR applications proved useful in analyzing and extracting reliable information from photogrammetric point clouds with few variations. Therefore, computer vision algorithms for 3D stereo modeling and LiDAR point cloud functions proved effective in achieving the overall objective of the study.For subsequent work, there is need to verify the quality of georeferenced product by comparing coordinates of identifiable control points as deduced from the orthophoto product vis those obtained by geodetic grade survey work.
ACKNOWLEDGEMENTS
- The study was funded by GlobE Wetlands Project for East Africa implemented in collaboration with University of Bonn including The National Museums of Kenya, Nairobi and Dar es Salaam University, Tanzania.