Ibrahim Shaker1, Hala Effat2, Ayman Ragab1, Asmaa Hamdy1
1Department of Public Works, Faculty of Engineering, Ain Shams University, Cairo, Egypt
2Department of Urban Planning, National Authority for Remote Sensing and Space Sciences, Cairo, Egypt
Correspondence to: Ayman Ragab, Department of Public Works, Faculty of Engineering, Ain Shams University, Cairo, Egypt.
| Email: |  |
Copyright © 2017 Scientific & Academic Publishing. All Rights Reserved.
This work is licensed under the Creative Commons Attribution International License (CC BY).
http://creativecommons.org/licenses/by/4.0/

Abstract
Sustainable development in any country is an organizing principle for meeting human development goals as well as sustaining the ability of natural systems to provide the natural resources and ecosystem services the interest of citizens. Many factors including the environment, economic and society needs should be considered and investigated during process. These factors should be linked together to reach the best final decisions, which meet societal needs without undermining the integrity and stability of the natural systems. In addition, these different considerations and interests make the planning process complex, and as such there might be conflicts of interest in the decision making. Geographic Information Systems (GIS) and Multi-Criteria Decision Analysis (MCDA) integration reduces the complex nature in the planning process, which allows different stakeholders to reach a general conclusion, concerning the best zones for industry and new communities in north Sinai. In this context, different criteria have been selected and weighted to represent the favoured conditions concerning the order and priority for this purpose. Analytic Hierarchy Process (AHP) is another GIS-MCDA technique that is used to obtain a final assessment from variable alternative solutions. This proposed integration is expected to be well suited for creating land suitability index maps and to identify suitable zones for land development and activities redistribution.
Keywords:
GIS, MCDA, Sustainable development, North Sinai
Cite this paper: Ibrahim Shaker, Hala Effat, Ayman Ragab, Asmaa Hamdy, Multi Criteria Geographic Information System Analysis for Sustainable Development in North Sinai - EGYPT, American Journal of Geographic Information System, Vol. 6 No. 4, 2017, pp. 141-155. doi: 10.5923/j.ajgis.20170604.02.
1. Introduction
Due to rapid urbanization in Egypt, the need for new communities became a top priority for the Egyptian government. Rapid growth of population in developing countries, especially in Egypt, leads to searching for alternative methods to estimate the population and the corresponding current and future distribution. Multiple factors should be considered for such planning in order to achieve the sustainable developments in many regions. These factors include environmental, economic and social needs, as well as community and governmental interests. These factors may also have different needs such as identification of suitable zones for industry, residence, etc. One of the most needed regions for such development is the north Sinai. In general, Sinai Peninsula is considered a very important region for Egypt at both the national and strategic levels, and its development can be a challenge as the area has been neglected for years. One of the critical problems facing the researchers of Sinai development is the non-availability of detailed information about population and their distribution. Urban planning and decision making for sustainable development need large volume of data to explore the land resources, constraints, and the relationships between the status of the current natural landmarks and built environment.Geographic Information System (GIS) offers the capability of integrating spatial and attribute data and subsequent generation of an action plan and/or developmental plan for sustainable development. It has the ability store, retrieve, analyze, display data related to land use, land cover, urbanization, and environment (Brown, 2006). Nowadays, high resolutions satellite images are useful source of land use and land cover information. Using these remotely sensed data and radar data, such as Landsat; Shuttle Radar Topography Mission (SRTM) digital elevation model; meteorological data and various land use information, integrated with (GIS) software capabilities, land suitability index maps can be easily created and used to identify suitable zones for land development in many disciplines (Dawod and Mandoer, 2016). However, there are some extension modules that propose the integration of a powerful decision support system with analytical tools, including multi-criteria optimization methods, spatial analysis, and statistical tools. This development is termed as Multi-Criteria Decision Analysis (MCDA), which is an effective tool for multiple criteria decision-making issues (Alabi et al., 2012). MCDA provides significant support for the generation and comparison of alternatives taking into account the evaluation criteria through an active participation of experts and stakeholders involved in the decision-making process. It also offers as a set of procedures, techniques, and algorithms for structuring decision problems as well as designing, evaluating, and prioritizing decision alternatives (Silva et al., 2014). In other words, MCDA follows a collection of methods through which techniques and algorithms are utilized to solve complex decision-making problems. It covers a wide range of choices and is assessed by multiple, conflicting, and incommensurable criteria. Furthermore it develops, assesses, and prioritizes the alternatives (Rezaie and Panahi, 2015).Utilizing GIS-based, multi-criteria decision-making (GIS-MCDA) provides the possibility of prioritizing and combining the spatial criteria from different locations and description viewpoints and eventually aids in making comprehensive decisions (e.g. Laskar, 2003). Moreover, the proposed sustainable development is thoroughly implemented and expected to meet the needs of the present without compromising the ability for future generations to meet their own needs. This is the basic motivation of the current research that applies this integration to reach the best and optimum site selection with regard to all corresponding alternatives and criteria. The research will estimate the up to date population in order to help the decision maker to prepare the development plan, concerning redistribution of the activities and population within all the study areas in north Sinai.
2. Multi-Criteria GIS Analysis
Multi criteria decision-making (MCDM) refers to screening, prioritizing, ranking or selecting the alternatives based on human judgment from among a finite set of decision alternatives in terms of multiple conflicting criteria. Three separate steps are utilized in MCDM models to obtain the ranking of alternatives: determine the relevant criteria and alternatives, attach weights to the criteria and numerical measures to the impacts of the alternatives on these criteria, and finally process the numerical values to determine a ranking score for each alternative (Diefallah et al., 2017). The weights of criteria, which usually provide the information about the relative importance of the considered criteria, play a significant role in MCDM models (Choo et al., 1999). Several different methods are developed to take criteria priorities into account. In this paper, a limited selection of weight techniques and the ranking weight methods are presented. The rank ordering methods are used here to convert the ordinal ranking of a number of criteria into numerical weights (Barron and Barrett, 1996).Using ranks to elicit weights by some formulas is more reliable than directly assigning weights to criteria since decision makers are typically more confident about the ranks of some criteria than their weights. A great advantage of this method is fact that they rely only on ordinal information about attribute importance. It can be used in situations of time pressure, quality nature of criteria, lack of knowledge, imprecise, incomplete information or partial information, decision maker’s limited attention and information processing capability. This follows that the decision maker may not be willing or able to provide exact estimations for the decision parameters. Also, the group of decision makers may not be able to reach agreement on a set of exact weights, so in this situation it may be realistic to expect agreement only on a ranking of weights (Ahn and Park, 2008).In general, several GIS-MCDA approaches have been proposed and utilized, such as binary overlay (Boolean logic), the weighted linear combination, and Analytic Hierarchy Process (AHP) (e.g. Chandio et al. 2013a; Dawod and Mandoer 2016; Ohta et al. 2007; Wu 1998). The first method can be thought of as overlaying many transparencies each representing a certain condition or criterion. In GIS software, this method is adopted as a grid analysis procedure using an AND function to combine all layers of criteria. The result of this method comprises the sites that meet the entire set of the required conditions. The weighted linear addition method is based on the concept of computing a weighted average for each cell in a raster data format. On the other hand, the Rank Sum Method (RSM) multi-criteria method, which is the one used in this research, involves several steps including: calculation of the criteria scores, calculation of the criteria weights, local priorities and consistency of comparisons, and the determination of suitable alternatives.As a result, and in most of the location modeling problems, decision makers can use the multicriteria approach to judge various subjective and conflicting criteria while evaluating the suitability for a specific purpose. For achieving the main aim of the research in planning and evaluation of suitable zones for land development, all investigated criteria must be conveyed to decision makers in the most efficient and transparent manner. This means that the framework adopted during the evaluation must be made explicit so as to allow tracking of the influence of each factor on the evaluation results. Accordingly, the selection procedure becomes more methodical, reliable, and more importantly, transparent to the public and the numerous stakeholders. This is optimally achieved with the use of GIS and MCDA, as an integration system. In this context, GIS allows the computation of assessment factors and MCDA aggregates them into a land-suitability index. The MCDA technique appears to be better in identifying suitable zones for land development selection where many criteria must be considered and covers all involved aspects and alternatives related to suit site.
3. Study Area Description
Sinai is located in the north-east of the Egyptian territory between latitudes 29° and 31° N, longitude 32° and 35°. North Sinai Governorate is one of the governorates of Egypt. It is situated in the north eastern part of the country, and includes the northern half of the Sinai Peninsula. It is bordered on the north by the Mediterranean Sea, on the south by north Sinai governorate; on the west by Port Said, Suez, and Ismailia governorates, and on the east by the Gaza Strip and Israel. Its capital is the city of Arish. Figure 1 shows the extent of this study area.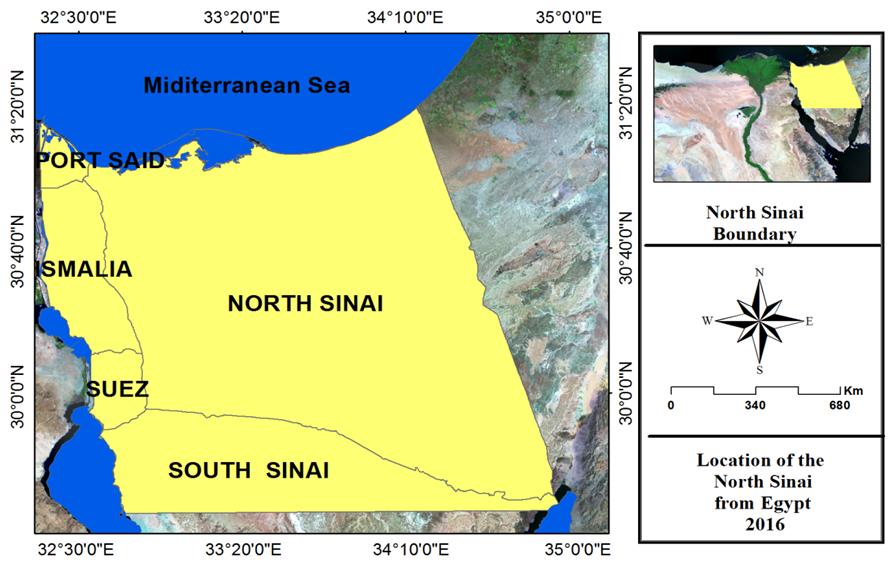 | Figure 1. Study area, north sinai, EGYPT, 2016 |
It should be mentioned that, similar research works have been done before for North Sinai development. For example, Effat and Hegazy [2013] mapped potential urban development zones in Sinai Peninsula in Egypt using remote sensing data and GIS. Five sub-models were created for five themes, using Spatial Multi Criteria Analysis (SMCA) and used as inputs to the final suitability model. These themes are: land resources, land stability, accessibility, cost of construction and land protection. A GIS-based model was designed following a sustainable development approach. Economic, social and environmental factors were introduced in the model to identify land suitable zones for urban development using Analytical Hierarchy Process (AHP). The most suitable zones for urban development in Sinai Peninsula amounted to 17% of the total area. Also, Effat [2014] resources-based zoning map for sustainable industrial development in north Sinai using remote sensing and multi criteria evaluation. North Sinai is chosen for this application due to three main reasons: first the region is rich in mineral resources, potential solar and wind energy in addition to a long coastal belt. Second, the desert nature and low populated cities of the peninsula highlights its need for further scientific researches that could unveil its potentials and hidden resources. Third, developing industrial zones is considered a backbone for job-creation and population attraction. Identification of potential zones for creating new industrial activities while considering the sensitive zones is the main objective and is believed to be a first step towards developing the region. Finally Shaker and Salah [2015] went towards a good urban development plan in Sinai through land site suitability maps. Developing a suitability map for lands that are considered best suited for urbanization. This objective has been achieved by integrating different types of data sources which include: geological data, slope percent, received flow rate, rain ratio, and water accessibility.
4. Methodology
As stated before, the main aim of this research is to find potential sites for sustainable urban development for redistribution of populations and activities by applying the integration of GIS-MCDA using (RSM) as a weighting method to this case study. Criteria used in this study were based on national and international codes related to site selection of a urban development and considered environmental, social and economic parameters (Simsek et al., 2006; Baban and Flannagan, 1998; Kontos et al., (2005); Sener et al., 2006; Gemitzi et al., 2007) as also depicted in Figure 2. Briefly, the methodology steps include data preparation, GIS analysis, and decision- making process. Each step carried out is briefly discussed in the following subsections. | Figure 2. Scheme of sustainable development |
4.1. Data Preparation
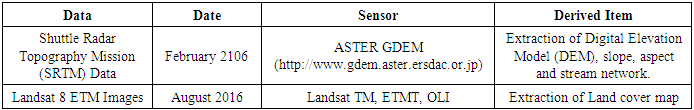
Remote sensing is one of the important data acquisition means, that plays a vital role in land use suitability assessment. In the present study, land use, cultivated land, urban distribution, water bodies, ecological elements are all obtained from the analysis and interpretation of satellite images and maps covering North Sinai Peninsula at different scales as shown in Table 1.Table 1. Data sources and derived factors which have been applied as inputs for the multi-criteria analysis process
 |
| |
|
A number of six Landsat satellite scenes, covering the whole territory of North Sinai imaged during the year 2016, were collected and processed to be included in the GIS land resources database. Image pre-processing was applied to reduce the undesired variations/noises and enhance desired features. In the current study, different functions of ENVI 5.1 were used for all processing steps. Radiometric correction of satellite imagery (Normalization) takes into account the combined, measurable atmospheric reflectance, aerosol and earth’s surface scattering and absorption then use mosaicking to combine multiple images into a single composite image show in figure 3. At the end, the study area is cut from full imagery.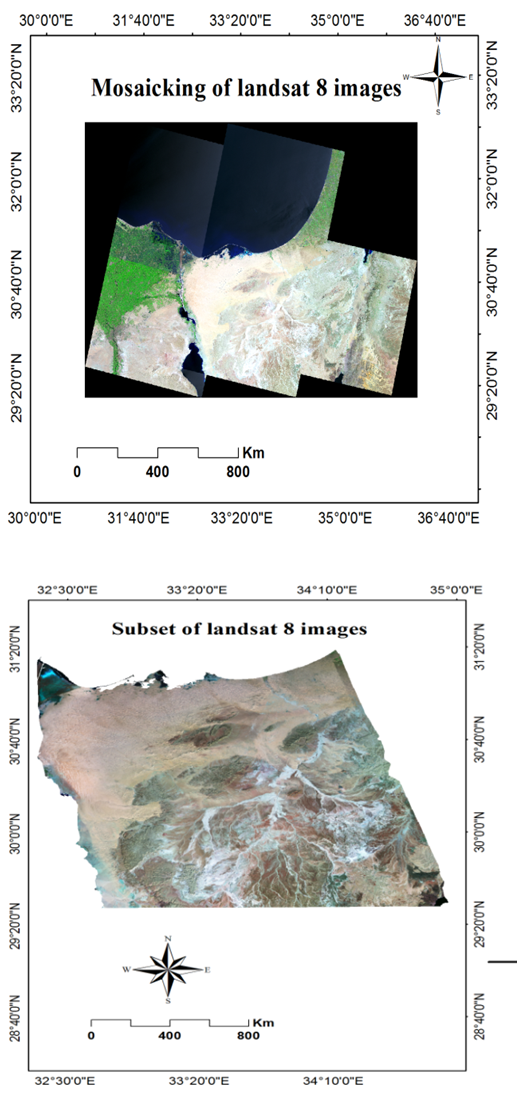 | Figure 3. Mosaicking and subset of Landsat images 2016 |
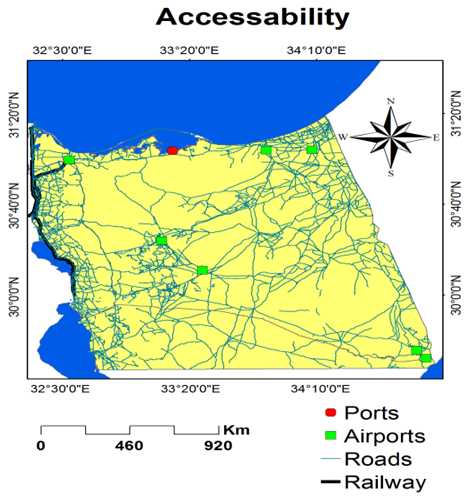
Finally, The corrected and mosaic images were used to produce a land cover map by supervised classification that was elaborated according to Minimum Distance Classification using GIS 10.1-ENVI 5.1 software for the classification process to spectral bands excluding the thermal band. The" maximum likelihood" and "minimum distance" classifier were applied for the clustering process. After classification, a major 3 × 3 filters was applied to remove anomalous pixels from the matrix. The obtained data indicate that the Land Use/Land Cover classes include sabkhas, fish farms, urban areas, sand dunes, bare rock, agriculture, natural vegetation, water.Consequently and as stated before, large volume of data are also required for the tested regions in order to perform a concise corresponding sustainable development. In this terminology, large portions of data are available for the north Sinai study area. All the data in the study area was projected into WGS_1984 Universal Transverse Mercator (UTM) zone number 36N. In addition, some of this information was in analogue form, which was converted to a corresponding vector format and other data sets were transformed in a format suitable for GIS-MCDA analysis. All of the information was finally stored in a geographic database created in ArcGIS V.10.1 software. The original available data and its corresponding transformed formats are listed and depicted below as:Ø Shuttle Radar Topography Mission (SRTM) acquired in February 2106. The Digital elevation model (DEM) 90.0 meters cells resolution was processed using ESRI Spatial Analyst modules to extract the slope and the streams network (United States Geo- logical Survey (USGS), 2016. http://seamless.usgs.gov), as shown in Figure 4.Ø Data from Landsat 8 ETM images acquired during 2016 were atmospherically corrected using FLAASH module in ENVI 5.1 to remove any effect on image due to atmospheric conditions at the time of collection. The multiple images were then combined into a single composite image. The corrected and mosaiced images were used to produce a land cover map by supervised classification that was elaborated according to Minimum Distance Classification using GIS 10.1-ENVI 5.1 software. The obtained data indicate that the Land Use/Land Cover classes include sabkha, fish farms, urban areas, sand dunes, bare rock, agriculture, natural vegetation, water, as shown in figure 5. Ø The topographic map of Sinai, scale 1:50,000 published in 1985, was used to extract the roads, railways, airports layers (EGSA, Egyptian Military Survey Department), shown in Figure 6.Ø The geological map, scale 1:500,000, published in 1987, was used to digitize some of the oil well, mines, and quarries (EGPC, Egyptian General Petroleum Corporation) as shown in Figure 7.Ø The natural protectorates map was obtained from the Egyptian Environmental Affairs Authority (EEAA) as part of a report published in 1998. The analogue map was rectified, digitized, and converted to a feature class.Ø The archaeological sites layer was obtained from the General Organization for Physical Planning (GOPP, 2007), and was used to map the archaeology sites as shown in Figure 8.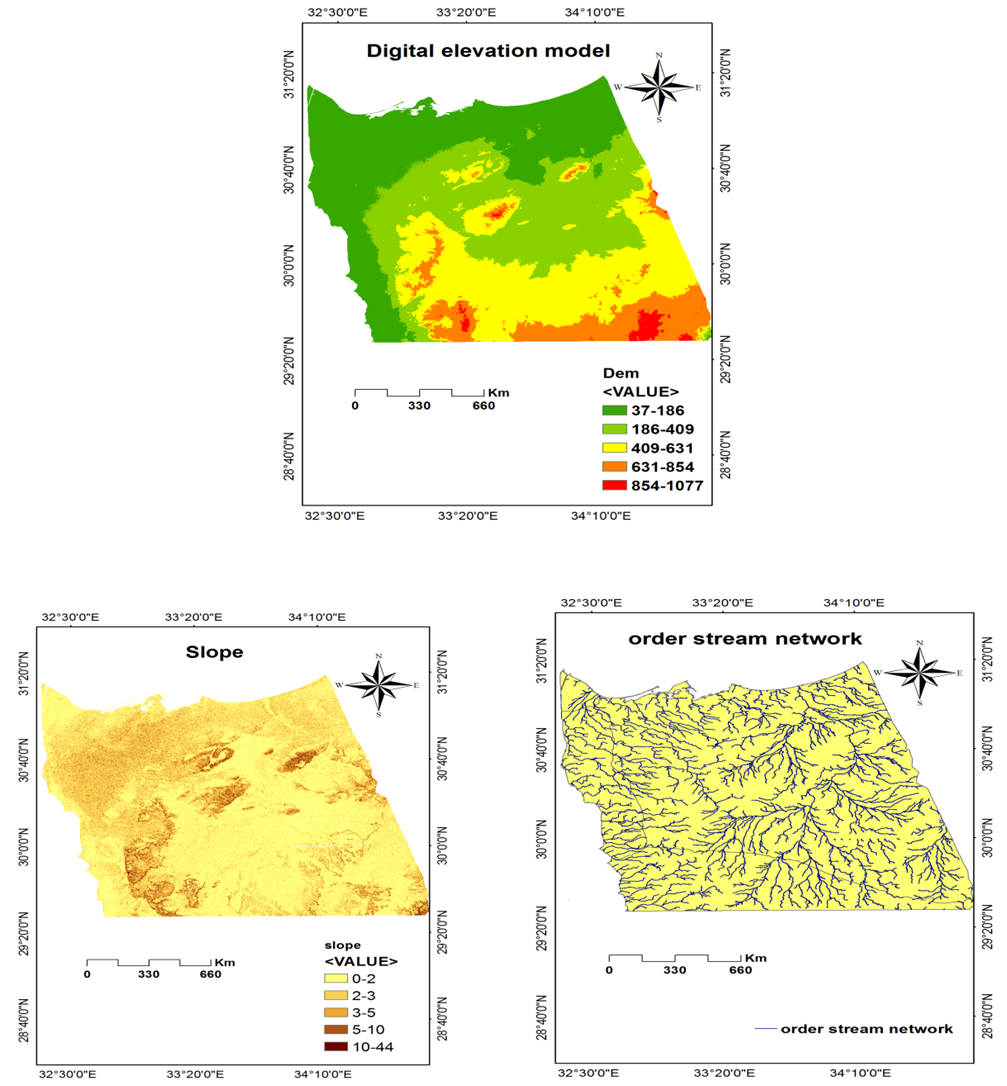 | Figure 4. Available DEM and its data sources |
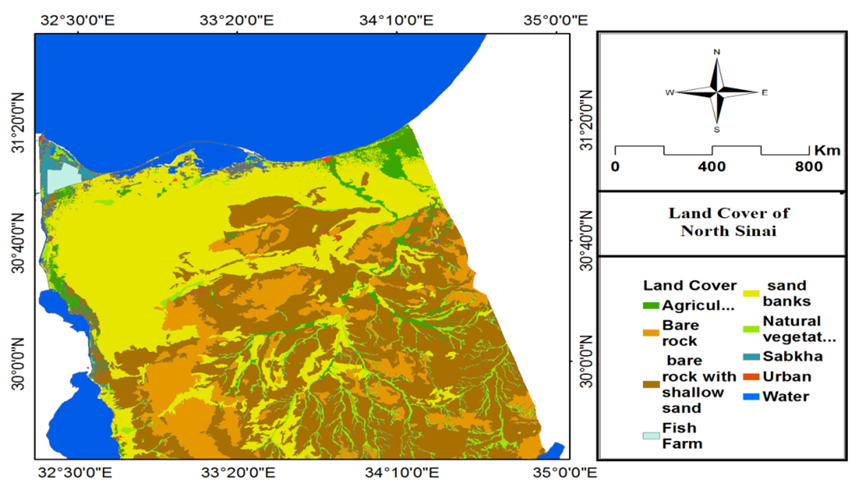 | Figure 5. Satellite images and its classified land cover |
 | Figure 6. Roads network map |
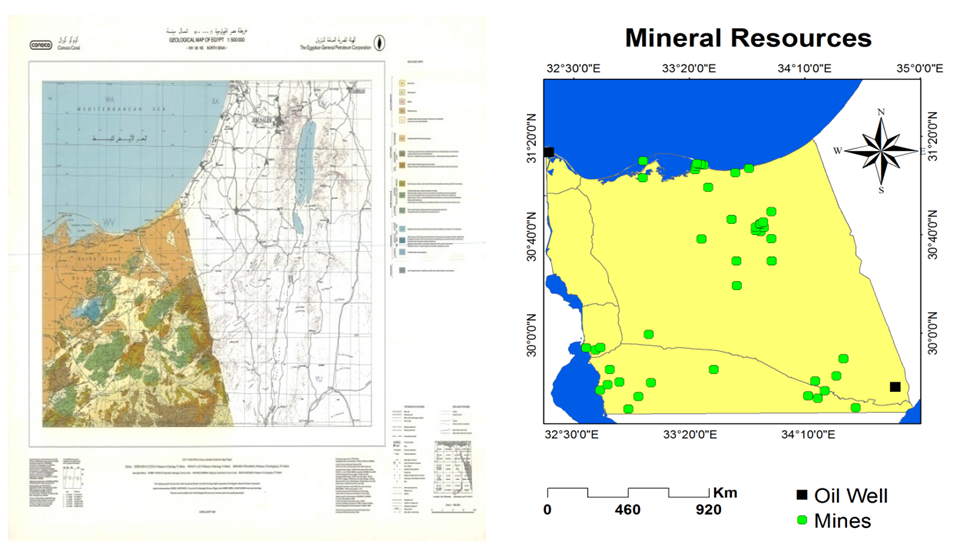 | Figure 7. Geology map |
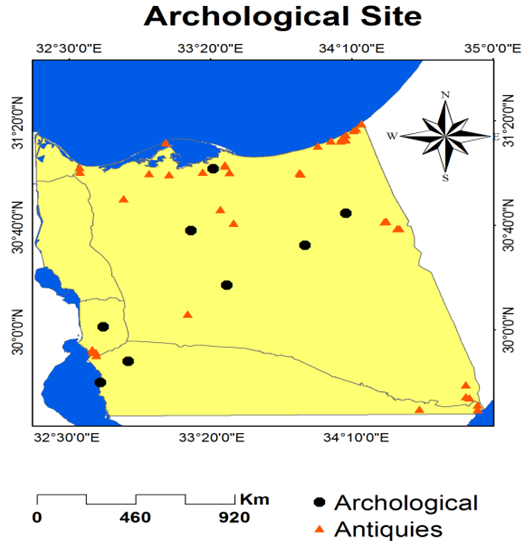 | Figure 8. Archeology map |
4.2. Building GIS Database for Decision Making
In ArcGIS software, geo processing tools can be used to perform spatial analysis and manage all GIS data. Model Builder was used to create, edit, and manage geo processing models that automate those tools. Models are workflows that string together sequences of geo processing tools, feeding the output of one tool into another tool as input. Also, Model Builder can be thought of as a visual programming language for building workflows (Effat and Hegazy, 2014).Two types of criteria support the decision-making, which are factors and constraints. These criteria represent conditions which can be quantified and contribute to the decision-making process (Eastman et al., 1993). In the current research, the factors are criteria that define some degree of suitability for all the geographic regions. Factors are often grouped into themes according to overall sustainable development objectives (Keshkamat et al., 2009). Constraints are used to eliminate certain spatial objects from consideration. Following this, a specific weight is assigned to all criteria factors according to the priorities of each factor. The criterion weights estimate the perceived importance of individual criterion relative to the other criteria. All these processes will be briefly investigated.
4.2.1. Factors
Factors, assigned on literature review and expert knowledge, are used to identify the development resources-based suitability criteria. The corresponding sustainable development depends on many factors, in which some other related sub-criteria are included (Effat and Hegazy, 2013). In this case study, three main resources are considered as factors, which are subdivided into subroutines as water resources (ground and surface water), mineral resources (mines and oil wells) and agricultural resources (current and reclamation agriculture). In addition, main activities (tourism and fisheries), infrastructure (power lines, converting station and irrigation networks), accessibility (roads, airports, ports and railways), and finally a land cover are also taken into account. Cultivated lands, natural vegetation, water bodies, sabkha wetlands, sand dunes, urban areas, and desert bare lands are the main land cover features.Moving to the three main resources, the availability of mines or quarries is an essential factor for industrial activities. North Sinai encounters several occurrences of various types of mineral resources including: coal, black sands, glass sand, kaolin, as well as marl, dolomite, sand, gravel and sands. Large amount of raw materials for cement industry, such as limestone, shale and gypsum, are also available. Also, groundwater is one of the most important natural resources for the development in such areas of severe aridity as North Sinai. The two main types of water resources are surface water and ground water. Groundwater is found in the quaternary aquifer in wadi alluvium and coastal sand dunes, and the deep fracture zone aquifers in lower cretaceous sandstone formations. The underground water aquifers were scanned and digitized from the hydro-geological map of Sinai. Finally, the soil map of North Sinai was used to ensure the preservation of soils that are suitable for agriculture and land reclamation.Accessibility is a main factor that defines the decisions of people. Accessibility to a site can be considered as a main factor for polarization for a new location. Factors used to model the accessibility theme include roads which are the main arteries for a development site. They provide accessibility and link remote areas, constituting the main arteries for residential needs. Main corridors, paved roads and desert tracks were considered. Also, the proximity to existing ports is an important factor for exchanging goods and providing jobs. A distance function was used to create a distance to ports map. Moreover, airports are crucial in serving a site providing accessibility and linking its remote areas. Also, each considered factor and/or any sub-criteria may be reclassified according to the relative importance of each criteria factor; and internally for the sub-criteria according to its distance. This step also depends mainly on experience, reports, and impact assessments of previous similar projects and the knowledge of all experts and stakeholders. In this terminology, the standardization method used here is numerical scale from 1 - 9 where (1) is the least desirable value and (9) is the most desirable value. Figure 9 shows the corresponding distance maps for some selected criteria.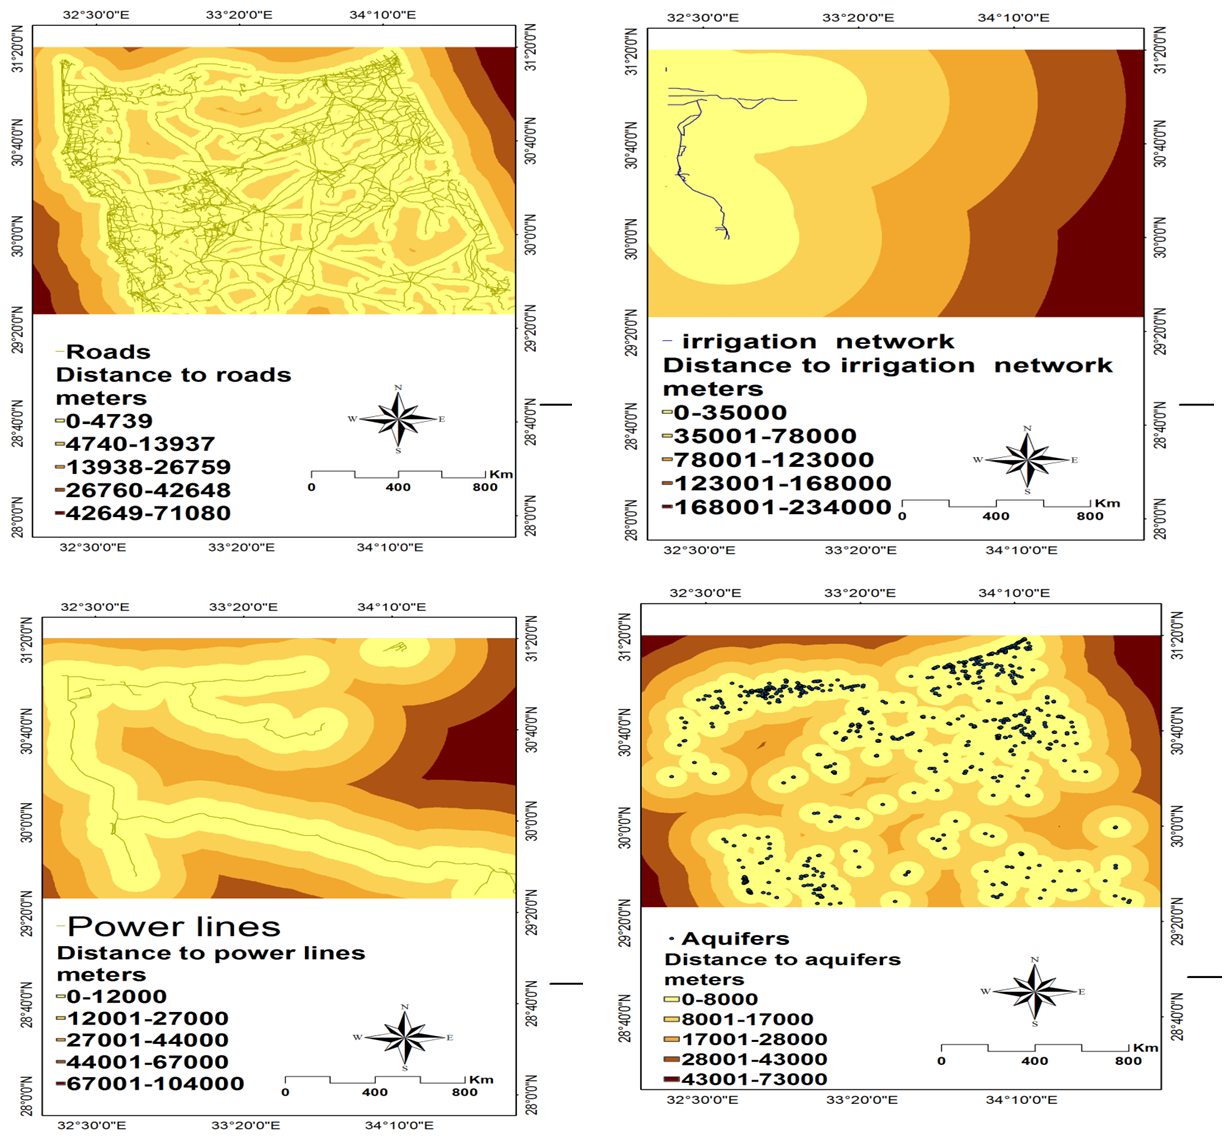 | Figure 9. Standardized factors distance maps |
4.2.2. Constraints
Constraints initially should be put into action prior to any decision. These constraints mainly eliminate some data, which are included in the investigation. Constraints are usually expressed as buffered zones and different zone in a GIS data analysis. For our study purposes, these constraints were applied using available data such as earthquakes, active and line faults, high-order streams besides the sand dunes, respectively as depicted in Figure 10. Such buffer zones were generated based on the criteria set by the Egyptian Environmental Affairs Authority (EEAA), while few others were derived from literature review. For example, a buffer zone of 1.0 km was established around sabkha and marshes borders around Lake Bardawil and El Zaraneik as natural protectorate. A binary image was created for each criterion by giving a zero value to the constraint and its buffer, while the rest of the region is given a value of one. The final constraint map was combined by multiplication using ESRI ArcGIS 10.1 Spatial Analyst module. The constraint map ensures the protection of the vulnerable lands as well as avoiding selection of built-up lands, as shown in Figure 11.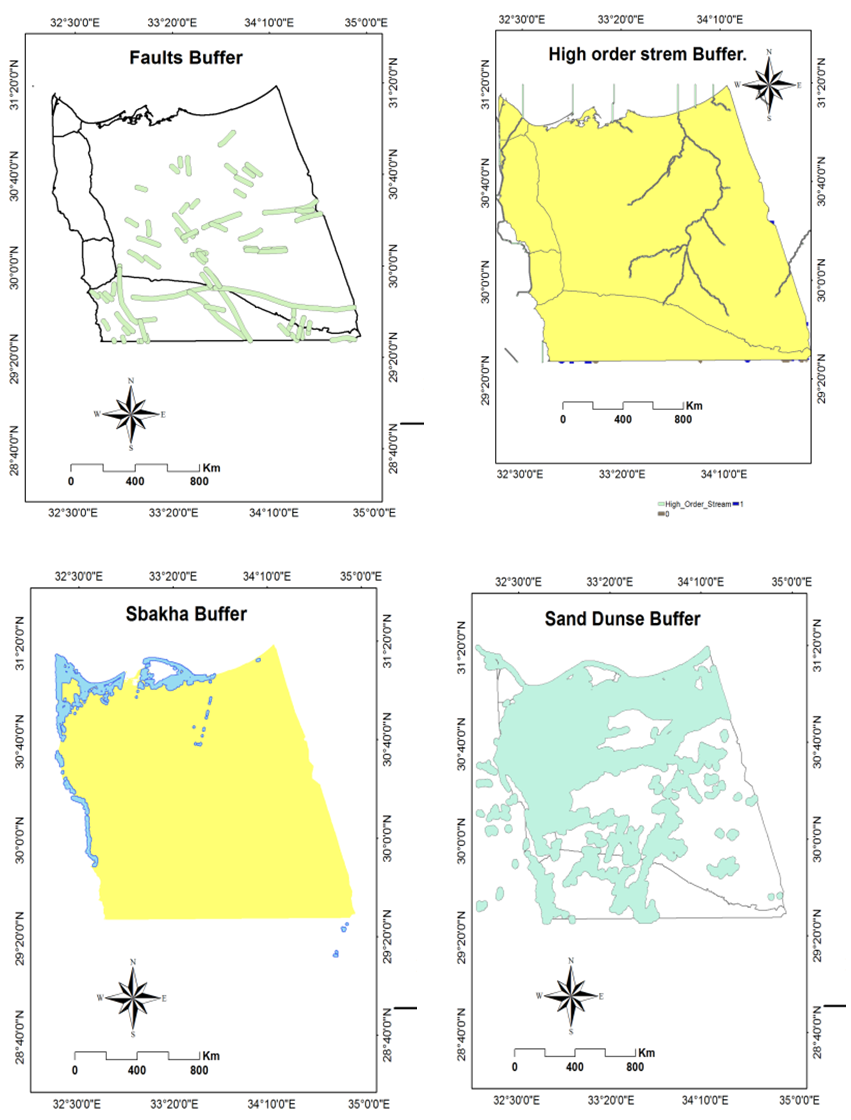 | Figure 10. Constraint maps |
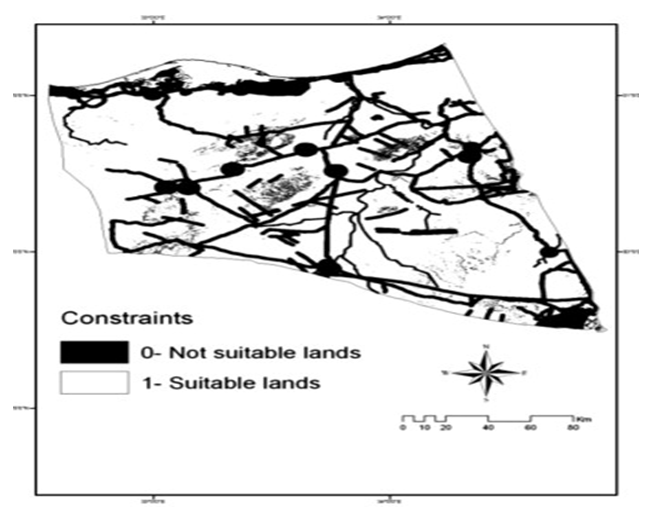 | Figure 11. Combined constraints map |
Those two steps are schematically represented as a flow chart in figure 12 using ESRI ArcGIS 10.1 Spatial Analyst module.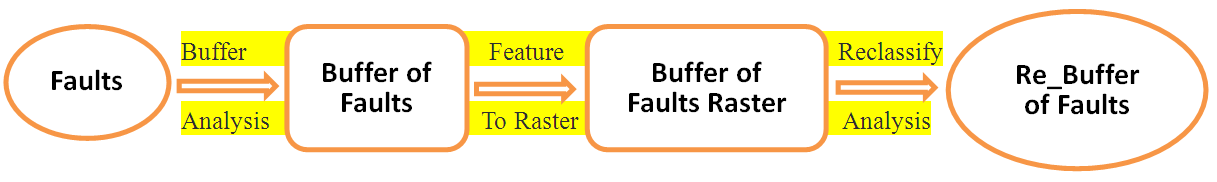 | Figure 12. Processing analysis of constraint and reclassification |
4.2.3. Normalization
Criteria attributes have different measuring scales. In order to perform analysis, standardization has to be performed through transformation of attributes into a common suitability index. For each factor, the attributes were rated in reference to a common scale. Thus for each sub routine, the criteria attributes were transformed from the original values to a common suitability scale ranging from (1) to (9). The higher value being more favorable and vice versa. A value of zero was given to unsuitable pixels.
4.2.4. Weighted Combination
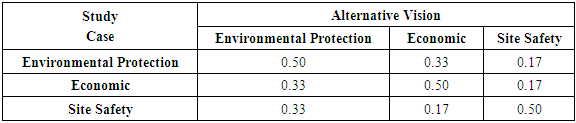
A specific weight should then be assigned among all criteria factors in each alternative, since they have different priorities due to the goals and objectives. The Analytical Hierarchy Process (AHP) method is advantageous in determining weights by comparing of each factor with other corresponding ones, thus yielding a relative weight, which is better than an absolute weight without any comparison (Lin and Zu 2013). The criterion weights estimate the perceived importance of individual criterion relative to the other criteria. In the pairwise comparison method, the pairwise comparison matrix is developed by the decision maker depending on the evaluation of the relative importance of any criteria using a scale, which ranges from (1) to (9), where (1) is the least suitable and (9) most suitable (Chandio et al. 2013b). Tables 2 and 3 give a brief illustration of the AHP concept for the economic alternative as an example.Table 2. AHP Weighting
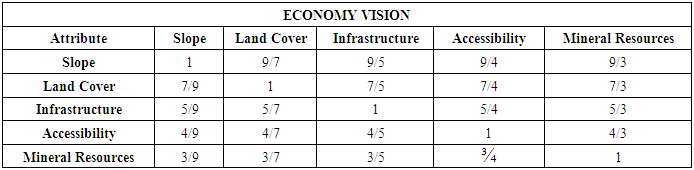 |
| |
|
Table 3. Normalized pairwise AHP comparison matrix and relative weights
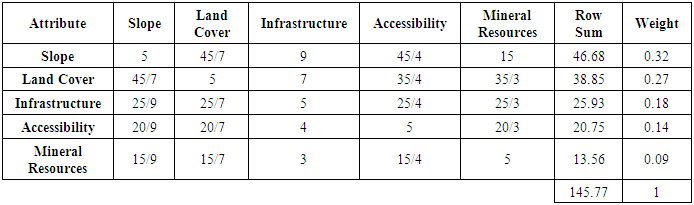 |
| |
|
Then, the simple additive weight method, known as the Weighted Linear Combination (WLC), was used to combine the criteria (Malczewski, 1999). This process is often used in site-suitability studies where several factors affect the suitability of a site (Esri, 1996). The GIS overlay process is used to combine the factors and constraints in the form of a WLC process to yield to the weighted maps corresponding to the three visions of environmental protection, economic, and site safety, which are schematically presented in the flow charts shown in Figure 13. The final three weighted maps are depicted in figure 14.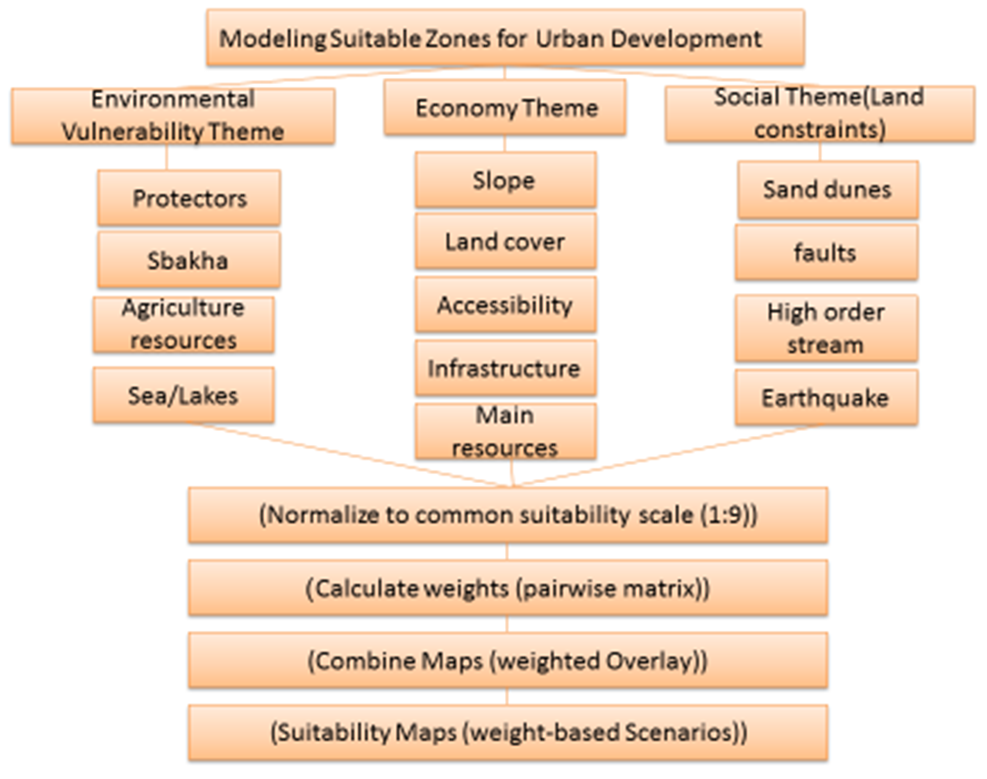 | Figure 13. A conceptual model for the suitable weighted maps |
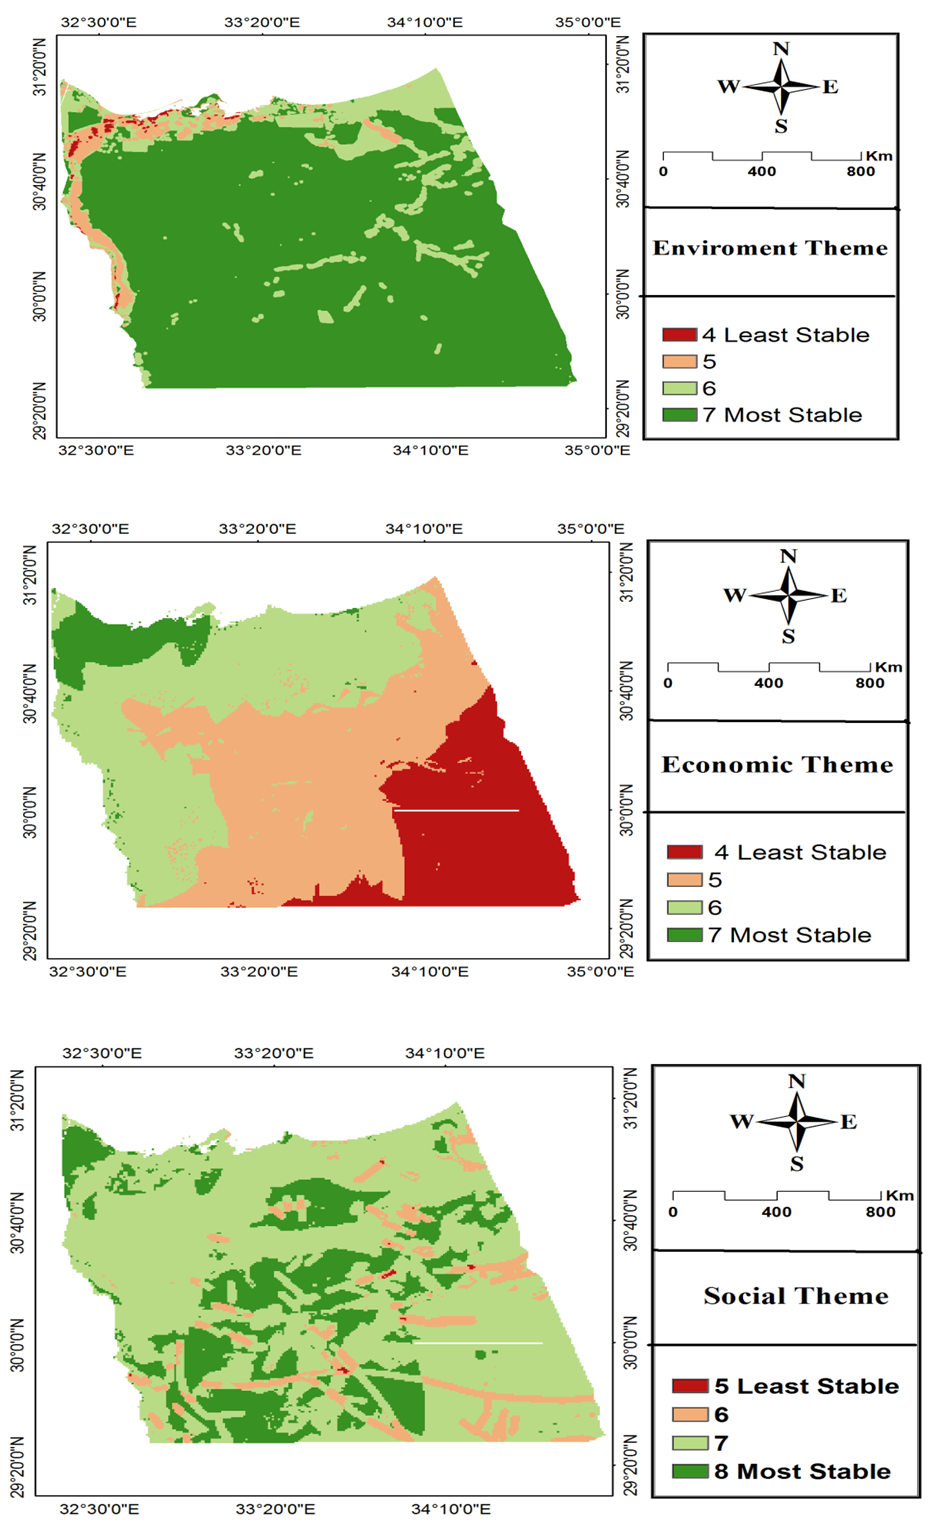 | Figure 14. Final weighted maps |
5. Results
In civil engineering projects, many alternatives with varying priorities should be investigated in order to gain wider overview of the output results. These alternatives along with their corresponding weights are basically defined by experts and stakeholders. In this context, three different study cases regarding weighting are considered as listed in Table 4, along with the corresponding output results regarding the final suitable site in each case. Those final suitability maps for the three study cases are easily obtained by using weight sum tool in the ArcGIS software.Table 4. Assigned weights for multiple study cases
 |
| |
|
To have meaningful and concise judgments on the output results, the obtained best site in each case study should be investigated and evaluated based on the previously-mentioned criteria and its standardized suitability, of applying the weighted overlay of the constraints layers is a binary map. Such a map identifies all sites that are not to be changed in land use, and thus are not to be considered in the site selection procedure. Nevertheless such lands have to be modeled in the multi criteria evaluation as constraints and masked out. The running of the weighted linear combination revealed interesting results for each case study. The aggregation results in continuous suitability images, such images were reclassified into nine suitability classes for each one. Changing the set of weights for the themes changed the trade-off between them. Reducing the weight for a specific theme means prioritizing another one. All final output case studies are illustrated in Figure 15.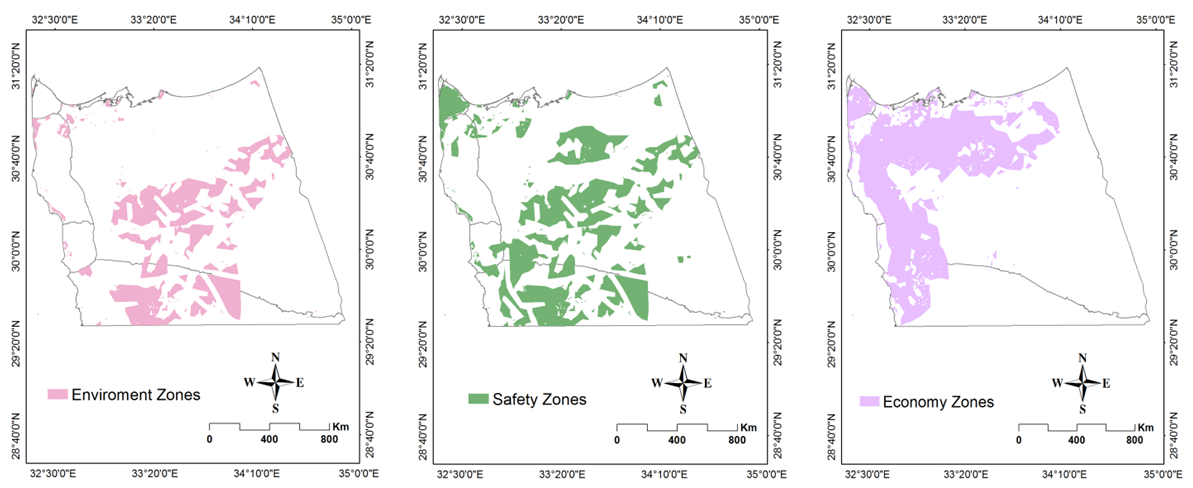 | Figure 15. Suitability Site Maps |
These results reveal some important findings that can be summarized as follows:- For The environmental protection scenario resulted in a suitability index map where most of the suitable sites are identified in Shark El-Bohirat, and Valley of Technology in Ismailia, and alqintara sharq regions. In addition, some moderately suitable sites lie south of el Abd city and El Arish. The main cause for this result is the ecological features that exist in the coastal belt of the region. The Bardawil Lake and protectorate, which lies north of the cities of Romana and El Mazar lowers the suitability values in this scenario, evaluates the ecological theme highest and thus less suitable zones exist in the east zones.- The Economic scenario resulted in a suitability index extensive suitable site zones alqintara sharq, the valley of technology, Shark El-Bohirat, New Rafah and El Arish zones. This results is quite reasonable for a scenario that prioritizes the economic factors reflected by the existence of developed features such as cities, existence of an extensive road and railroad network in addition to proximity to life lines utility.- The Social scenario resulted in suitable site zones at alqintara sharq, Shark El-Bohirat, NewRafah, El Arish, rafah, nekhal.
6. Conclusions
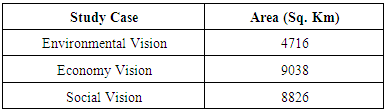
The use of remotely sensed data integrated with spatial multi criteria evaluation in this study proved to be quite feasible. It facilitates the scanning of quite a large region with the least amount of costs. The technique provides a land screening that can not only be used in site selection but also in environmental impact assessment of proposed projects. Applying such methodology to identify suitable sites for sustainable urban development in North Sinai, three possible sets of solutions were possible according to three visions. A follow-up on this research, would be to develop a decision support system whereby the user could give different weights to the three visions (environment protection, site safety, and economic), depending on particular needs. This could be based on the criteria tree designed in this paper. Such a system can be quite helpful to bridge the gap between decision makers and analysts during discussions of the various visions and priorities.The development sites are selected by several criteria set by the National Specialized Councils in Egypt. The rural extension is located on the desert back as a first phase of the exit from the valley. It can be applied in the near and medium term. However, there are some obstacles that may affect the possibilities of benefiting from this. So, the national specialized councils have set the criteria by which they can be chosen extent of the urban extension in:• The validity of the site in terms of topographical levels does not exceed the level of 10%.• Suitable location in terms of tendencies (flat areas not more inclined than 20%).• Soil validity for construction and building.• Non-exposure to natural hazards (flood risk through valleys).• The validity of sites to supply clean water, energy and communications networks, with appropriate economics and costs.• The ease of linking sites to the existing or targeted road network of existing villages.• Proximity to ongoing and targeted projects in the Sahara desert, to benefit from the existing infrastructure of utility networks.The application of these criteria, besides the resultant suitable sites extracted from all case studies in the current paper, have led to the selection of some areas to reach maximum benefits from proposed urban development in north Sinai. Those recommended areas are listed below in Table 5 and final suitable areas for urbanization as obtained by (Effat and Hegazy), (Shaker and Salah) and obtained in this study shows in Fig 16.Table 5. The recommended areas for sustainable urban development
 |
| |
|
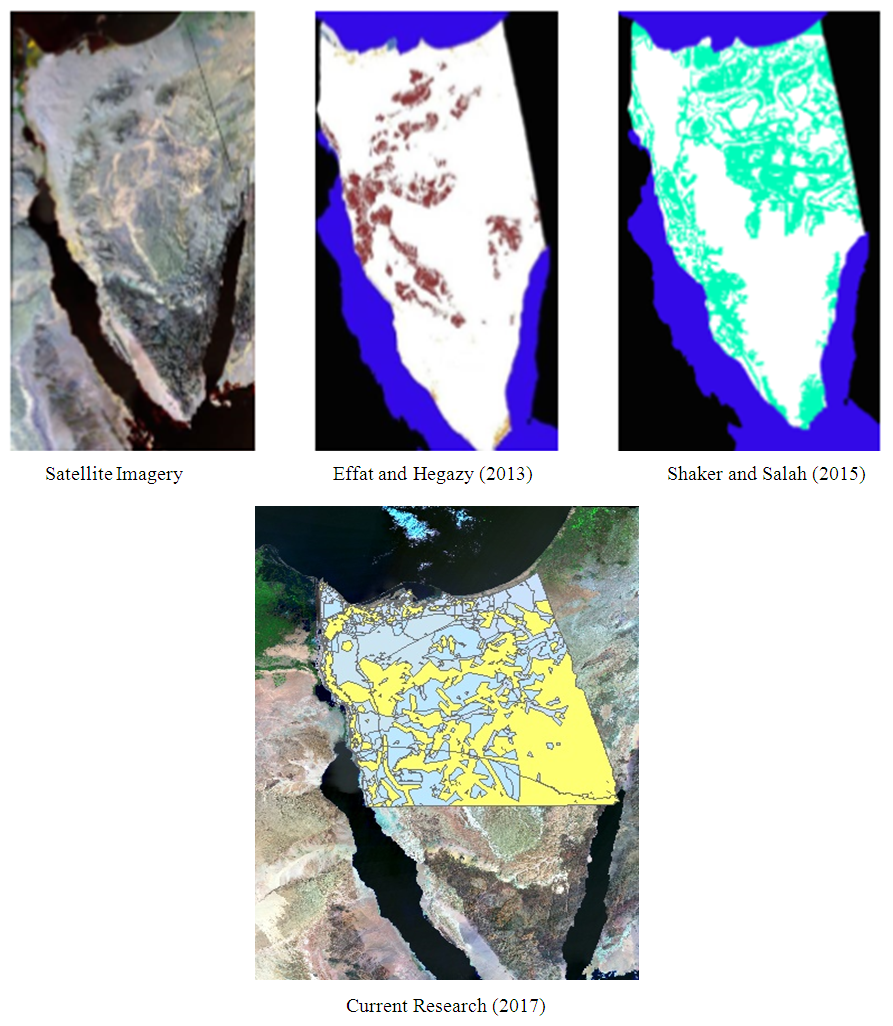 | Figure 16. Final suitable areas for urbanization |
References
| [1] | Ahn, B.S. and K.S. Park 2008. Comparing methods for multi attribute decision making with ordinal weights, Computers & Operations Research 35 (5) 1660-1670. |
| [2] | Alabi, T.; K. Sondi; O. Oduwole and C. Okafor 2012. A Multi-Criteria GIS Site Selection for Sustainable Cocoa Development in West Africa: A Case Study of Nigeria. International Journal of Applied Geospatial Research, 3(1), 72-86. |
| [3] | Baban, S.M. and J. Flannagan 1998. Developing and implementing GIS assisted constraints criteria for planning landfill sites in the UK. Plan. Pract. Res. 13, 139-151. |
| [4] | Barron, F. H. and B. E. Barrett 1996. Decision quality using ranked attribute weights, Management Science 42 (1996) 1515-1523. |
| [5] | Brown, D. F. 2006. Back to Basics: The Influence of Sustain- able Development on Urban Planning with Special Reference to Montreal, Canadian Journal of Urban Research, Vol. 15, No. 1, 2006, pp. 99-117. |
| [6] | Chandio, I. A.; A. N. Matori; K. WanYusof; M. A. Talpur; A. Balogun and D. Lawal 2013a. GIS-Based Analytic Hierarchy process as a Multicriteria Decision Analysis Instrument: A Review. Arab Journal of Geosciences, 6, 3059-3066. |
| [7] | Chandio, I. A.; A. N. Matori; K. WanYusof; M. A. Talpur and M. Aminu 2013b. GISBased Land Suitability Analysis of Sustainable Hillside Development. Fourth International Symposium on Infrastructure Engineering in Developing Countries, IEDC. |
| [8] | Chang, N. B.; G. Parvathinathan and J. B. Breeden 2008. Combining GIS with fuzzy multicriteria decision-making for landfill sitting in a fast growing urban region. J Environ Manag 87(1): 139–153. |
| [9] | Choo E.U., B. Schoner and W.C. Wedley 1999. Interpretation of Criteria Weights in Multicriteria Decision-making, “Computers & Industrial Engineering” 37, 527-541. |
| [10] | Diefallah M.; A. Ragab, A. Ragheb and A. Abdelkarim. 2017. A Case Study for Best Path Selection using Integrated GIS-Multi Criteria Decision Approach, Surveying and Land Information Science. |
| [11] | Dawood, G. M. and M. S. Mandoer 2016. Optimum Sites for Solar Energy Harvesting in Egypt Based on Multi-Criteria GIS. 1st Future University International Conference on New Energy & Environmental Engineering "ICNEEE", Cairo, Egypt. |
| [12] | Effat H. A. and M. N. Hegazy 2014. Resource-based zoning map for sustainable industrial development in north Sinai using remote sensing and multicriteria, Article in International Journal of Sustainable Development and Planning. |
| [13] | Effat H. A. and M. N. Hegazy 2013. A Multidisciplinary Approach to Mapping Potential Urban Development Zones in Sinai Peninsula, Egypt Using Remote Sensing and GIS, Journal of Geographic Information System, 5, 567-583. |
| [14] | Esri 1996. Working with the Arcview Spatial Analyst, Environmental Systems Research Institute, Inc., Redlands. |
| [15] | Gemitziet, A.; V.A. Tsihrintzis; E. Voudrias; C. Petalasland G. Stravodimos 2007. Combining geographic information system, multicriteria evaluation techniques and fuzzy logic in sitting MSW landfills Environ. Geol., 51, 797-811. |
| [16] | Keshkamat, S.S.; J. M. Looijenand M.H.P. Zuidgeest 2009. The formulation and evaluation of transport route planning alternatives: a spatial decision support system for the Via Baltica project, Poland J. Transp. Geogr., 17, 54-64. |
| [17] | Laskar, A. 2003. Integrating GIS and Multi Criteria Decision making Techniques for land Resource planning. M.Sc. Thesis, International Institute for geo-Information Science and Earth Observation, Enschede, The Netherlands. |
| [18] | Lin, X. and Y. Zu 2013. Multi-criteria GIS-Based Procedure for Coffee Shop Location Decision. Hogskolan I Gavle, Degree Project Thesis, Bachelor, 15hp Geomatics, Study Programme in Geomatics. |
| [19] | Malczewski and Rinner 2015. Multicriteria Decision Analysis in Geographic Information Science, ISBN: 978-3-540-74756-7 (Print) 978-3-540-74757-4 (Online). |
| [20] | Rezaie, F. and M. Panahi 2015. GIS Modeling of Seismic Vulnerability of Residential Fabrics Considering Geotechnical, Structural, Social and Physical Distance Indicators in Tehran Using Multi-Criteria Decision-Making Techniques. Natural Hazards and Earth System Science, 15, 461–474. |
| [21] | Saaty, T. 1977. A scaling method for priorities in hierarchical structures. Journal of Mathematical Psychology, 15, 231-281. |
| [22] | Shaker and Salah [2015] Towards a good urban development plan in Sinai through land site suitability maps Regional Conference on Surveying & Development Sharm El-Sheikh, Egypt, 3-6 October 2015. |
| [23] | Sicat, S.; E. Carranza and U. Nidumolu 2005. Fuzzy modeling of farmers’ knowledge for land suitability classification. Agricultural Systems, 83, 49-75. |
| [24] | Simsek, C.; C.Kincal and O. Gunduz 2006. A solid waste disposal site selection procedure based on groundwater vulnerability mapping Environ. Geol., 49, 620-633. |
| [25] | Silva, S.; L. Almeida and L. Dias 2014. Biogas plants site selection integrating Multi criteria Decision Aid methods and GIS techniques: A case study in a Portuguese region. Biomass and Bioenergy, 71, 58-68. |

 Abstract
 Reference
 Full-Text PDF
 Full-text HTML