Maurice Onyango Oyugi1, Victor A. O. Odenyo2, Faith N. Karanja3
1Department of Architecture and Building Science, University of Nairobi, Nairobi, Kenya
2Department of Environmental Monitoring, Planning and Management, University of Eldoret, Eldoret, Kenya
3Department of Geospatial and Space Technology, University of Nairobi, Nairobi, Kenya
Correspondence to: Maurice Onyango Oyugi, Department of Architecture and Building Science, University of Nairobi, Nairobi, Kenya.
| Email: |  |
Copyright © 2017 Scientific & Academic Publishing. All Rights Reserved.
This work is licensed under the Creative Commons Attribution International License (CC BY).
http://creativecommons.org/licenses/by/4.0/

Abstract
Despite postulations on the correlation between urbanisation rate, land use and land covers changes as well as sustainable urban development, majority of such correlations are descriptive. However, it is the quantitative models linking the same which have a niche in aiding the evolution of sustainable urban development strategies. This has to begin with spatio-temporal analysis of land uses, land covers and the detection of the temporal changes. The above being the case, this study analyzed the land use and cover changes for Nairobi at different epochs in order to detect the changes that have taken place and subsequently to predict the environmental implications of the same. The objectives of the study were to create a land use and land cover schema for Nairobi city for the period between the years 1988 to 2015, to quantify the nature, trend, rate of land use and land cover dynamics over the years, to establish the land consumption rate and land absorption coefficient trends for the city within the study period and to postulate the environmental implications of the changes. This study was aided by Digital Image Processing of multispectral Landsat TM imageries of the years 1988 and 1995, Landsat ETM+ imageries of the years 2000, 2005, 2010 and 2015 together with topographical maps of the city and other secondary information such as the city’s population for the years between 1988 and 2015. Unsupervised classification approach was used with accuracies ranging from 87% to 90%. The study establishes that while areas of the city under urban built-up, open and transitional areas as well as forest covers steadily increased during the study period, rangelands, agricultural, grass, secondary growth and riparian vegetations have declined. This is partially attributed to the population growth in the peri-urban areas which has led to land fragmentations to acreages which are not agriculturally viable thus the conversions of the agricultural lands to urban built-up users such as residential, industrial and commercial developments. This implies that the city has continued to experience increased Land Consumption Rate and Absorption Coefficient which confirms that as opposed to internal densification, the city’s growth has been characterised by urban sprawl.
Keywords:
Urbanisation,Land Use, Land Cover, Geospatial System and Environmental Quality
Cite this paper: Maurice Onyango Oyugi, Victor A. O. Odenyo, Faith N. Karanja, The Implications of Land Use and Land Cover Dynamics on the Environmental Quality of Nairobi City, Kenya, American Journal of Geographic Information System, Vol. 6 No. 3, 2017, pp. 111-127. doi: 10.5923/j.ajgis.20170603.04.
1. Introduction
Land uses compete for strategic locations within the cities and in the process of accommodating the same; cities either experience urban sprawl or re-densification which alters the urban environmental quality. For example, land clearing for industrial and transportation channel developments reduces vegetation covers which are carbon sinks consequently raising the concentrations of air pollutants as well as altering air flow, energy and water balances. Therefore, urbanization significantly contributes to global warming and climate change. Since majority of the theories correlating the phenomena are descriptive, there is need to reengineer the same through incorporation of deterministic quantitative models which aids in the projection of the phenomena. To model the correlation between urbanisation, global warming and climate change, two indicators of urbanisation notably the Land Consumption Rate (L.C.R) and Land Absorption Coefficient (L.A.C) for the city are fundamental. While L.C.R which is a measure of the urban compactness indicates progressive spatial expansion of the urban built-up areas (the urban sprawl) into the peripheries, L.A.C is a measure of change in consumption of a given land use or land cover by each unit increase in urban population. It is postulated that cities with higher urbanisation rates such as Nairobi are associated with high L.C.R and L.A.C as well as contributions to global warming and climate change.
2. The Aim and Objectives of the Study
The aim of this study was to analyse the implications of land use and land cover changes experienced in Nairobi city between the years 1988 to 2015. Accordingly, the study was geared towards fulfilling the following objectives: -i. To create a land use and land cover schema for Nairobi city for the period between the years 1988 to 2015,ii. To quantify the trend, nature and rate of land use and land cover dynamics over the years,iii. To establish the land consumption rate and land absorption coefficient trends for the city within the study period, iv. To postulate the environmental implications of the changes.
3. Methods and Materials
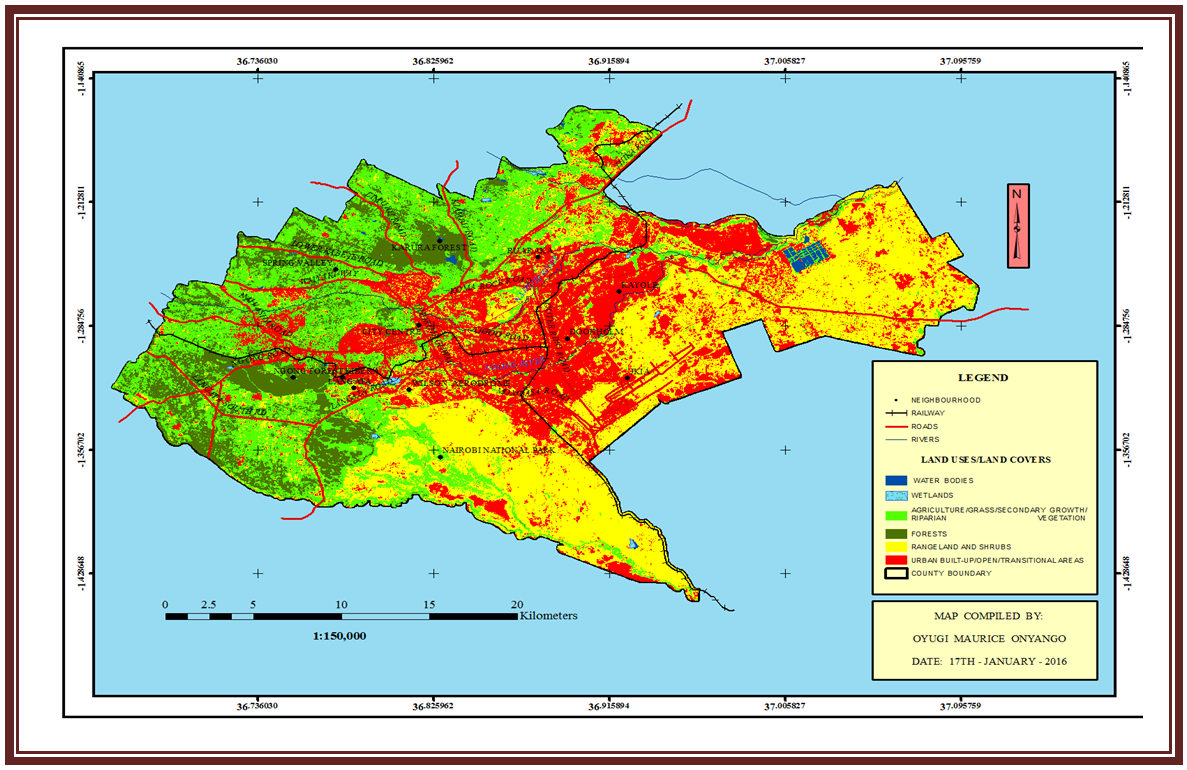
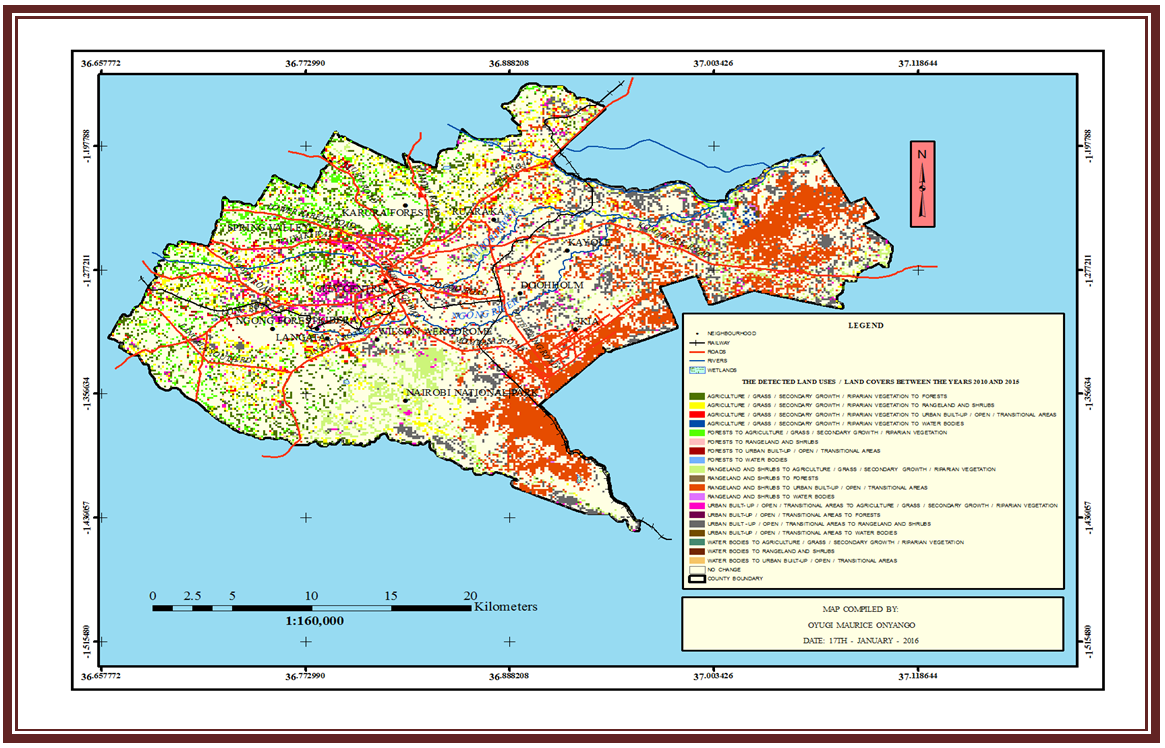
Study methods or research design refers to the arrangement of conditions for collection and analysis of data as well as presentation of the findings in a valid, reliable, economic and relevant manner to the research purpose. This study adopted both descriptive and quantitative designs. While descriptive designs are concerned with explaining who, what, when and how a phenomenon occurs over space, quantitative designs explains how various factors affecting an occurrence of a phenomenon are related (Babbie, 2002; Cooper et al., 2003). In this study, the entire land surface constituting the jurisdictions of the Nairobi City County Government which is bounded within the longitudes 36° 40’ and 37° 10’E and between latitudes 1° 09’ and 1° 28’S covering an area of 716 km2 constituted the target population. Sampling was inappropriate for the imageries used in the study had full spatial coverage of the city.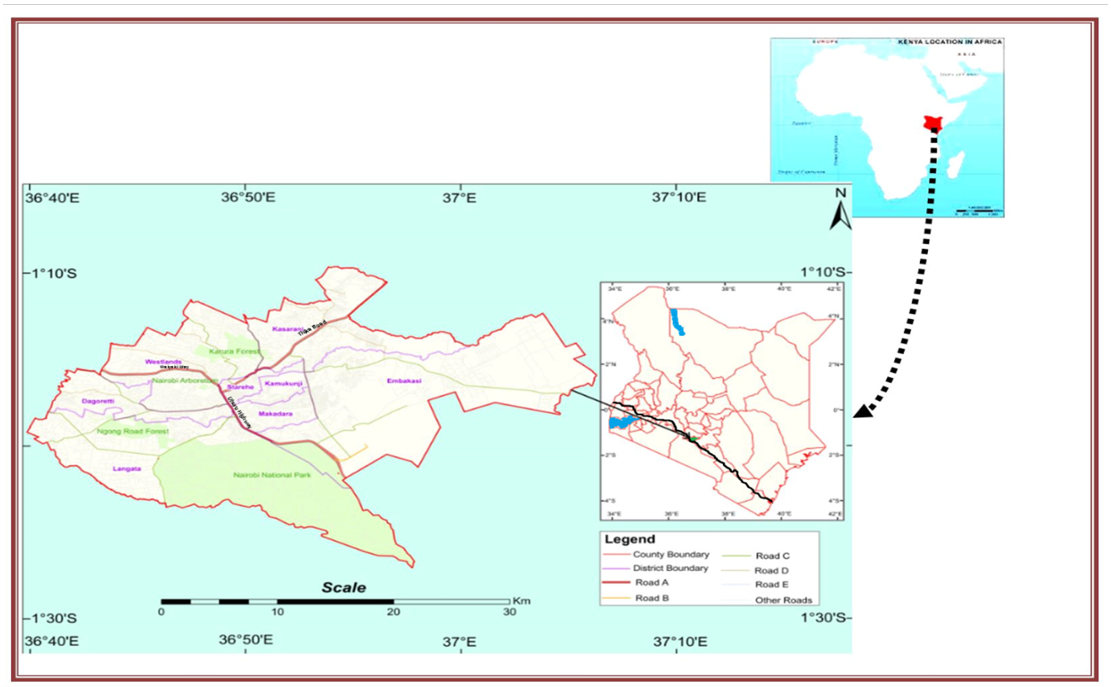 | Figure 1. The Study Area |
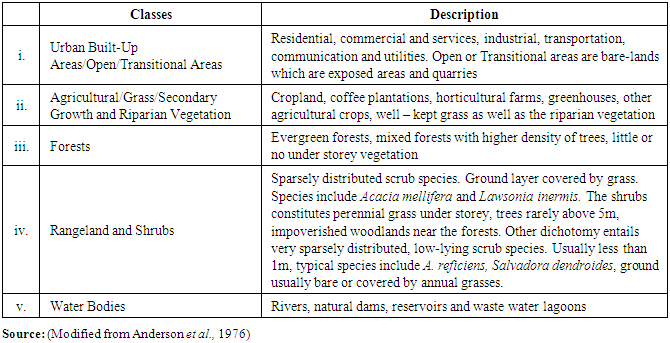
To evaluate the nature, magnitude, pattern and trends of land use and land cover changes for the years between 1988 and 2015, this study utilised cloud-free satellite imageries of the city as follows:- Landsat TM imageries - Band 2 (Green: 0.52μm – 0.60 μm), Band 3 (Red: 0.63μm - 0.69μm) and Band 4 (the NIR: 0.76μm – 0.90μm) for the years 1988 and 1995 while Landsat ETM+ imageries at the same bands were used for the years 2000, 2005, 2010 and 2015. In both the cases, Band combinations of Red, Green and Near Infra-Red were used due to the combination’s appropriateness in facilitating discrimination of urban built-up areas, water bodies, vegetation categories as well the ease at which it enables land use and land cover change detections. The swath for the Landsat TM and Landsat ETM+ is 185 km while the spatial resolutions of the bands under consideration are 30m. Therefore, both the spatial and spectral resolutions of the procured imageries matched. While the Landsat imageries used in this study were procured from the archives of the European Space Agency through the Nairobi based Regional Centre for Mapping of Resources for Development (RCMRD), secondary information on the city’s population for the years between 1988 and 2015 were sourced from the National Economic Surveys and the National Population Census Reports and were used for the analysis of L.C.R and L.A.C. Other secondary information used in this study included 1: 50,000 scale topographical maps of the city obtained from the Survey of Kenya (SoK) as well as various planning reports obtained from the Planning Department of the Nairobi City County Government. Unsupervised digital image processing technique was used in land use and land cover classification and change detection. The technique relies on expertise knowledge on spectral and radiometric characteristics of land uses and land covers. This procedure involved image pre-processing, design of classification schema, image classification, accuracy assessment and change detection. The pre-processing procedures were undertaken to correct for geometric and radiometric errors and to calibrate the imageries to reflectance percentages of various surface objects. The imageries were geo-referenced using 11 Ground Control Points whose coordinates were obtained from the 1:50,000 scale topographical maps of the study area. Further procedures involved the extraction of the study area from the imageries using ARCGIS 10.3 Software, for the procured imageries covered the city (the study area) and its environs. The extracted imageries were then exported to ILWIS 3.6 Academic environment in TIFF Format. Upon launching the extracted temporal imageries of the city in the ILWIS 3.6 Academic environment, colour separation operations were undertaken. This was followed by rebuilding of the colour composites using true-colour band combination (Bands 4-3-2) which facilitates visualisation and identification of the imagery features. Other operations undertaken to enable the assignment of the classification schema to the pixels after rebuilding the colour composites of the extracted imageries were creation of map list, sample set and classification domain. Upon assigning 2500 number of pixels per land use and land cover category, the classified imageries were assessed for accuracy through crossing the same with sample sets. The accuracies of the classified imageries were further validated through ground-truthings of which coordinates of selected samples were identified using Global Positioning System (GPS) alongside the topographical maps of the study area. Maps generated from this analysis met the minimum USGS and Congalton (1991) accuracy requirement of at least 85% and above. The classified temporal imageries were then exported back to ARCGIS 10.3 environment for polygonisation, layout design and labelling.Cross matrix function of ILWIS 3.6 Academic Software was used for land use and land cover change detection. This involved crossing the classified imageries of the years 1988 and 1995, 1995 and 2000, 2000 and 2005, 2005 and 2010 as well as the years 2010 and 2015. The cross matrix operation culminated into three outputs namely; tables showing the nature of the detected changes, histogram transformation revealing magnitude (percentage) of the detected changes and the raster imageries depicting the spatial distribution of the same. The raster imageries of the detected changes were further exported to ARCGIS 10.3 environment for polygonisation and layout designs. As illustrated by Table 1, a modified version of the Anderson et al., (1976) land use and land cover classification schema was adopted by this study. The need to consistently discriminate the land uses and land covers irrespective of seasonal variations informed the decision on the five land use and land cover classes used in the schema. This is further supported by Yang and Lo (2002) who notes that when undertaking digital image processing for land use and land cover variations, there is need to limit the number of land use and land cover classes used in the schema so as to avoid the spectral confusion which may occur due to several land uses and land covers having closer spectral responses.Table 1. Land Use and Land Cover Classification Schema
 |
| |
|
According to Yeates and Garner (1976), L.C.R and L.A.C functions are respectively stated as:-  Where:-A = Areal extent of the city under a given land use/land cover in hectares.P = Population of the city at a particular date.
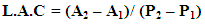 Where:- A1 and A2 are the areal extents of the city under a given land use/land cover in hectares for the early and later years.P1 and P2 are population figures of the city for the early and later years. The L.C.R which is a measure of the urban compactness indicates progressive spatial expansion of the urban built-up areas (the urban sprawl) while L.A.C is a measure of change in consumption of a given land use or land cover by each unit increase in urban population. The population growth rates used for the calculations of L.C.R and L.A.C were 4.7% per annum for the years between 1980 to 1989 and 4.5% per annum for the years between 1990 to 2015 (Government of Kenya, 2012). The below stated function was used for population projections.
 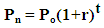 Where: -Pn = Estimated population at a given yearPo = Base year populationr = Growth ratet = Number of years projecting forThe classified land uses and land covers for the years 1988, 1995, 2000, 2005, 2010 and 2015 as well as the detected changes are presented inform of maps. While information on the magnitude of land uses and land covers for the years under consideration and the detected changes are summarized inform of tables, graphs are used to present the temporal trends of land uses and land covers. The L.C.R and L.A.C trends are also presented in tabular and graphical formats.
4. Findings and Discussions
Land Use and Land Cover Dynamics of Nairobi City for the Period between 1988 and 2015As earlier stated, post-classification comparison approach was employed for the detection of land use and land cover changes. The main advantage of this method is its capability of providing multiple information on the nature, magnitude, trend, pattern and rate of changes that occur over a given period of time. Towards this end, the classified land use and land cover maps of Nairobi for the years 1988, 1995, 2000 2005, 2010 and 2015 are shown in Figures 2, 3, 4, 5, 6 and 7 respectively. While quantification of land uses and land covers is summarized in Table 2, trends of the same are presented in Figure 8. 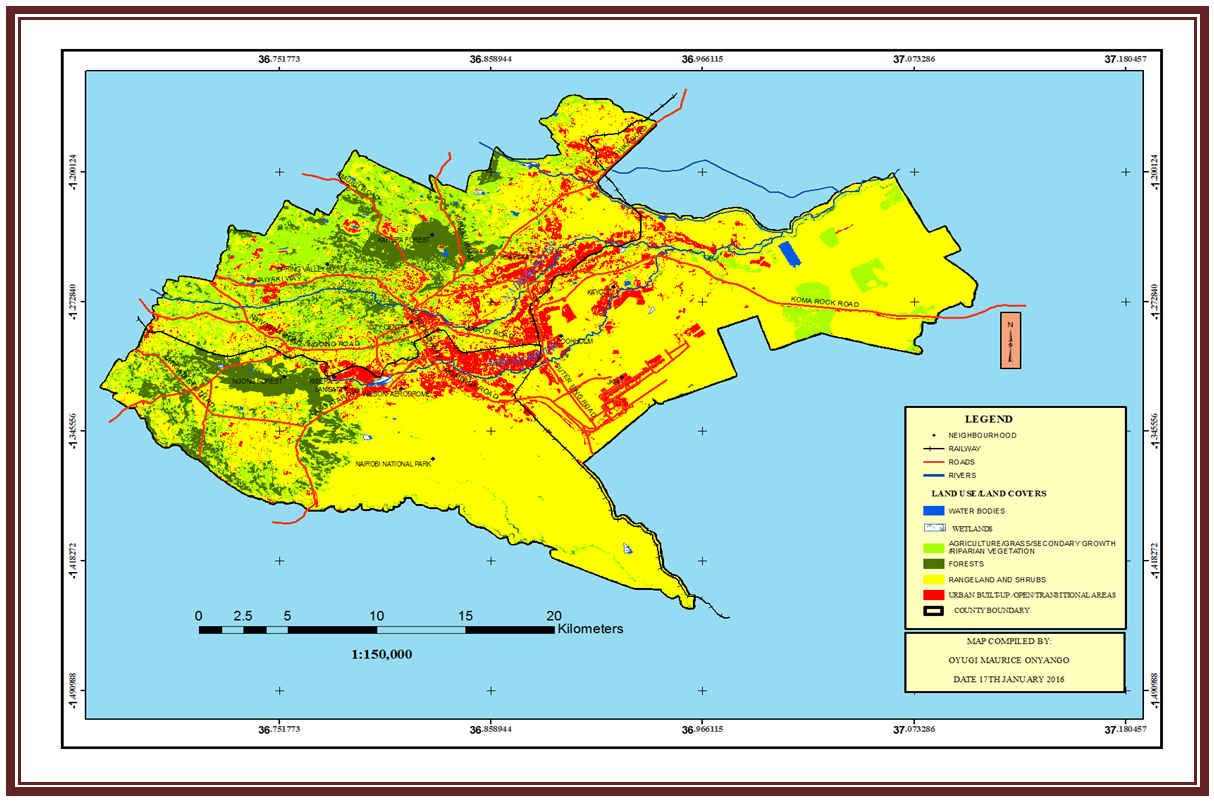 | Figure 2. Land Use and Land Cover Map of Nairobi for the Year 1988 |
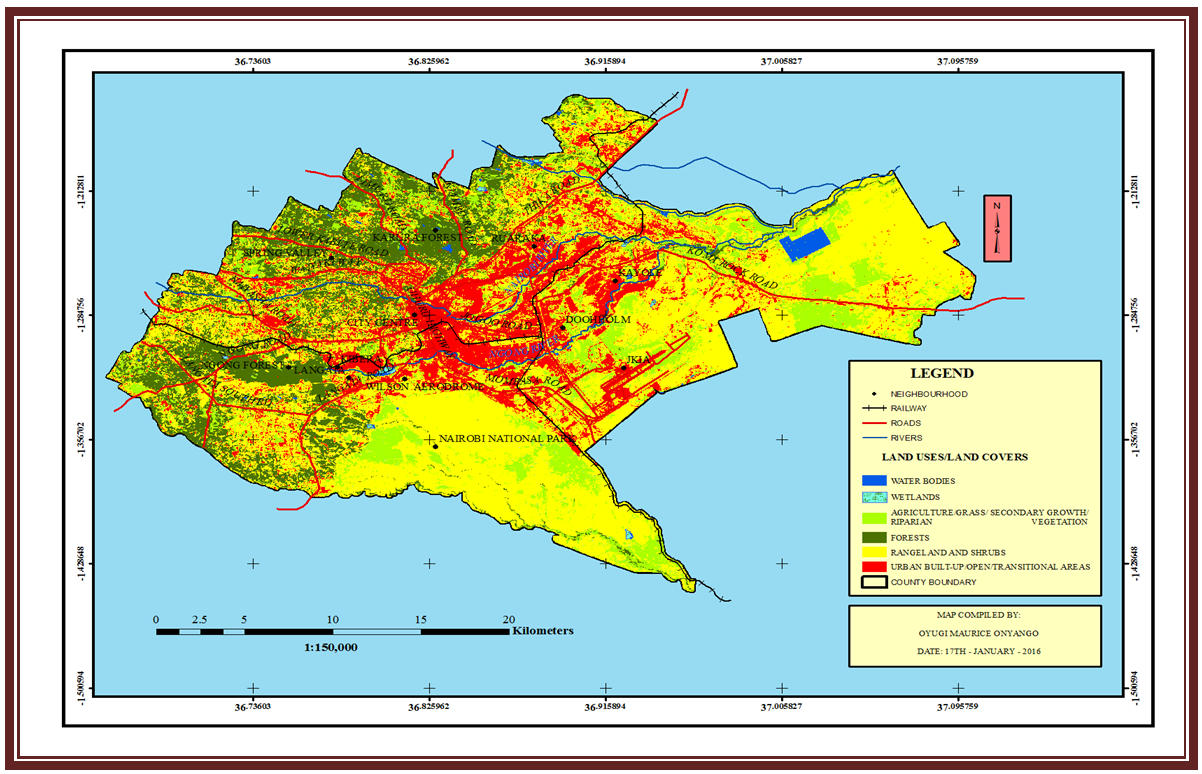 | Figure 3. Land Use and Land Cover Map of Nairobi for the Year 1995 |
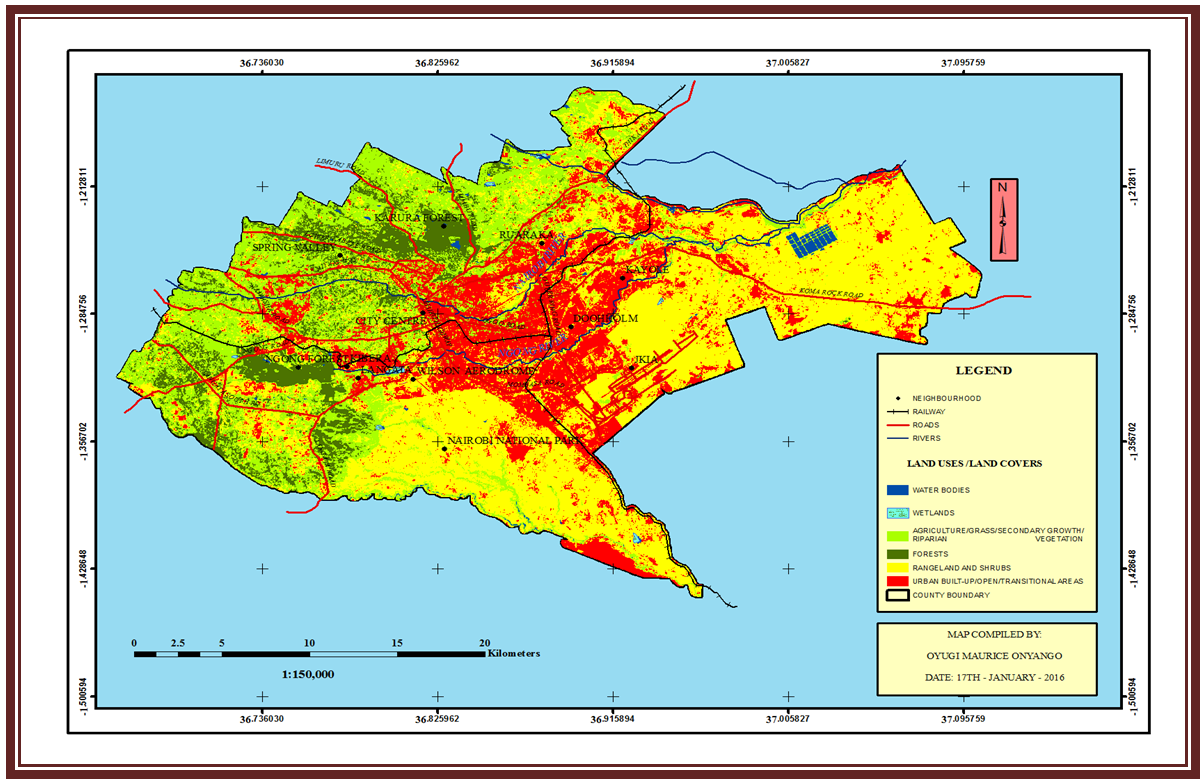 | Figure 4. Land Use and Land Cover Map of Nairobi for the Year 2000 |
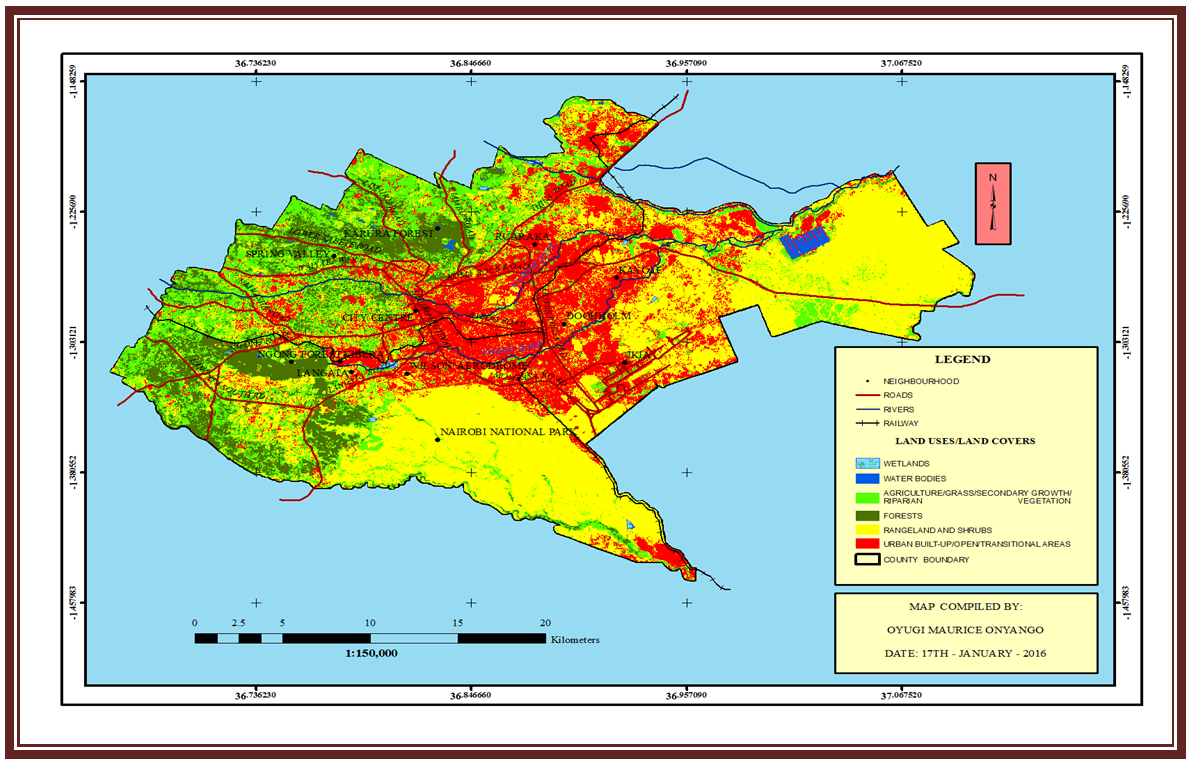 | Figure 5. Land Use and Land Cover Map of Nairobi for the Year 2005 |
 | Figure 6. Land Use and Land Cover Map of Nairobi for the Year 2010 |
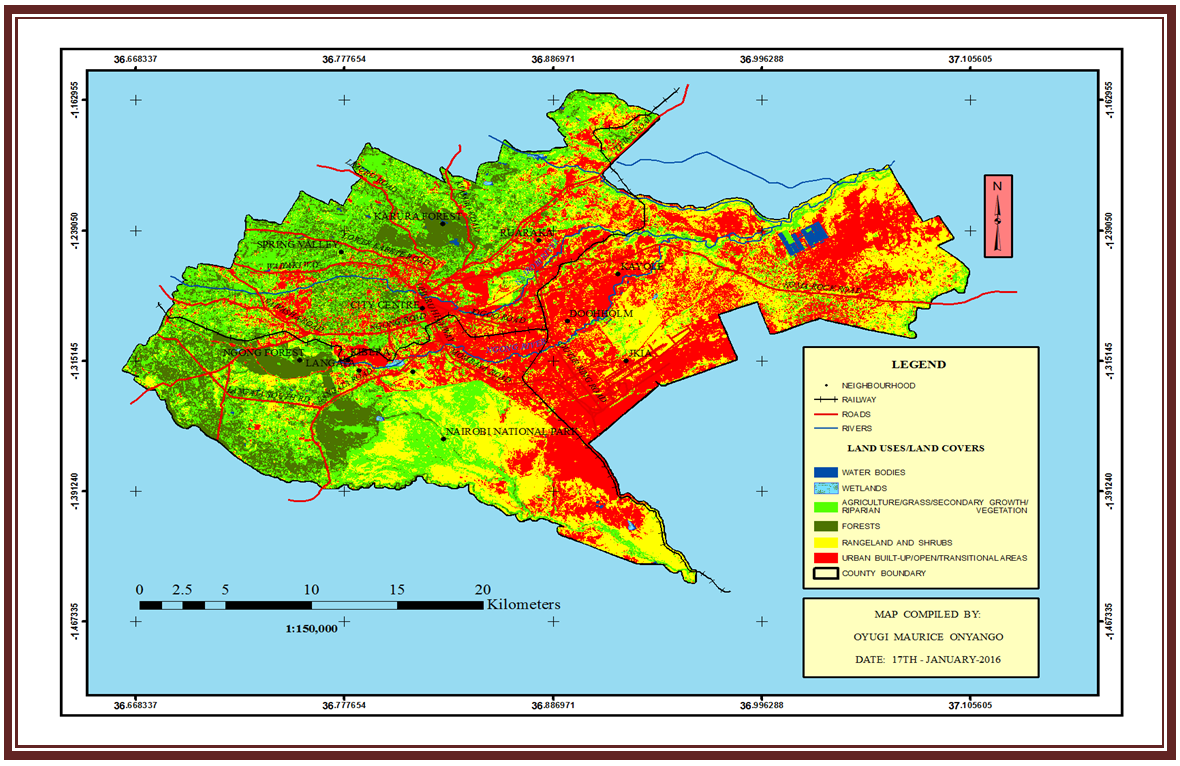 | Figure 7. Land Use and Land Cover Map of Nairobi for the Year 2015 |
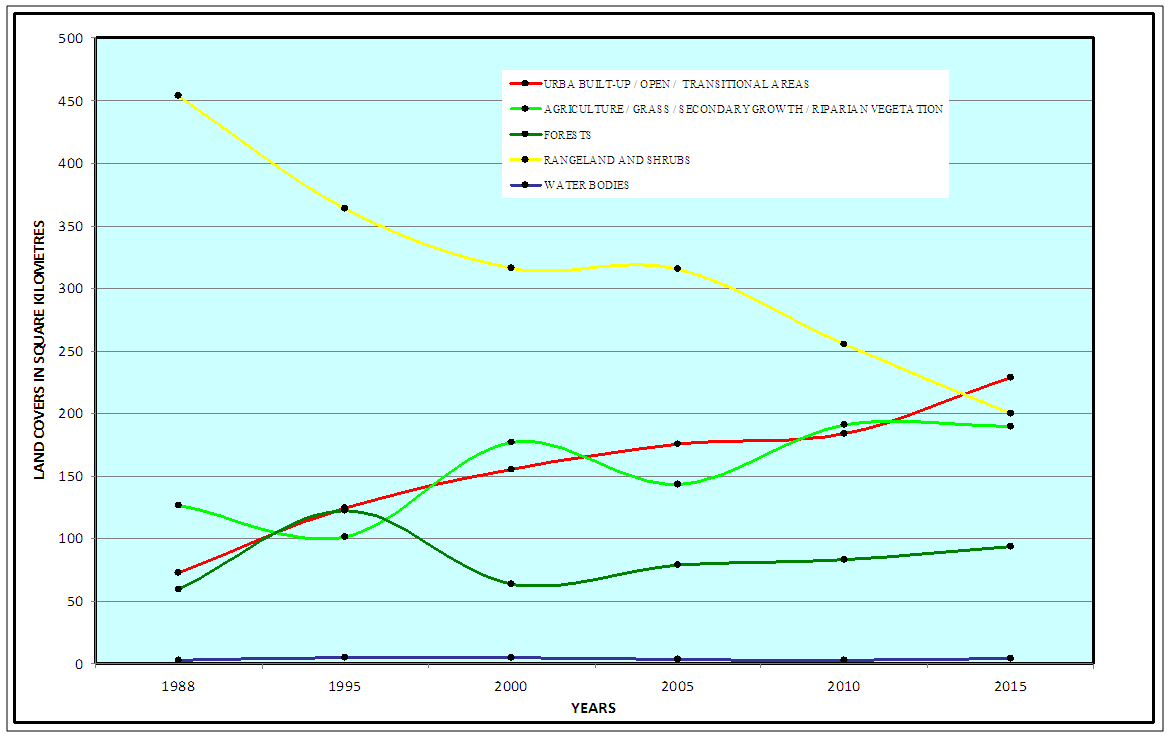 | Figure 8. Land Use and Land Cover Change Trends in Nairobi City between the Years 1988 to 2015. Source: (Researcher, 2017) |
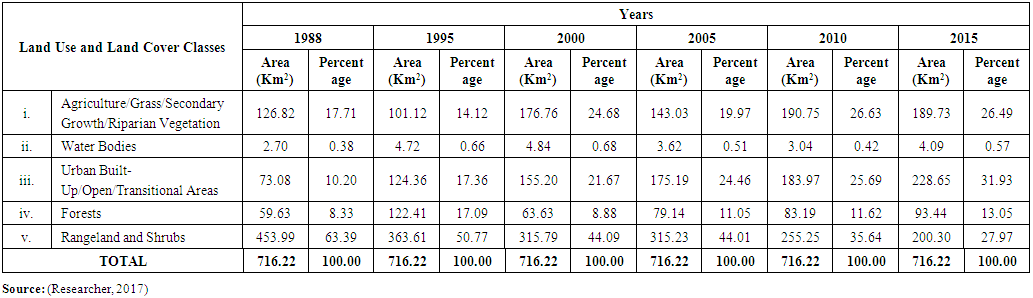 | Table 2. Land Use and Land Cover Types in Nairobi City between the Years 1988 to 2015 |
This study reveals that the area of the city under urban built-up, open and transitional land cover have increased from 73.08 km2 in the year 1988 to 228.65 km2 in the year 2015. While agricultural, grass, secondary growth and riparian vegetation which occupied 126.82 km2 of the city in the year 1988 have marginally increased to 189.73 km2 in the year 2015; forest cover have shown mixed gains and loss. In the year 1988, the area of the city under the forest cover was 59.63 km2. This increased to 122.41 km2 in the year 1995 and thereafter declined by approximately 50% reaching 63.63 km2 in the year 2000. The decline is attributed to the indiscriminate extraction of forest resources and clearance of the same for urban developments which characterised the periods between the years 1995 to 2002. This situation was reversed in the year 2003 when the new government re-emphasised and re-energised strategies geared towards increasing the forest cover in the country. Such strategies included the degazettement and clearance of illegal structures within the forest reserves. This has since made the area of the city under forest cover to gradually increase from 63.63 km2 in the year 2000 to 93.44 km2 in the year 2015. The area of the city under rangeland and shrub vegetation cover have steadily declined from the year 1988 when it covered 453.99 km2 of the city to 200.30 km2 in the year 2015. As illustrated by Figures 9 to 13 and Table 3, major land use and land cover conversions took place within the study period. Notably, there has been a marked decline in agricultural, grass, secondary growth, riparian, rangeland and shrubs as well as forest covers which is attributed to the expansion of the urban built-up, open and transitional areas or the urban sprawl. The steady decline in the ratio of the city under vegetation cover to the area under urban built-up, open and transitional lands have significant implications on the urban air pollution levels, surface temperature values and other environmental quality parameters.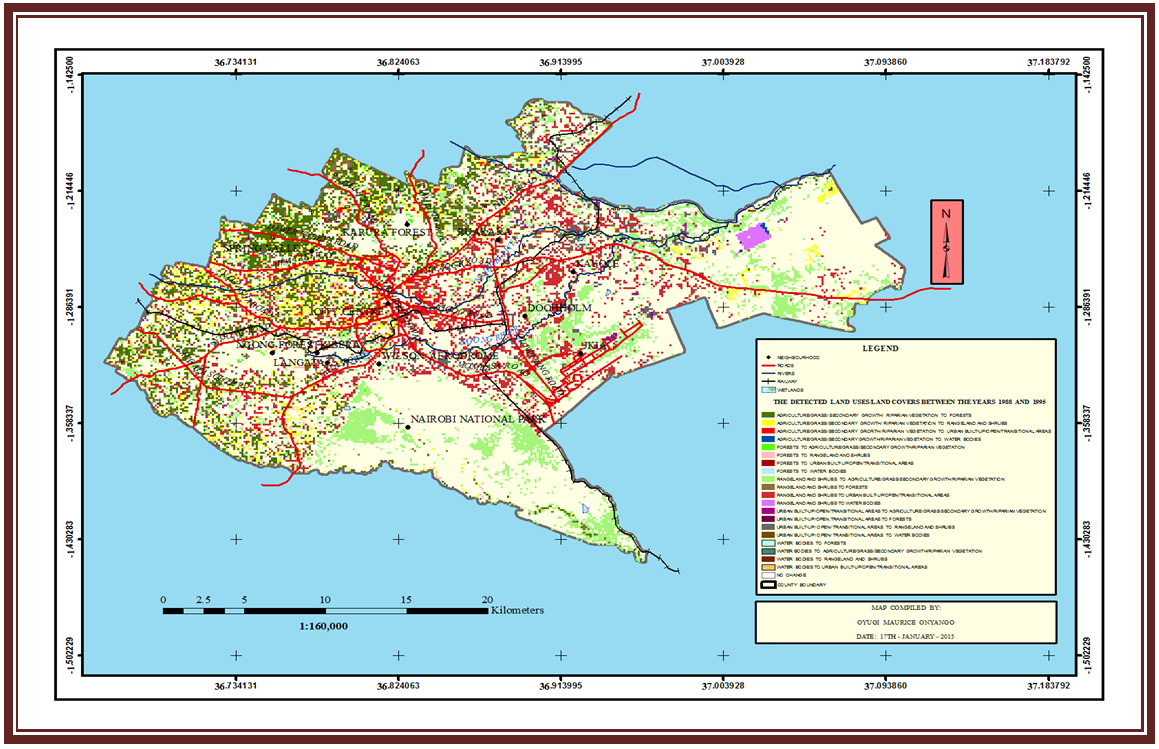 | Figure 9. The Detected Land Use and Land Cover Changes between the Years 1988 and 1995 |
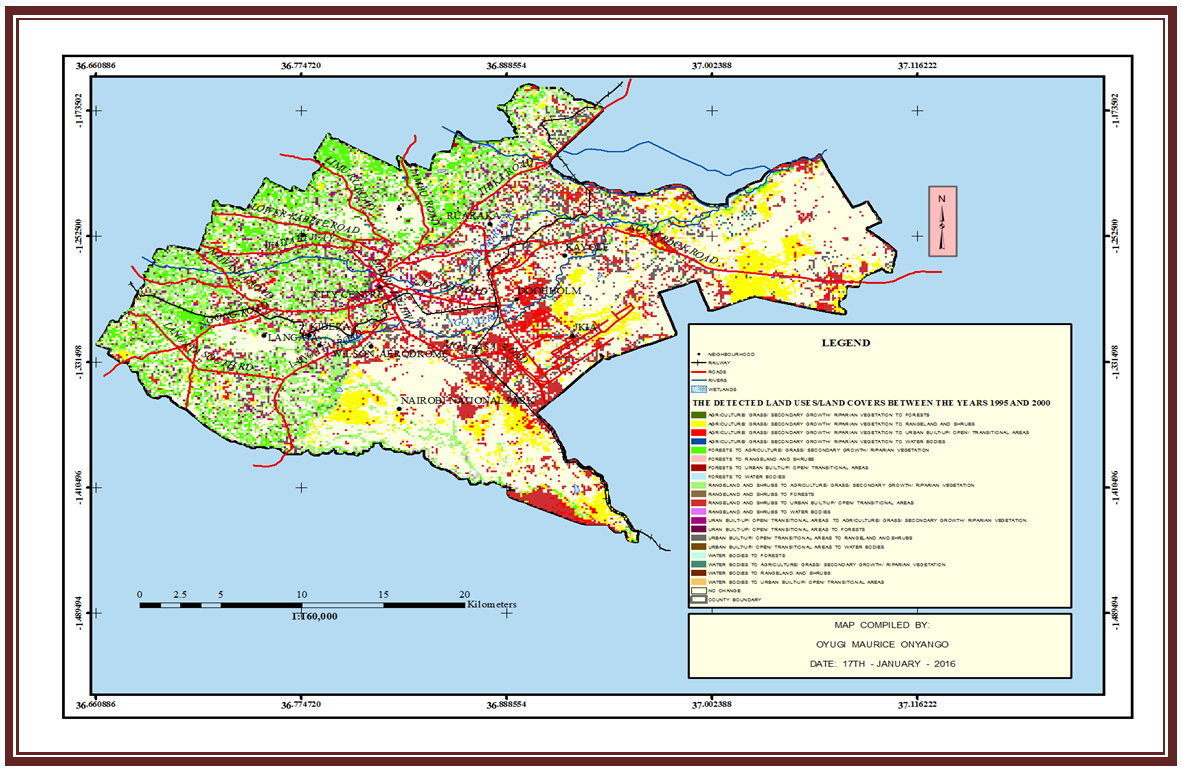 | Figure 10. The Detected Land Use and Land Cover Changes between the Years 1995 and 2000 |
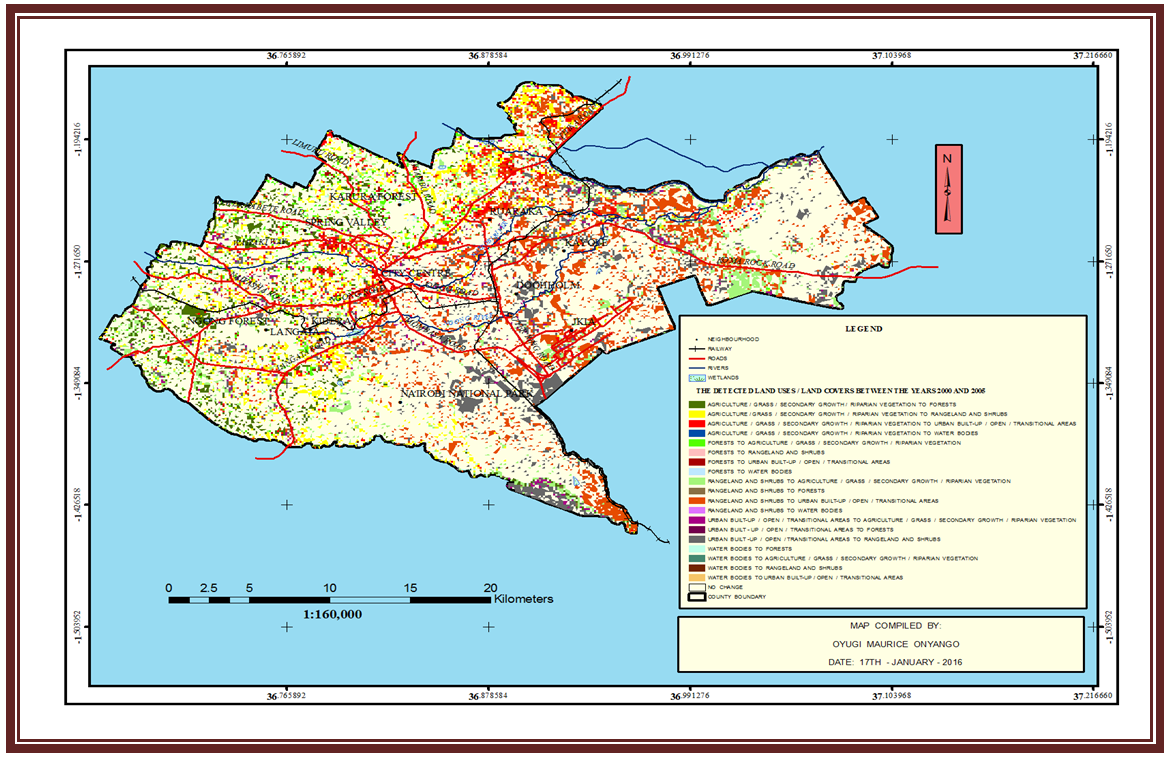 | Figure 11. The Detected Land Use and Land Cover Changes between the Years 2000 and 2005 |
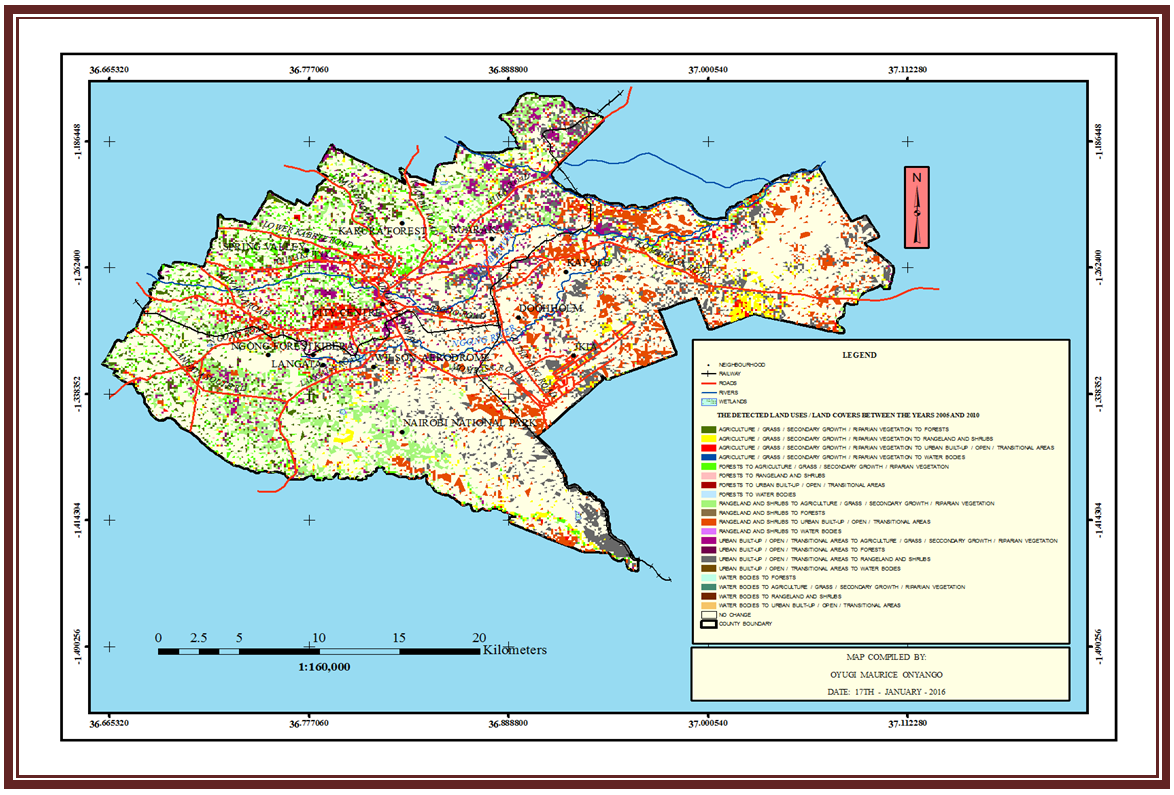 | Figure 12. The Detected Land Use and Land Cover Changes between the Years 2005 and 2010 |
 | Figure 13. The Detected Land Use and Land Cover Changes between the Years 2010 and 2015 |
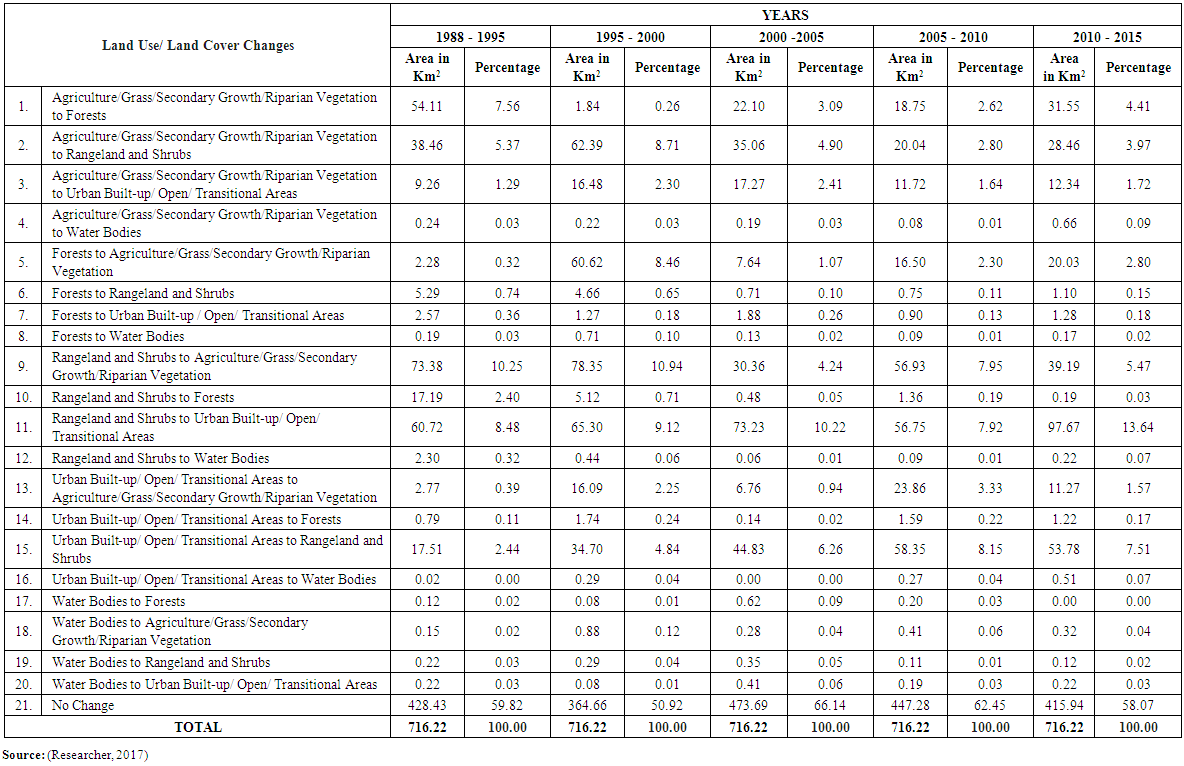 | Table 3. Major Land Use and Land Cover Changes in the City for Different Epochs |
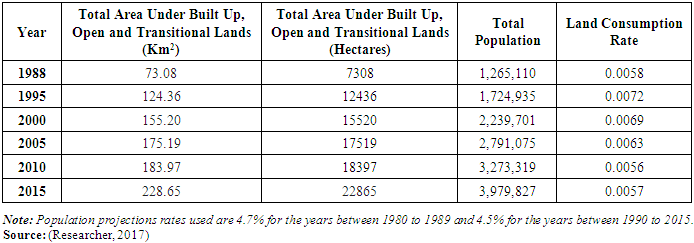
The spatial pattern of the urban sprawl or the expansion of the urban built-up, open and transitional areas exhibits variations. The expansion has not been even in all the directions of the city for it has occurred relatively faster but with discontinuous patches of built-up, open and transitional areas in zones along Thika, Kangundo, Koma-Rock and Mombasa Roads. This has been occasioned by the distribution of the transportation arterials and the ad hoc nature of planning which has characterised the city over the years. The ad hoc nature of planning has encouraged rapid revisions of land use zoning policies and regulations (minimum plot sizes, plot ratios and coverages), land speculations as well as land use and land cover changes. While the revisions have tended to favour increased development densities, conversions of productive agricultural lands to residential, industrial and commercial developments, the distribution of transportation arteries have significantly determined the nature, magnitude, trend, pattern and rate of urban development and the distribution of economic activities. This has contributed to the emergence of a hybrid of concentric and sector models of spatial structure characterised by the city having a major Central Business District from which satellite Central Business Districts revolve around. The urban agriculture in Nairobi can be categorised as either small-scale crop gardening or the peri -urban agriculture. While the small scale gardens which require limited spaces are found along roadsides, within flood plains and high density residential zones of the central parts of the city, peri-urban agriculture are established where land holdings are relatively large enough to accommodate cultivation and livestock rearing. The decline in the percentage of land under agriculture in the study period is partly attributed to the population growth in the peri-urban areas which leads to land fragmentation to acreages which are not agriculturally viable. This necessitates conversion of the agricultural land to urban built-up users such as residential, industrial and commercial developments. This study further reveals marked encroachment and degradation of the gazetted and protected areas such as the forests and the Nairobi National Game Park by the urban built-up developments and other anthropogenic activities such as grazing. This has reduced the forest covers to either rangeland and shrubs or open and transitional areas. The anthropogenic encroachments have over the years affected water supply, the availability of wildlife and overall environmental quality of the city.Further to the degradation of the natural habitats, encroachments into the natural ecosystems have also brought unprecedented fragmentation and isolation of the remaining natural ecosystems. For example, wildlife migration corridor towards Kitengela along the Nairobi National Park has been encroached into by the urban built-up developments. The encroachments have been occasioned by ineffective development control and environmental protection policies operational in the city. As such, it is common to find residential properties being developed in the city with little effort at either expanding or providing infrastructure such as roads, water supply and sewerage (Hirst and Lamba, 1994). Areas experiencing the most degradation are the informal settlements and the peri-urban areas to the eastern part of the city along Kagundo, Koma-Rock and Thika roads where the development control measures are not strongly enforced. Since developments and expansions of the urban built-up areas are made possible through the exploitation of the environmental resources such as the conversions of the rangeland and shrubs, forests, agricultural, grass, secondary growth and riparian vegetation areas to built up areas, such conversions and/or expansions creates pressure for the exploitation of land within the city such that even areas susceptible to flooding and landslides are often developed (Lamba, 1994). Analysis of land use and land cover for the city demonstrates that most of the informal settlements are located in the urban marginal lands such as flood plains, abandoned quarries, river banks and next to dump sites which predispose residents of such neighbourhoods to environmental disasters. Over the years, quarrying activities which are a major source of building materials within the city have played a significant role in altering the urban morphology of the city, particularly in the eastern and north-eastern parts of the city where they are scattered. With increased economic growth between the years 2002 to 2015, the city has experienced increased demand for residential facilities subsequently up-scaling construction and quarrying activities. This has triggered rapid conversions of rangeland and shrubs, agricultural, grassland and riparian vegetations to urban built-up, open and transitional (quarry) lands in the eastern and north-eastern parts of the city. Often, the debris and the loose soils from the quarries find their way into the drainage systems when it rains. It is therefore evident that the rate at which land uses and land covers are converting to built-up, open and transitional lands in the eastern, north-eastern and southern parts of the city as occasioned by the increased construction and quarrying activities is unprecedented. Land Consumption Rate and Land Absorption Coefficients for the CityAs earlier stated, Land Consumption Rate is a measure of urban compactness which indicates progressive spatial expansion of a city as evidenced by increase in the amount of land under urban built-up, open and transitional areas for the successive years of study. Contrary to the above, Land Absorption Coefficient is a measure of change in the consumption of a given land use and land cover class within a specified time period by each unit increase in urban population. The findings of the analysis on the Land Consumption Rate and Land Absorption Coefficient for the city for the period covering years between 1988 and 2015 are presented in Tables 4 and 5 respectively.Table 4. Land Consumption Rate
 |
| |
|
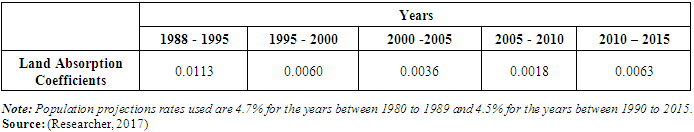
Table 5. Land Absorption Coefficient for the Built up, Open and Transitional areas of Nairobi between the Years 1988 to 2015
 |
| |
|
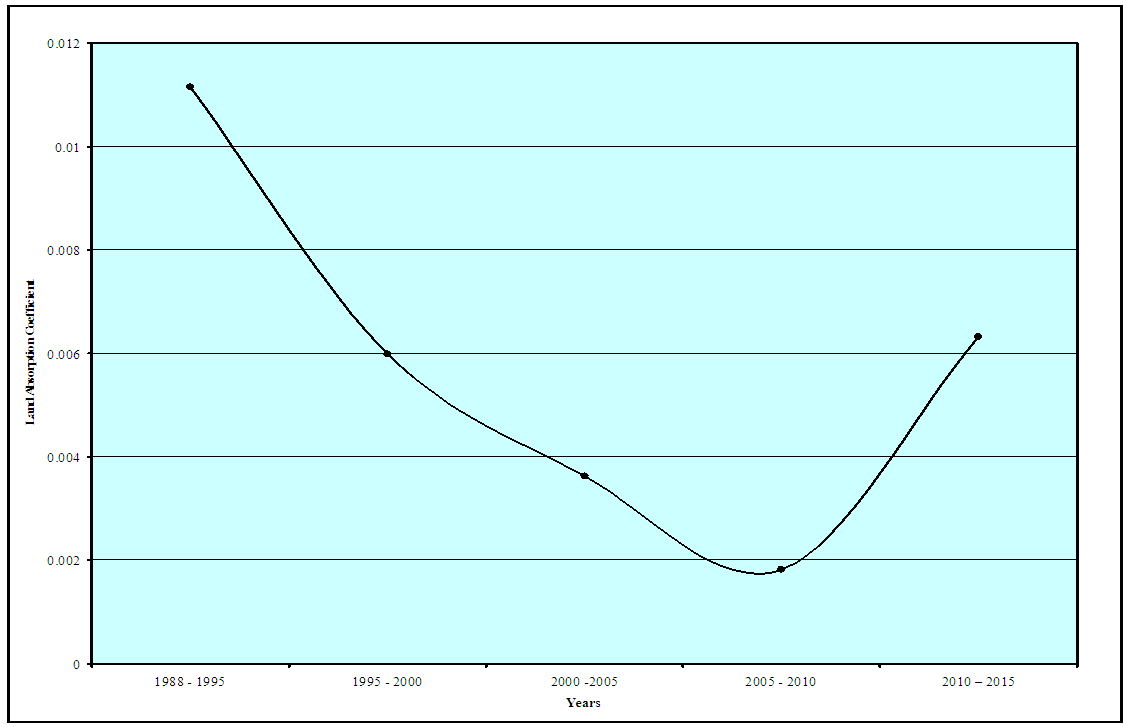
The environmental implications of L.C.R for a city such as Nairobi become clearer when it is interpreted in conjunction with L.A.C for the built-up, open and transitional areas.The analysis of the L.C.R and L.AC for the city illustrated by Figures 14 and 15 respectively reveals that the urban built-up, open and transitional areas have increasingly expanded to the peripheries. While the expansion was rapid between the years 1988 to 1998 and 2010 to 2015, the city grew through internal densification in the years between 1998 to 2005. The expansion has been rapid to the eastern, north-eastern and the southern parts of the city due to cheaper land and housing construction costs in the zones relative to other parts of the city. Increased public investments in infrastructure such as roads, water and electricity in what used to be urban peripheries have improved quality of life and attracted more people into the neighbourhoods. Another factor which has contributed to the spread of the built-up, open and transitional areas into what used to be urban peripheries is the persistent higher property and business taxes in the city centre. Since property and business taxes in the urban peripheries are relatively low, businesses which can no longer break even in the main business districts have been pushed to the urban peripheries where they have agglomerated into new satellite commercial centres even in the absence of policies encouraging the peripheral growth.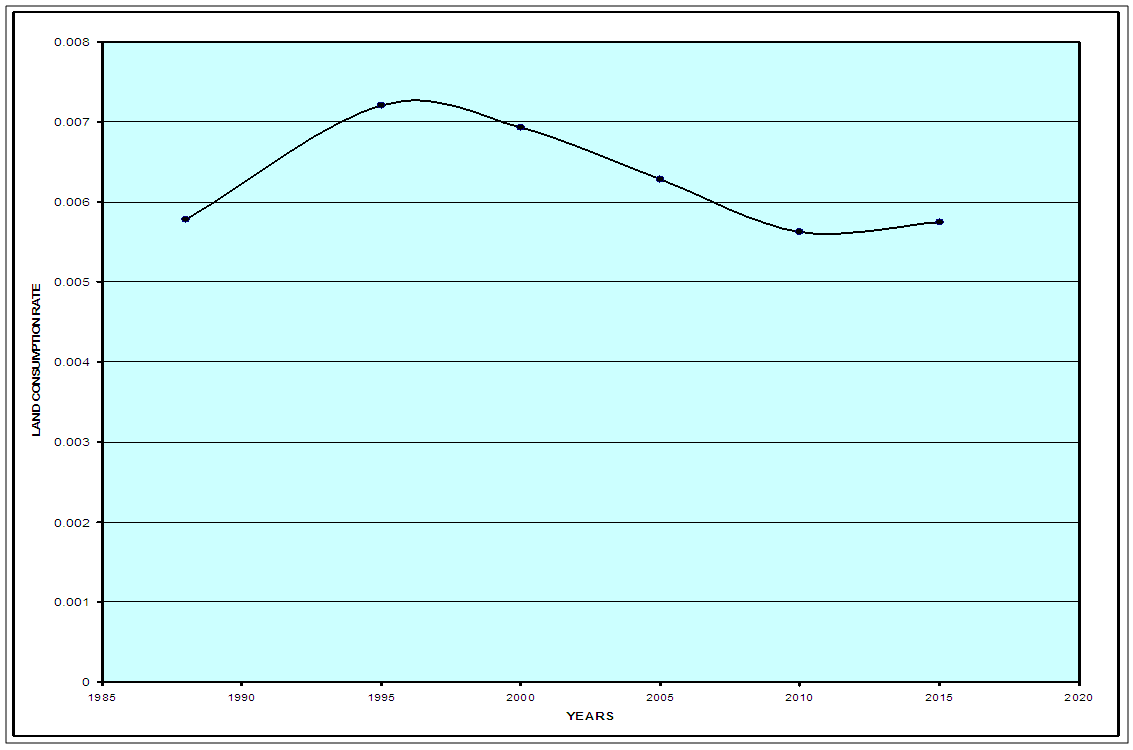 | Figure 14. The Land Consumption Rate of Nairobi between the Years 1988 to 2015. Source: (Researcher, 2017) |
 | Figure 15. Land Absorption Coefficient of Nairobi between the Years 1988 to 2015. Source: (Researcher, 2016) |
The establishment of satellite commercial centres as occasioned by the urban sprawl has enabled a large proportion of the city’s inhabitants to reside and work in the urban peripheries. This has compelled the city authority to spend more money in developing and/or extending roads and other infrastructure which presents an additional burden on the treasury and the citizens (Lopez, 2004). In the county government’s endeavour to provide community services to homes and businesses spread apart in the periphery, the authority is forced to increase tax burden to the residents (Benfield et al., 2008; Glaeser and Ward, 2009).The urban sprawl which manifests through increased built-up, open and transitional areas exacerbates paved surfaces, surface run-offs and urban floods. This has often led to loss of life and property, particularly in the informal settlements located on the flood plains. The built-up, open and transitional areas which are arenas of economic activities, generates organic, solid, oil and chemical wastes. Since these wastes are either suspended or dissolved in the surface run-offs, they find their way into the drainage channels causing eutrophication and algae blooms, which decreases the oxygen content of the riparian bodies, consequently lowering the biodiversity of the same. Further to increased paved surfaces reducing water percolation to recharge the groundwater, the organic matter, oil and chemical compounds generated from the built-up, open and transitional areas also infiltrate into the aquifers consequently contaminating the ground water supply. Therefore, regions of the city which depend on groundwater supply are likely to experience water crisis as the aquifer gets depleted and contaminated. Since surface run-offs leads to land compressions, increased incidences of the same is likely to exacerbate cracking of building foundations, slope collapses and land subsidence which are detrimental to the maintenance and functionality of water and sewerage networks, roads and railway. Further, increased water consumption for lawn watering and other landscaping activities which characterises the built-up environments is likely to be witnessed and will continue to strain the water supply in the city.The urban sprawl encourages the usage of motorised modes of transportation for the spread enables people to stay far from the work stations. This has increased the vehicular traffic which heightens the emissions of suspended particulate matter, carbon dioxide, sulphur dioxide and the carbon monoxide gases among others. The sprawl also lowers the percentage of land under the vegetation cover which moderates the urban surface temperatures as well as enhancing air quality. With continued depletion of the urban vegetation cover, the city has continued to experience increased urban heat island effects alongside compromised air quality (Patz and Balbus, 2003).Fragmentation of agricultural land parcels currently taking place in the urban peripheries has made it economically unviable to practice agriculture. This has occasioned conversion of agricultural lands to residential, commercial, industrial and institutional users, consequently leading to loss of fertile farmland, recreational spaces and deterioration of wetlands within the city and its environs. Further to wetlands mitigating flooding through moderating river regime, they also absorb chemicals, organic and suspended solid particulate matter in the surface run-offs. Therefore, without wetlands providing buffering to the natural drainage systems, the systems are likely to be contaminated and to often flood (Mundia and Aniya, 2006). Anthropogenic activities such as constructions and grazing encroaching into the Nairobi National Park and migratory corridors for the animals have profound effect on wildlife and the habitat at large. Overgrazing depletes vegetation cover which leads to mass migration and death of the wildlife during dry spells. The forests, meadows and wetlands within and around the National Park are also disappearing and being replaced by paved surfaces, buildings and sterile urban landscaping. The remaining habitat is becoming smaller, degraded and more fragmented, making survival for certain wildlife species very difficult as they try to reach breeding ponds, feeding and hibernation sites and establishing viable nesting grounds. This shall spell extinction for nearly 1,200 species of plants and animals currently found in the National Park of which some are categorised as endangered species. The park looses its scenic qualities that attract tourists as anthropogenic activities encroach into it. This will have direct impact on the national economy where tourism currently contributes 12.0% of the Gross Domestic Product (Government of Kenya, 2015).Factors Influencing Land Use and Land Cover Changes in NairobiLand use and land cover conversions within Nairobi is a culmination of the interactions between physiographic, demographic and socio-economic factors, key among which is the urbanisation rate of the city which has been rapid compared to other African cities. This is corroborated by Nairobi’s urbanisation rate averaging 4.7% per annum since independence as compared to 3.5% per annum for other major African cities (UN-Habitat, 2010; Obudho and Juma, 2002). Some of the factors which have acted in concert to influence the rapid urbanisation of the city include modest national economic growth and development, high rural-urban migration and natural population increase rates as well as the city’s favourable physiographic base.Rapid Economic Growth and DevelopmentPositive economic growth and development generally registered in Kenya and Nairobi in particular has contributed to higher urbanisation rate of the city. This is demonstrated by the city’s Gross Domestic Product (GDP) being £254 million in the year 1975, £645 million in the year 1985 and £1.1 billion in the year 1995. This rose to £1.5, £9.7 and £14.1 billions for the years 2002, 2010 and 2015 respectively (Government of Kenya, 2002; Government of Kenya, 2010; Government of Kenya, 2015). Since independence, Kenya’s economy has been characterized by mixed gains. For example from 1963 to 1973, the GDP grew at an annual average of 6.6%. This declined to 5.0% between the years 1980 and 1990 and further to 4.0% between the years 1991 to 1997. While similar economic stagnations persisted between the years 2000 to 2002 when the GDP grew by 1.15%, the year 2003 defined the country’s economic fortune when the GDP increased by 2.8%. In the year 2004 the growth increased to 4.3%. The economic recovery which has continued to gain ground since the year 2005 to date has realised an average growth rate of 5.2% per annum. Further to creating impetus for real estate developments, the economic growth and development has led to the establishments of more industries and expansions of the same within the city. This has subsequently led to the expansion of the built-up, open and transitional areas within the city. While the economy which grew faster in the period between the years 1975 to 1990 led to higher rate of urban expansion, the period between the years 1990 to 2002 had low economic growth corresponding to low rate of urban expansion. Since the year 2003, the economy has registered high levels of growth which has triggered higher rates of urban expansion. In this regard, increased GDP values and the urban built-up, open and transitional areas’ expansion exhibit a positive correlation. High Urban Population Growth RateIn the year 1969, the population of Nairobi was 509,286. This rose to 827, 775; 1,324,570 and 2,143,254 in the years 1979, 1989 and 1999 respectively. While the population of the city was 3,138,369 in the year 2009, it is currently estimated at 3,979,827, which is approximately eight fold increase over the 1969’s population (Government of Kenya, 1969; Government of Kenya, 1979; Government of Kenya, 1989; Government of Kenya, 1999; Government of Kenya, 2009; Government of Kenya, 2015). The accelerated urbanisation rate in the city has been accentuated by high natural population increase and rural-urban migration rates. This has increased demand for residential, commercial, industrial and institutional facilities subsequently leading to rapid land use and land cover conversions which manifests through the urban sprawl and mushrooming of the informal settlements. The urbanisation rate has outpaced the local economic growth rate as well as the capacity of the county government to provide, expand and maintain the infrastructure and basic services (Stren and White, 1989). In an endeavour to accommodate the increasing population, the county government has adopted ad hoc planning paradigm which has further worsened the city’s physical, social, economic and environmental problems.Physiographic FactorsAs corroborated by the land use and land cover change maps presented, the expansion of the city has been rapid to the north-eastern, eastern and southern frontiers. This has been occasioned by flat topography and availability of relatively cheaper land which have lowered the development costs in these frontiers. Initially growths in these directions were constrained by poor road networks which have since changed since the year 2003. Further to the above, the trachyte, phonolite, tuffs and basanite rocks found in these zones provides excellent building materials which are extensively being used in the city’s building and construction industry. This has been an impetus to real estate developments and urban expansion in these zones. This contrasts with the northern and western parts of the city characterised by constrained expansion opportunities occasioned by rugged topography and scarcity of land for expansion. Other constraints to the expansion of the city include the national park to the south and the flight safety corridors around the Jomo Kenyatta International Airport. The presence of the Nairobi National Park which is a protected area in closer proximity to the built-up areas makes it a unique and valuable resource, not only as a tourist attraction point, but also as an ecological counterpoint to urban environmental stresses such as noise and air pollutions.
5. Conclusions
The post-classification analysis of the land use and land cover dynamics using satellite data indicates increased land use and land cover changes in the city. This has prompted concerns over the environmental degradation and ecological alterations in the city. As occasioned by higher urbanisation rates being experienced in the city coupled with proliferation of informal settlements, there is increased encroachment of the urban built-up areas into the fragile ecologies, consequently leading to significant degradation of the same. This study has demonstrated that lack of relevant spatial information crucial for planning, can be alleviated by geospatial data that provides opportunities for periodical survey of land use and land cover changes. Spatial patterns of urban sprawl over different time periods in particular can systematically be mapped and monitored by satellite data as integrated with Geographic Information Systems to provide accurate input to the development of sustainable urban structure plans. Further, sustainable urban development should be pursued as a national goal. This can be achieved through the enactment of sound urban development standards as well as environmental conservation policies and progrmmes geared towards promoting practices and consumption patterns that conserve and protect environments. In this regard, interplay between Physical Planning Act (Cap 286 of the Kenyan Laws) and the Environmental Management Act (1999) should in this case manifest through the implementation of the comprehensive urban structure plans and part development plans, clearly marking open spaces as well as spelling out development procedures for conserving the ecosystems.
References
| [1] | Anderson R, Hardy E.E, Roach J.T and Witmer, R.E (1976). A Land Use and Land Cover Classification System for Use with Remote Sensor Data. USGS Professional Paper 964, Sioux Falls, SD, USA. |
| [2] | Babbie, E (2002). Survey Research Methods. Belmont: Woods Worth. |
| [3] | Benfield F. K, Matthew D. R and Chen D. D. T (2008). Paving Paradise. New York: Natural Resources Defence Council. 1999. NRDC. 5 May 2008. |
| [4] | Congalton, R.G (1991). A Review of Assessing the Accuracy of Classification of Remotely Sensed Data. Remote Sensing of Environment. 37: 35–46. |
| [5] | Cooper H, Booth K and Gill G (2003). Using combined research methods for exploring diabetes patient education, Patient Education and Counselling, Volume 51, Issue 1, September 2003, Pages 45–52, Elsevier. |
| [6] | Glaeser, E.L and Ward, B.A (2009). The Causes and Consequences of Land Use Regulations: Evidence from Greater Boston. Journal of Urban Economics, 65 (3). Elsevier, London. |
| [7] | Government of Kenya (1969). Population and Housing Census Surveys. Nairobi, Government Printer. |
| [8] | Government of Kenya (1979). Population and Housing Census Surveys. Nairobi, Government Printer. |
| [9] | Government of Kenya (1989). Population and Housing Census Surveys. Nairobi, Government Printer. |
| [10] | Government of Kenya (1999). Population and Housing Census Surveys. Nairobi, Government Printer. |
| [11] | Government of Kenya (2001). Economic Survey. Nairobi, Government Printer. |
| [12] | Government of Kenya (2002). National Development Plan. Nairobi, Government Printer. |
| [13] | Government of Kenya (2009). Population and Housing Census Surveys. Nairobi, Government Printer. |
| [14] | Government of Kenya (2010). Economic Survey. Nairobi, Government Printer. |
| [15] | Government of Kenya (2012). Economic Survey. Nairobi, Government Printer. |
| [16] | Government of Kenya (2015). Economic Survey. Nairobi, Government Printer. |
| [17] | Hirst, T and Lamba, D (1994). The Struggle for Nairobi. Nairobi, Mazingira Institute. |
| [18] | Lamba, D (1994). Nairobi’s Environment: A Review of Conditions and Issues. Nairobi, Mazingira Institute. |
| [19] | Lopez, R (2004). Urban Sprawl and Risk for Being Overweight or Obese. American Journal of Public Health. 94.9 (2004): 1574-1579. |
| [20] | Mundia, C. N and Aniya, M (2006). Dynamics of Landuse/Cover Changes and Degradation of Nairobi City, Kenya. Land Degradation & Development, 17: 97–108. |
| [21] | Obudho, R and Juma, P (2002). The Role of Urbanisation and Sub-Urbanisation Processes in Urban Land Management Practice in East Africa. In Olima, W.H.A and V. Kreibich (eds) Urban Land Management in Africa. Dortmund: Spring Centre, Research Series No 40. |
| [22] | Patz J and Balbus J (2003). ‘Global Climate Change and Air Pollution: interactions and their effects on human health’ in Aron J, Patz J (eds) Ecosystem Change and Public Health. Baltimore, Johns Hopkins University Press, pp379-402. |
| [23] | Stren, R.E and White, R.R (1989). African Cities in Crises: Managing Rapid Urban Growth. London, West views press. |
| [24] | UN-Habitat (2010). The State of African Cities 2010 Governance, Inequality and Urban Land Markets, United Nations Human Settlements Programme (UN-HABITAT), Nairobi. Kenya. |
| [25] | Yang, X and Lo, C.P (2002). Using a time series of satellite imagery to Detect Land Use and Cover changes in the Atlanta, Georgia. International Journal of Remote Sensing 23: 1775–1798. |
| [26] | Yeates, M and Garner, B (1976). The North American City. New York, Harper and Row Pub. |

 Abstract
 Reference
 Full-Text PDF
 Full-text HTML