Monica Machuma Katyambo, Moses Murimi Ngigi
Institute of Geomatics, GIS and Remote Sensing, Dedan Kimathi University of Technology, Nyeri, Kenya
Correspondence to: Monica Machuma Katyambo, Institute of Geomatics, GIS and Remote Sensing, Dedan Kimathi University of Technology, Nyeri, Kenya.
| Email: |  |
Copyright © 2017 Scientific & Academic Publishing. All Rights Reserved.
This work is licensed under the Creative Commons Attribution International License (CC BY).
http://creativecommons.org/licenses/by/4.0/

Abstract
Nairobi city expanded spatially leading to the formation of the 32,514 km2 Nairobi Metropolitan Area. The region faces rapid urbanization challenges and lacks reliable data for urban planning. This study is aimed at monitoring the urban land cover using GIS and Remote Sensing techniques. Three different land cover maps produced at ten year epochs between 1995 and 2015 were used to evaluate and analyse urban growth visually and quantitatively. Spatial metrics indices and the Annual Urban Spatial Expansion Index were employed in the quantitative analyses. Urban land cover increased from 408.99 km2 to 763.79 km2 and to 2,187.82 km2 with annual growth rates of 8.4% and 17.2% in the two study period epochs. The areas had annual spatial expansion indices of 4.58% and 6.32% respectively in the periods 1995- 2000 and 2000-2015. Radial-axial expansion of built-up areas along transport routes led to the expansion of urban areas into agricultural and forest land. The region’s spatial plan forecasted an urban land cover of 1,717.72km2 by the year 2030, yet by the year 2015, the urban area was 2,187.82 km2. These growth characteristics will have an effect on the location of the proposed Cyber city, Knowledge-cum-Health city and the Aerotropolis, as proposed in the spatial planning concept of the NMR. The spatial analysis of the NMR growth trends could support in the urban growth management mechanisms and plans for sustainable development.
Keywords:
GIS, Remote Sensing, Spatial urban growth, Nairobi Metropolitan Region, Sustainable development
Cite this paper: Monica Machuma Katyambo, Moses Murimi Ngigi, Spatial Monitoring of Urban Growth Using GIS and Remote Sensing: A Case Study of Nairobi Metropolitan Area, Kenya, American Journal of Geographic Information System, Vol. 6 No. 2, 2017, pp. 64-82. doi: 10.5923/j.ajgis.20170602.03.
1. Introduction
Urbanization is the process by which large numbers of people become permanently concentrated in relatively small areas. It is induced by physical geography, living and property costs, demand for more living space transportation, and lack of proper planning policies [2]. The world is rapidly urbanizing and cities are experiencing the dynamic processes of urbanization and globalization [8]. A large percentage of the world’s population reside in metropolitan areas of developing countries [18] thereby raising a need of urban planning. Kenya being one of Africa’s fastest urbanizing countries had 215 urban centers in the year 2009 with Nairobi as the capital city [10]. Twenty four (24) of these urban centers are located within the Nairobi Metropolitan Region (NMR).Previous land use/cover studies revealed that there was unsustainable sprawl of Nairobi city [12]. It is estimated that by the year 2030, 61.5% of the urban population will live within the NMR [13]. The Kenya Vision 2030, an economic and social development program, proposed flagship projects to spur development across the country, one being the creation of six metropolitan areas covering the main cities. The NMR project was the first be set up with a vision to grow and develop into a world class African metropolis capable of creating sustainable wealth and offer a high quality of life to its residents, the people of Kenya and investors by the year 2030 [7]. It was earmarked for rapid economic development since it plays an important role locally in the Kenyan economy, regionally, as well as globally.Urban growth, being a land use/cover change phenomena from a non-urban category to an urban category [3] is a dynamic and complex phenomenon revealing economic development. Spatial temporal urban growth indicates the spatial and temporal dimensions of land cover/ use change at the level of the urban landscape [5]. Urban land covers a smaller area compared to other land covers but its impact to the surrounding environment is higher. It alters the land use pattern, land values and the intensity of site use [15]. Urban growth combined with urban sprawl, inadequate infrastructure and land use planning have posed a challenge in the Nairobi Metropolitan Region-NMR [8]. Urban growth generates a lot of problems and challenges economically, socially and environmentally [13]. It has both negative and positive effects on the ecological and social systems. Urbanization when ignored may intimidate sustainable development. [6]. Urban expansion in the NMR has induced significant socio-economic, environmental and health challenges [4] raising a need of urban planning. Urban development is a large resource consumant that calls for proper planning and monitoring [10]. Lack of information about urban spatial growth taking place in different parts of the metropolitan region has limited the process of urban and regional planning and development management [8]. Urbanization in the NMR has led to high land prices, low forest cover, and encroachment on conservation areas such as the Athi and Tana River catchments [9].The Ministry of Nairobi Metropolitan Development (MoNMeD) developed a spatial plan to determine how the NMR was to develop. The plan was to guide and coordinate development of infrastructural facilities and services and for the specific control of the use and development of land [10]. It proposed spatial modelling for the NMR through six new towns as new growth centres in the national economy as well as to accommodate new activities meant to decongest Nairobi city [7]. The selection of the proposed new towns locations were based on accessibility from the road network, topography, availability of low productivity agricultural land, low interference with ecologically sensitive and conservation areas, and good potential for landscaping. This left out the crucial urbanization factor.Spatial planning requires information on the existing land-use/land-cover pattern, its spatial distribution and changes [17]. Urbanization determines the implementation of spatial planning proposals and of course has an impact on sustainability of urban ecosystems. For the comprehensive land-use planning of urban areas, current and accurate land use information is vital for spatial planning and management [11]. Monitoring urban growth in the NMR is necessary for implementing appropriate strategies regarding the urban planning decision making process and in redrawing urban policies in the NMR.The main objective of this study was to monitor growth in the urban land cover by analyzing the spatial-temporal urban land use/cover changes that occurred in the region before and after the creation of the Nairobi Metropolitan Area using GIS and remote sensing techniques. Landsat images were characterised, mapped and quantified to reveal changes in the built-up land cover from which changes in growth and pattern were evaluated and analysed. The study focuses on the expansion of urban areas as sign of economic development. Remote sensing and GIS technologies are used since they are a proper and effective tool to understand and present the phenomenon. Mapping unplanned urban expansion provides a “picture” of where this type of growth is occurring; its negative effects and suggests mitigation measures [17]. Accurate mapping of urban lands and monitoring urban expansions are significant for optimum urban analysis in urban planning of metropolitan regions [1]. Spatial temporal urban growth caused by infill and by the vertical dimension of space was not considered in assessing urban growth with regard to settlement expansion.This study answers questions such as where did urban growth occur in the NMR between 1995 and 2005?; at what rate and how much land was converted to urban land cover within the study period?; and which urban growth theory explains the expansion. These questions were answered with the aid of spatial metrics(total area-TA, class area-CA, number of patches-NP, patch density-PD, largest patch-LP, largest patch index-LPI, mean patch size-MPS), urban growth indicators (annual urban spatial expansion index-AUSEI) and through visual interpretation of the resultant urban land cover maps. Spatial metrics are numerical indices to describe structure and patterns of a landscape [14]. They quantify and describe the underlying structure and patterns of urban landscape from geospatial data [16].The study will enable spatial planners to determine the possibility to implement proposed development programs as it is possible to identify the available and lost land cover as a result of new urban development. With this information, urban growth management mechanisms such as urban growth boundaries and delineation of land uses can be implemented.
2. Materials and Methods
To acquire the information needed in monitoring spatial urban growth in the NMR, GIS and Remote Sensing technologies were used.
2.1. The Study Area
This study focuses on the Nairobi metropolitan region (NMR) comprising of four (4) out of the forty seven (47) counties in Kenya namely: Nairobi, Kiambu, Machakos, and Kajiado (Figure 1). The area is a highly urbanizing region with 24 urban centres. Nairobi city being the most dominant is the core of the metropolis. The region extends over an area of approximately 32514km2 that substantially depend on Nairobi city for employment and social facilities. 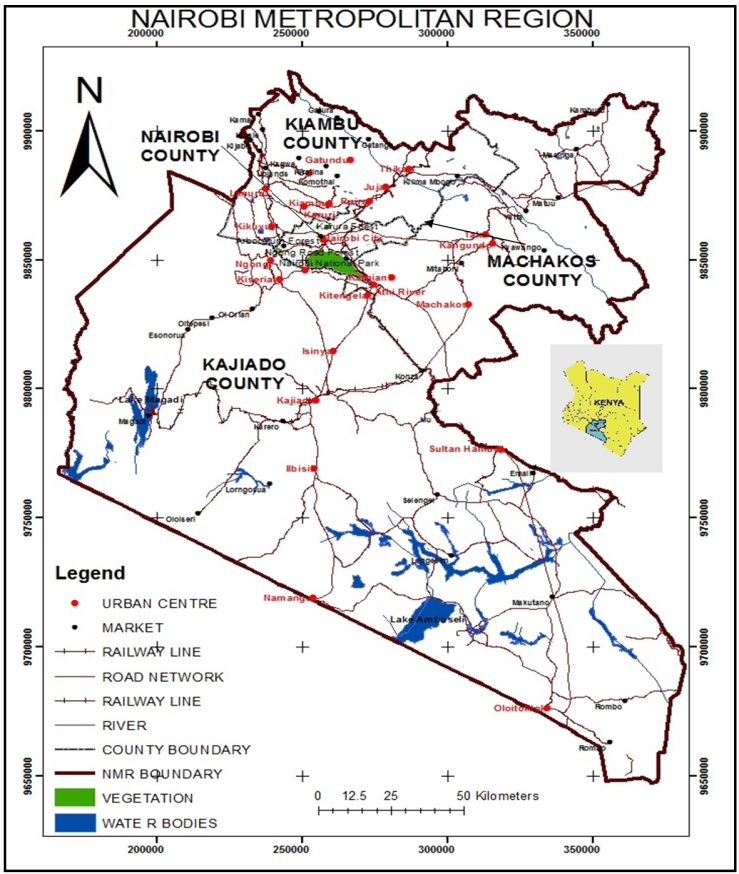 | Figure 1. Study Area, The Nairobi Metropolitan Area |
The NMR is strategically located as a central gateway to the East and Central African region as well as its positioning on the Northern corridor and the Cape to Cairo highway. International trunk roads A104, A109 pass through the area enabling movement of traffic to/from Mombasa to neighbouring landlocked countries of Uganda, Rwanda, South Sudan and Ethiopia. These characteristics present significant strengths for the region as it provides useful access points to various markets in Africa and particularly for the Indian Ocean islands and South Asia. The Metro Vision 2030 divided the NMR into foursub-regions: Core Nairobi (Nairobi county), the Northern Metro (Kiambu county), the Eastern Metro (Machakos county) and Southern Metro (Kajiado county).
2.2. Study Approach
Figure 2 below graphically illustrates how the research was carried out to attain the main objective.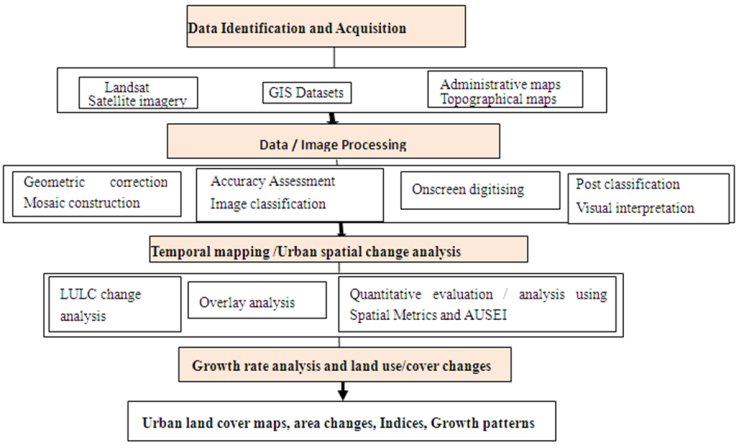 | Figure 2. Study Approach |
2.3. Data
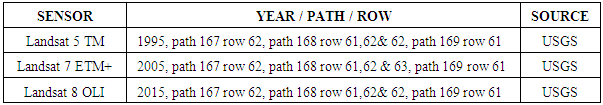
Landsat imagery downloaded from United States Geological Survey (USGS) archives were used to reveal the extent of urbanized land in the region. Five scenes of Landsat 5 TM for 1995, Landsat 7 ETM+ for 2005 and Landsat 8 OLI for 2015 covering path 167 row 62, path 168 row 61,62 & 62, path 169 row 61 were used in land cover mapping (Figure 3 and Table 1).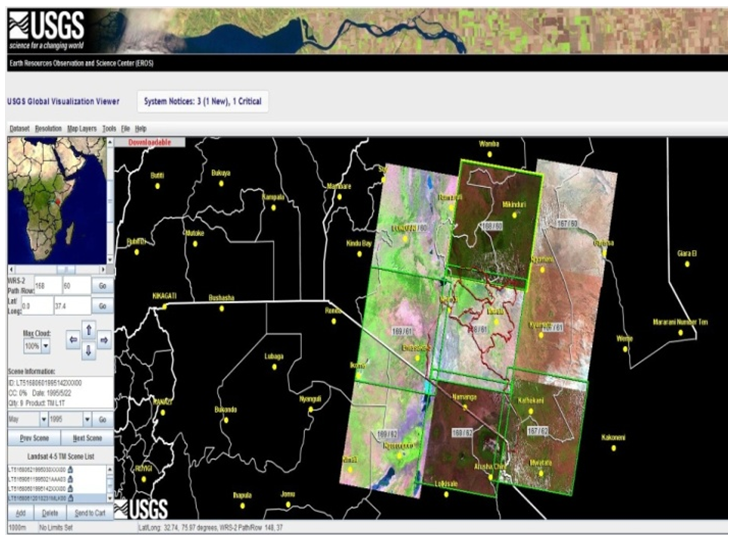 | Figure 3. Landsat scenes overlay of the study area |
Table 1. Images used
 |
| |
|
2.4. Methods
To capture the urban land use/cover in the study area from the imagery, data and image processing was done followed by temporal mapping and urban spatial change analysis. Digital image processing involved layer stacking, radiometric and geometric corrections, spatial enhancement, mosaicking, subsetting to curve out the AOI, and classification processes. The Scan Line Corrector (SLC) device in Landsat 7 malfunctioned in the year 2003 causing stripping (gaps) in the imagery. To fill these gaps in the 2005 image, (destripping), focal analysis which is an iterative process, was adopted. The images were then enhanced to improve their visual appearance by applying a contrast adjustment technique, (Histogram Equalization).The images were classified into five feature classes namely: Built-up, Vegetation, Bare land, Water and Other lands using maximum likelihood classification algorithm in the supervised classification technique. The bare land class comprised the undeveloped or un-built-up areas in the study area. The classification process had some challenges. Surfaces with similar spectral properties led to misclassification of some land covers. Land covers that did not fall under built-up, vegetation, bare land or water classes were classified as other lands and the remaining cloud cover in the imagery after clearance was classified as water. Classification accuracy assessment was done by referencing and assessing 40 randomly generated points of each class to the Google earth high resolution images by synchronizing the ERDAS view with Google earth. The accuracy assessment report was then evaluated.The resultant classes were regrouped into built-up and non-built-up for easy analysis. The urban centre locations were singled out to capture built-up areas. Built-up areas characterized urban areas and were curved out from the classified images. The twenty four urban centres within the NMR were singled out and the built up areas mapped to display the nature of changes in the years 1995, 2005 and 2015 classified images. Post classification comparison approach was adopted for land use/cover change analysis. The analysis involved calculating the increase in the area of urbanized land over time and their growth rates using one urban growth indicator (the Annual Urban Spatial Expansion Index), growth rates and seven spatial metrics.
3. Results and Discussion
Post classification image differencing was used to show the changes in urban land cover. The classified study area was mapped, quantified, analysed and evaluated.
3.1. Classification
The classified images had five land cover classes which were presented in different tones (figure 4, 5 and 6). Surfaces with similar spectral properties presented a challenge in the classification process leading to misclassification of some land covers. 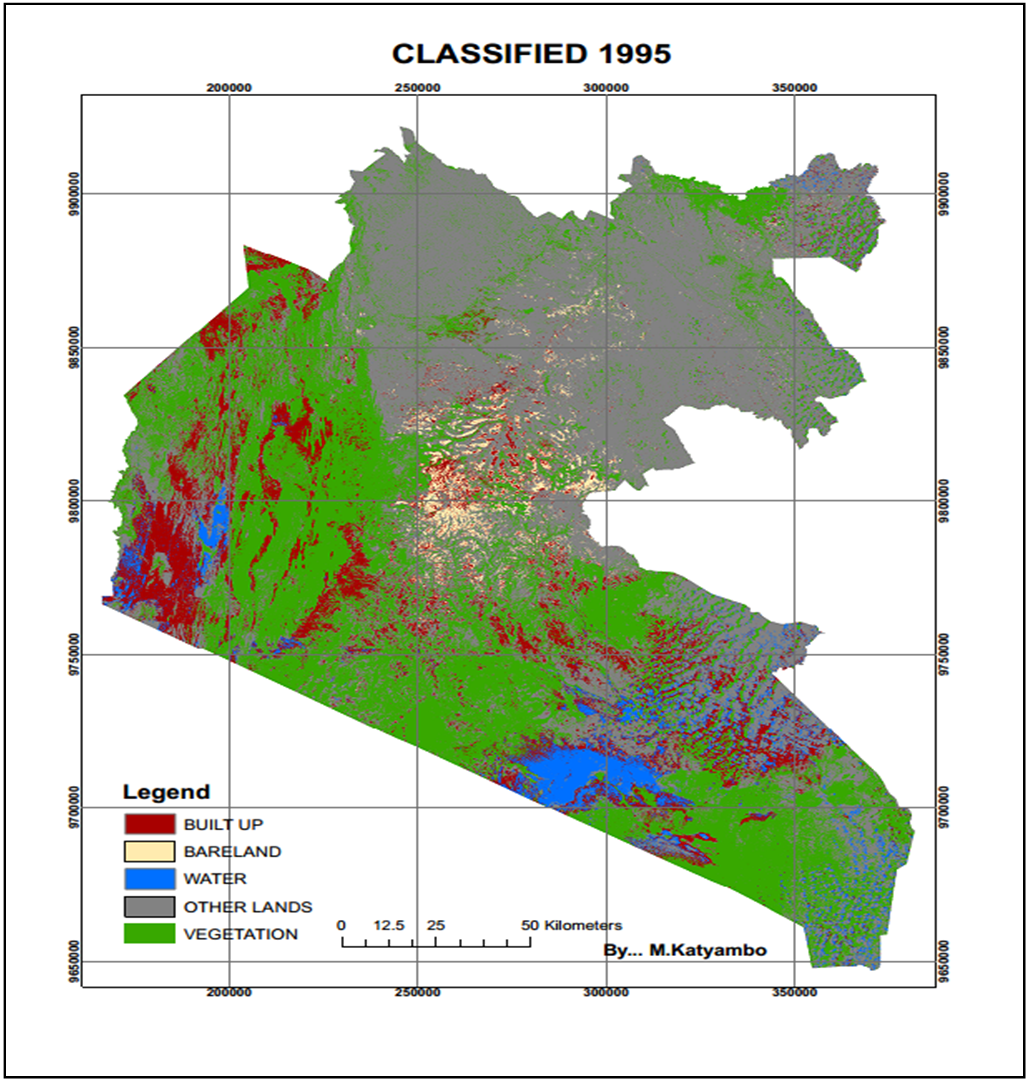 | Figure 4. Classification Results 1995 |
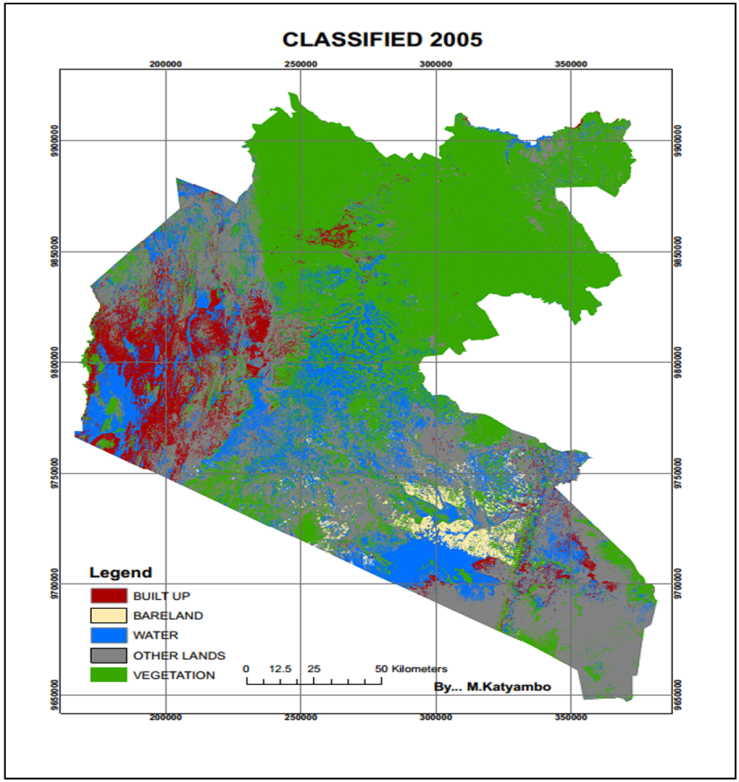 | Figure 5. Classification Results 2005 |
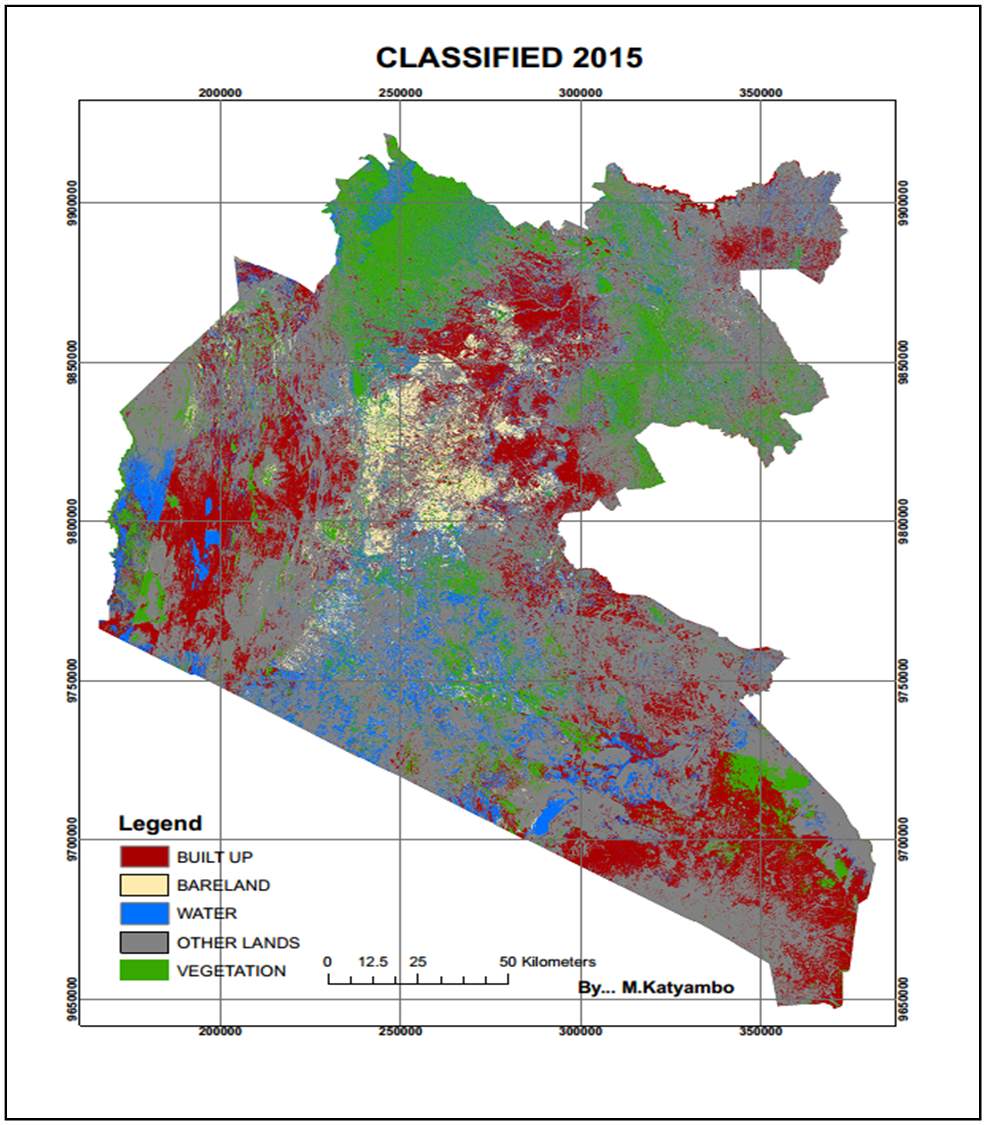 | Figure 6. Classification Results 2015 |
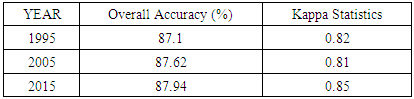
3.2. Accuracy Assessment
The generated accuracy assessment report showed the Producer’s, User’s, Overall accuracies and Kappa Coefficients (Table 2).Table 2. Accuracy Assessment results
 |
| |
|
3.3. Class Area Change Detection
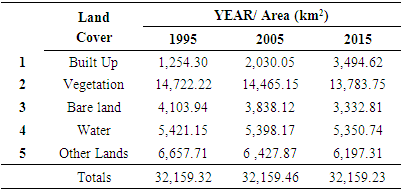
From the classified images, land cover class areas in square kilometres were generated (Table 3). Classification results show that the built-up land cover increased from 1254.30km2 (3.9%) in 1995 to 2030.05km2 (6.3%) in 2005 to 3494.62km2 (10.9%) in 2015. Bare land and vegetation class areas reduced between 1995 and 2015 indicating a takeover. The areas reduced as e result of infill and extension developments. Bare lands were built-up while vegetation was cleared to create space for development (Table 3).Table 3. NMR Land cover class areas for 1995, 2005 and 2015
 |
| |
|
The built-up cover grew at a rate of 77.58km2 per year between 1995 and 2005. Between 2005 and 2015 the built-up land cover grew at a rate of 146.46km2 per year. The built-up class area in Table 3 does not represent the urban area cover in the region since it excludes areas like open spaces, parks, airports, dump sites etc. and vegetation within the selected urban centres. On the other hand, the class reveals changes due to infill and extension developments including the built up areas in the rural parts of the NMR. The aim of this study was to monitor the urban land cover by quantifying the changes that occurred between 1995 and 2015.
3.4. Description of Urban Land Use/Cover Changes
This study is all about urban expansion in the NMR only. To define and quantify urban areas in the study area, land cover classes were grouped into built-up and non-built –up (Table 4). Table 4. Regrouped land cover classes
 |
| |
|
In a GIS environment, the 24 urban centres were curved out from the classified images (using ArcGis 10.1). Maps showing built-up(urban) and non built-up(rural) land cover for years 1995, 2005 and 2015 (Figures 7, 8 and 9).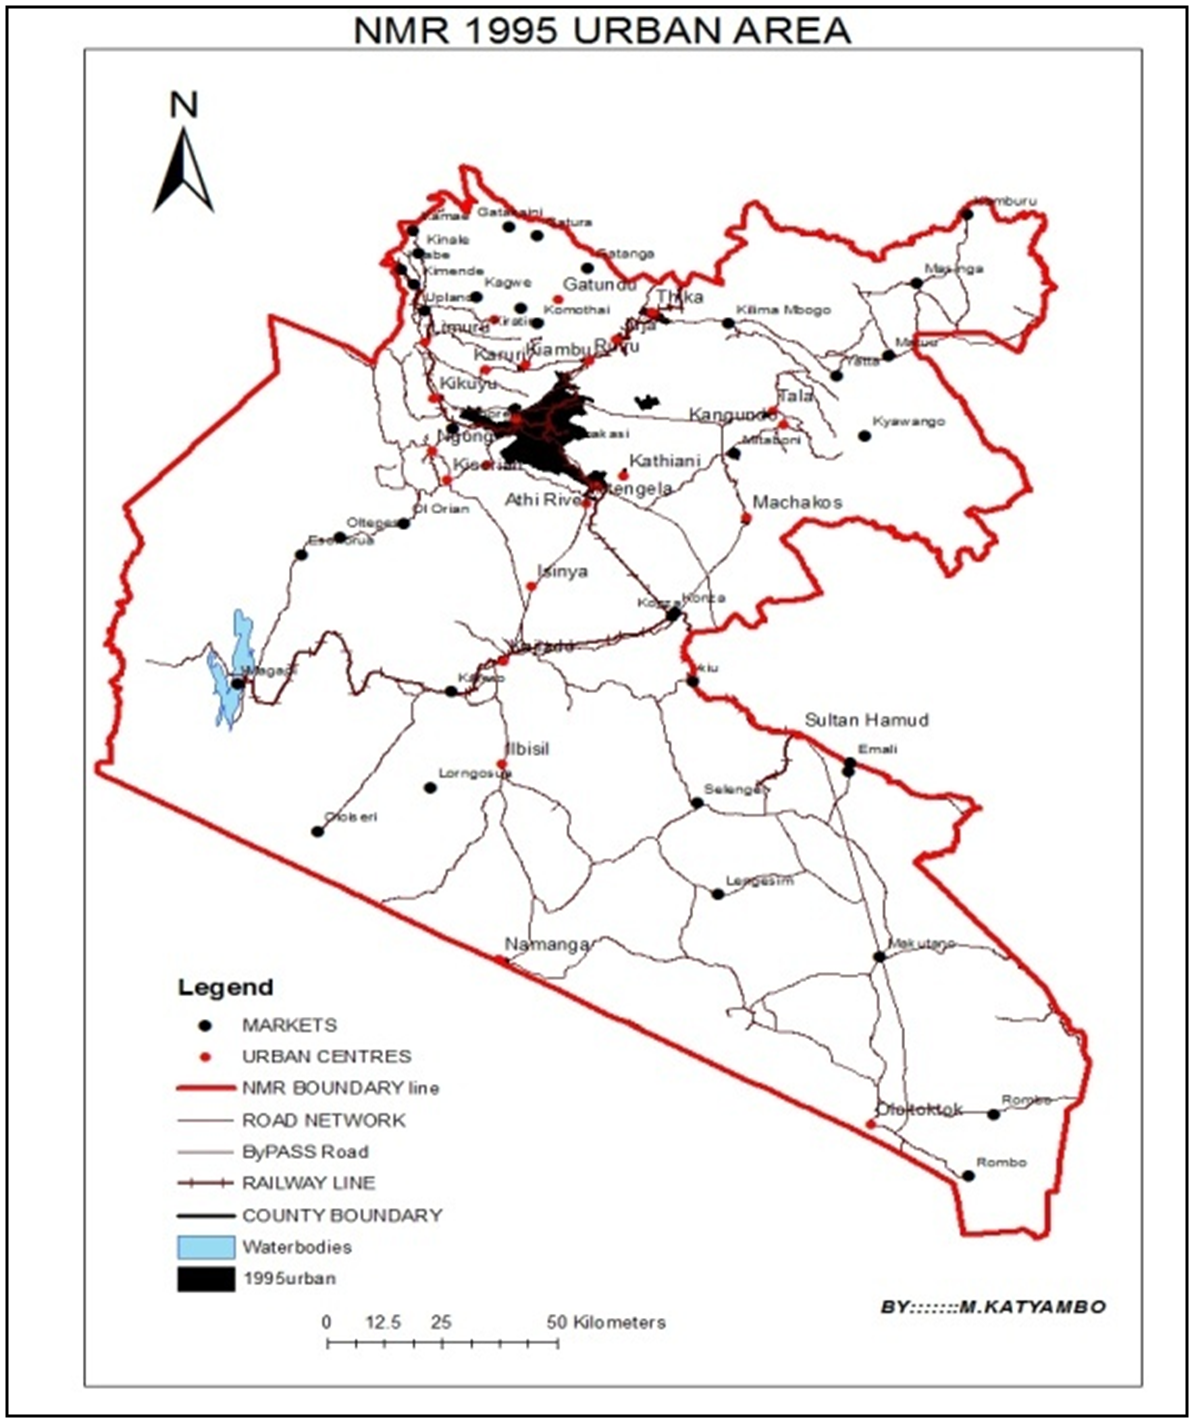 | Figure 7. 1995 Urban Area |
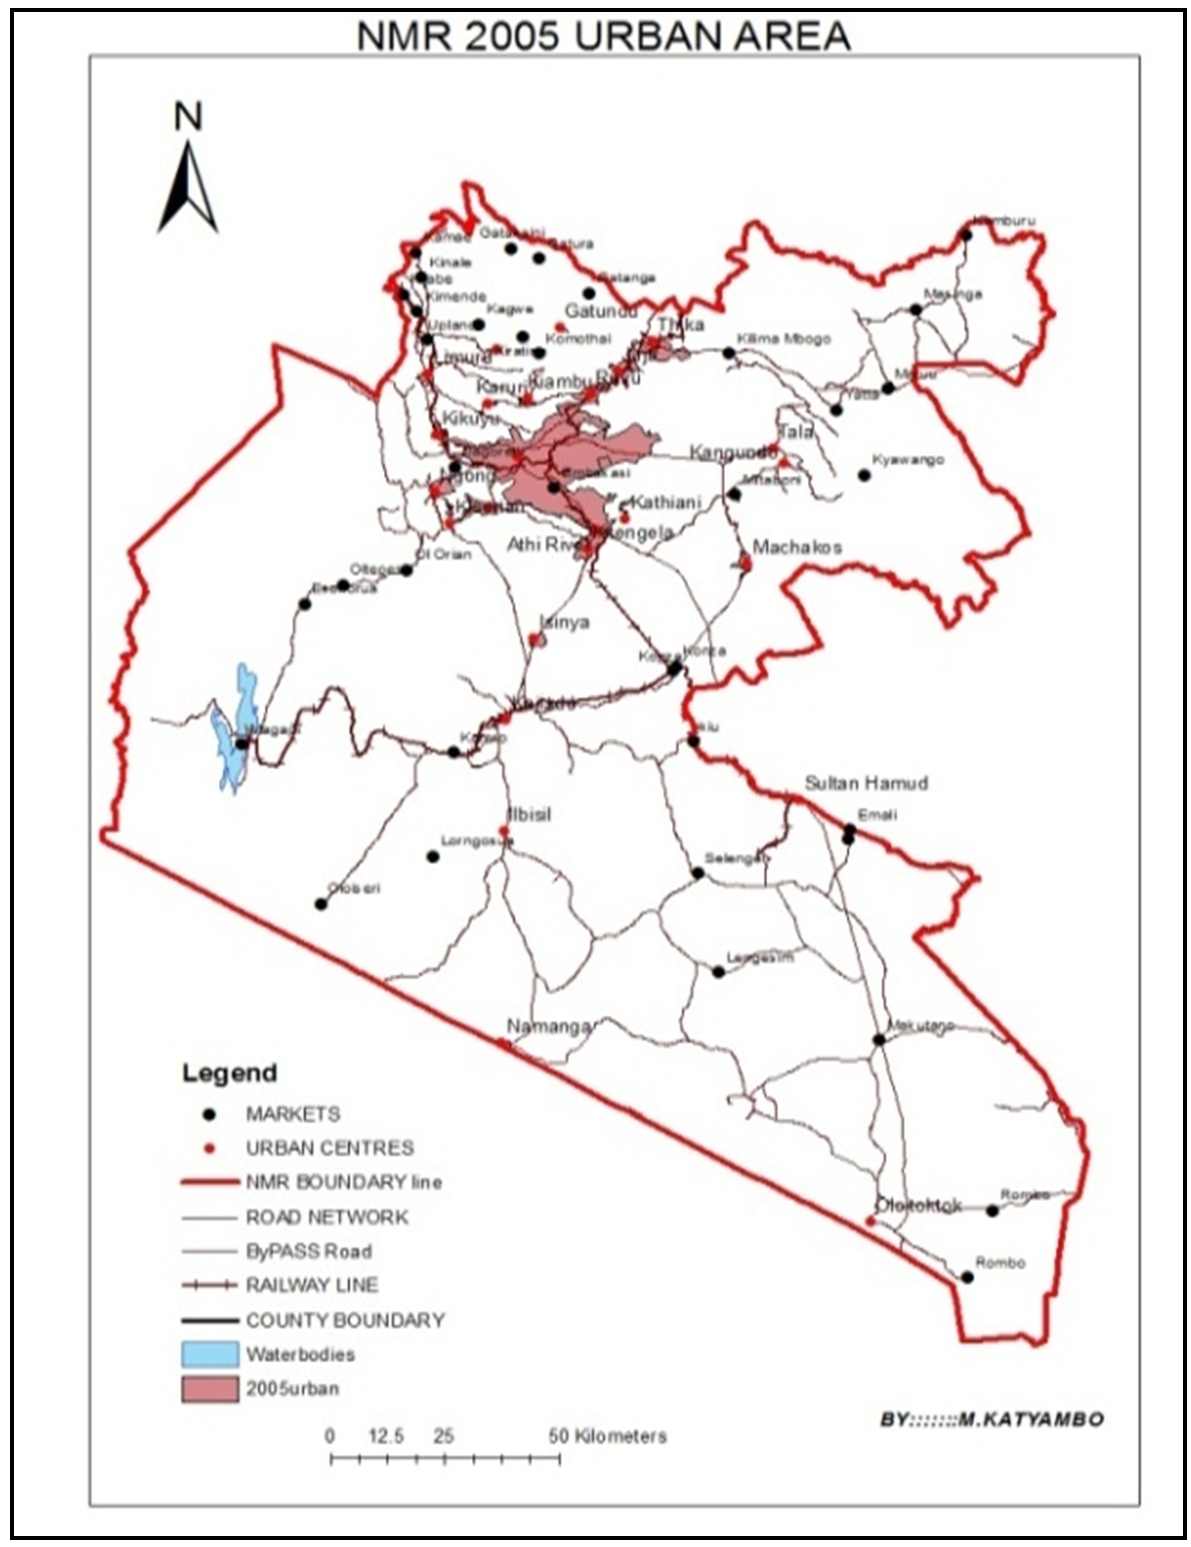 | Figure 8. 2005 Urban Area |
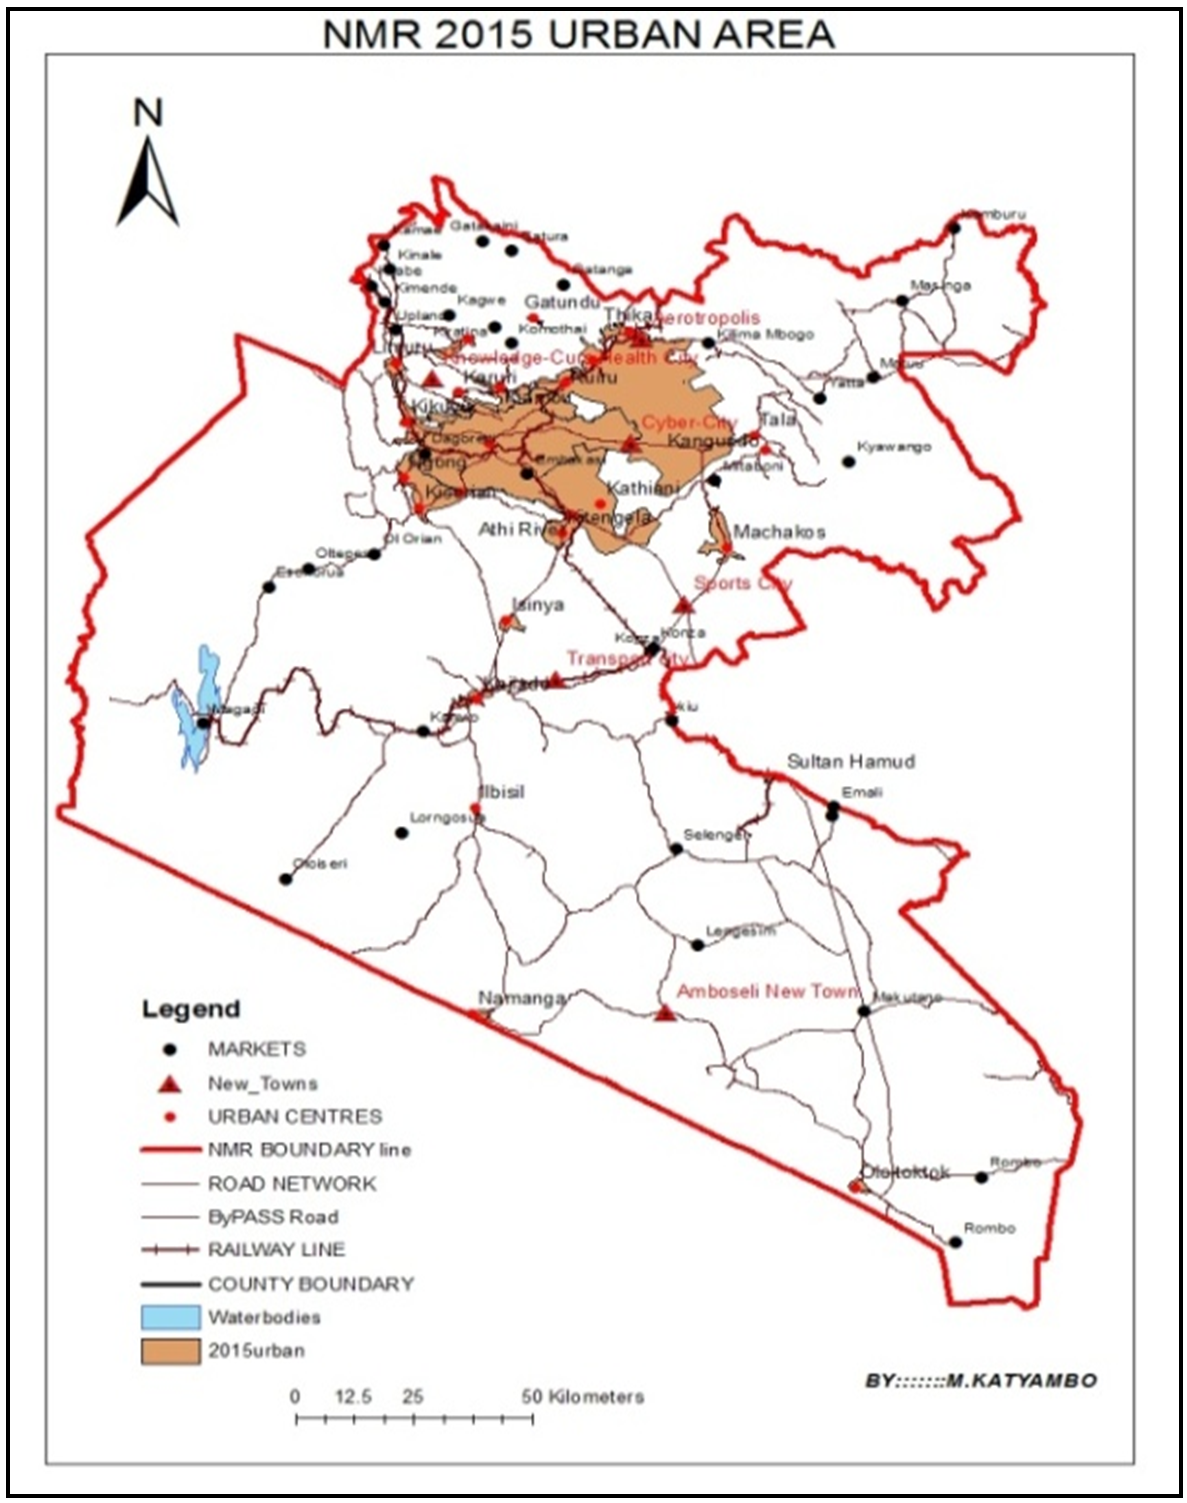 | Figure 9. 2015 Urban Area |
The NMR sub-regions were curved out to enable the analysis of urban growth at sub-region level (Figures 10, 11, and 12).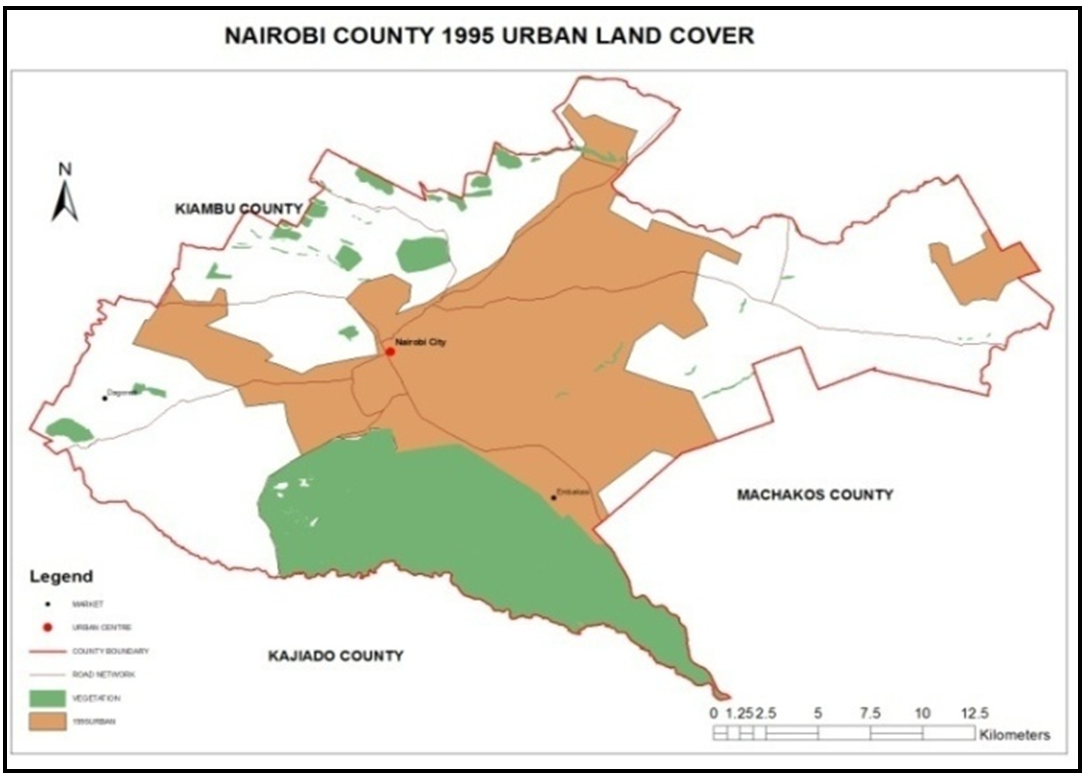 | Figure 10a. Nairobi County 1995 Urban land cover |
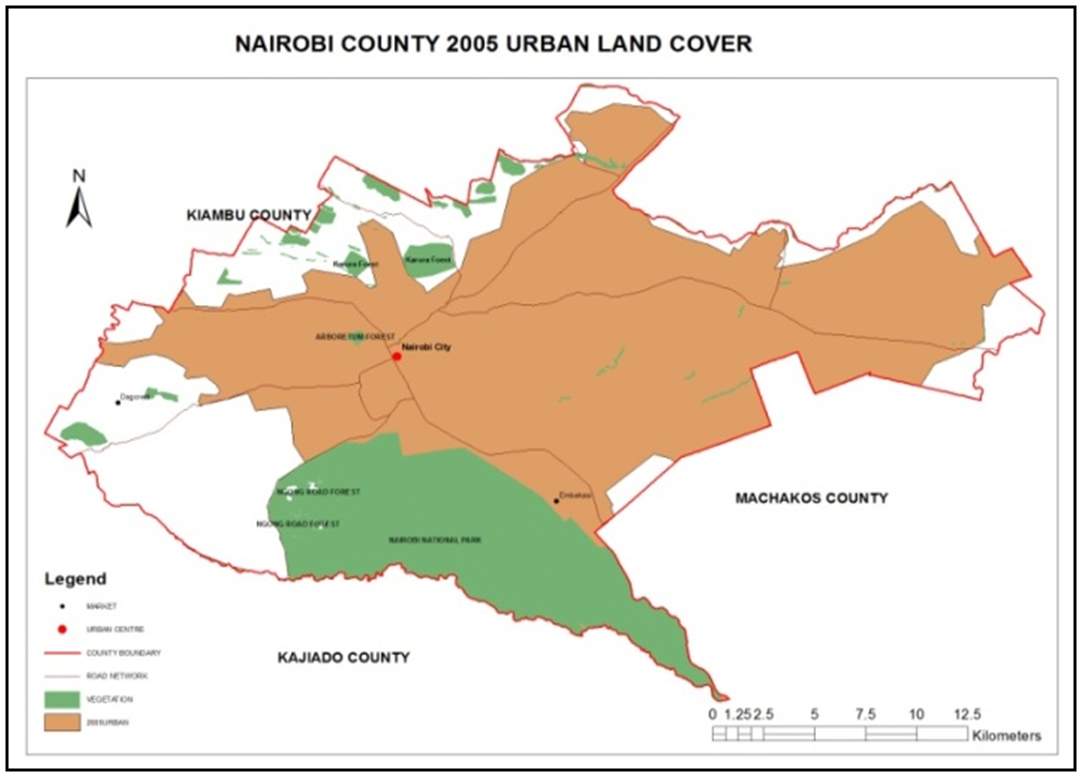 | Figure 10b. Nairobi County 2005 Urban land cover |
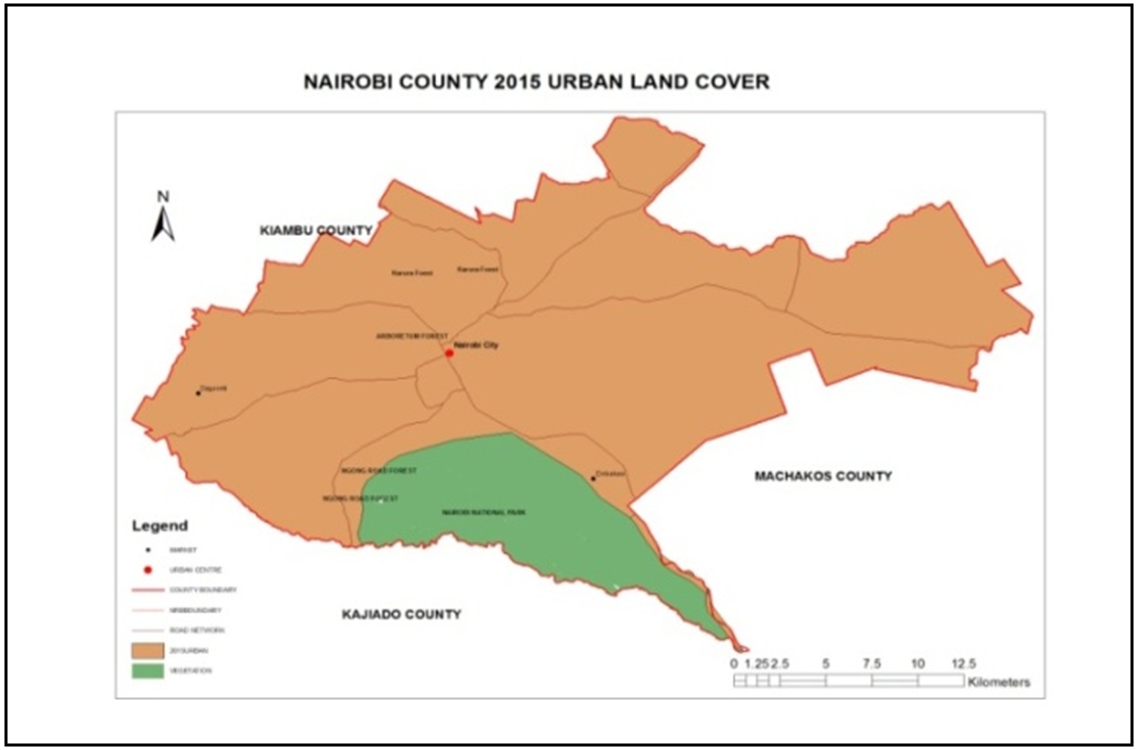 | Figure 10c. Nairobi County 2015 Urban land cover |
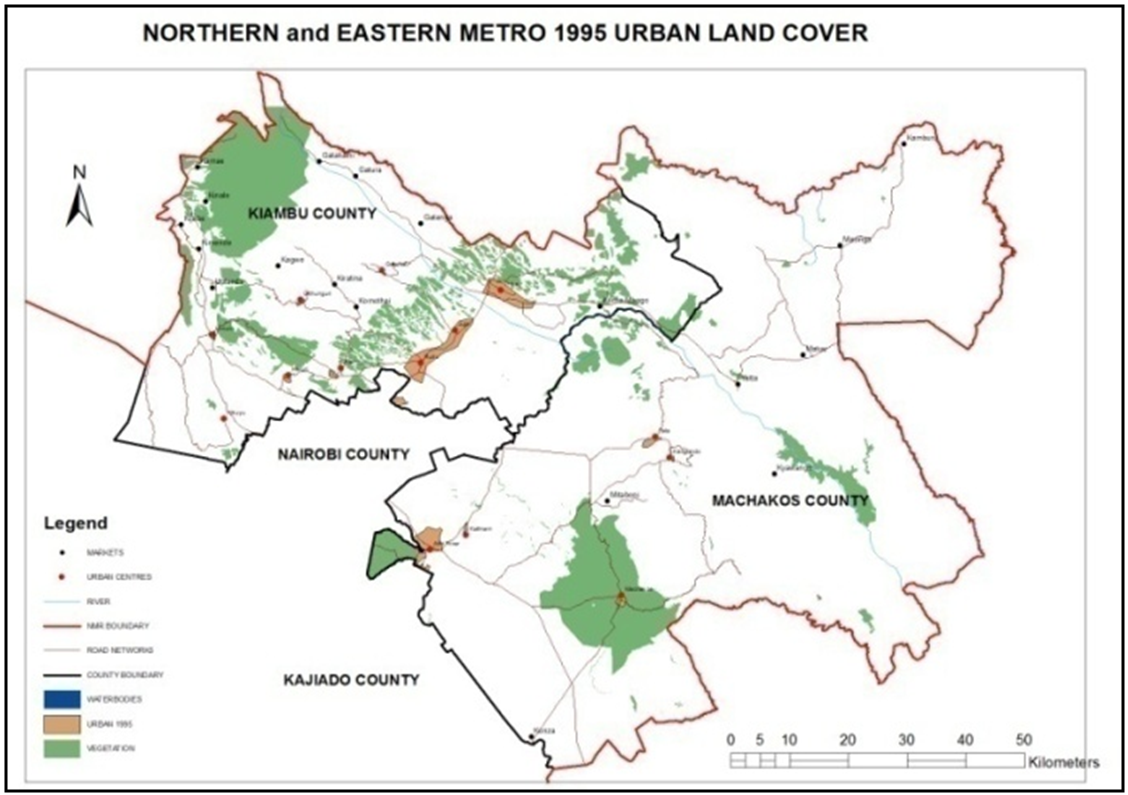 | Figure 11a. Kiambu and Machakos 1995 Urban Land Cover |
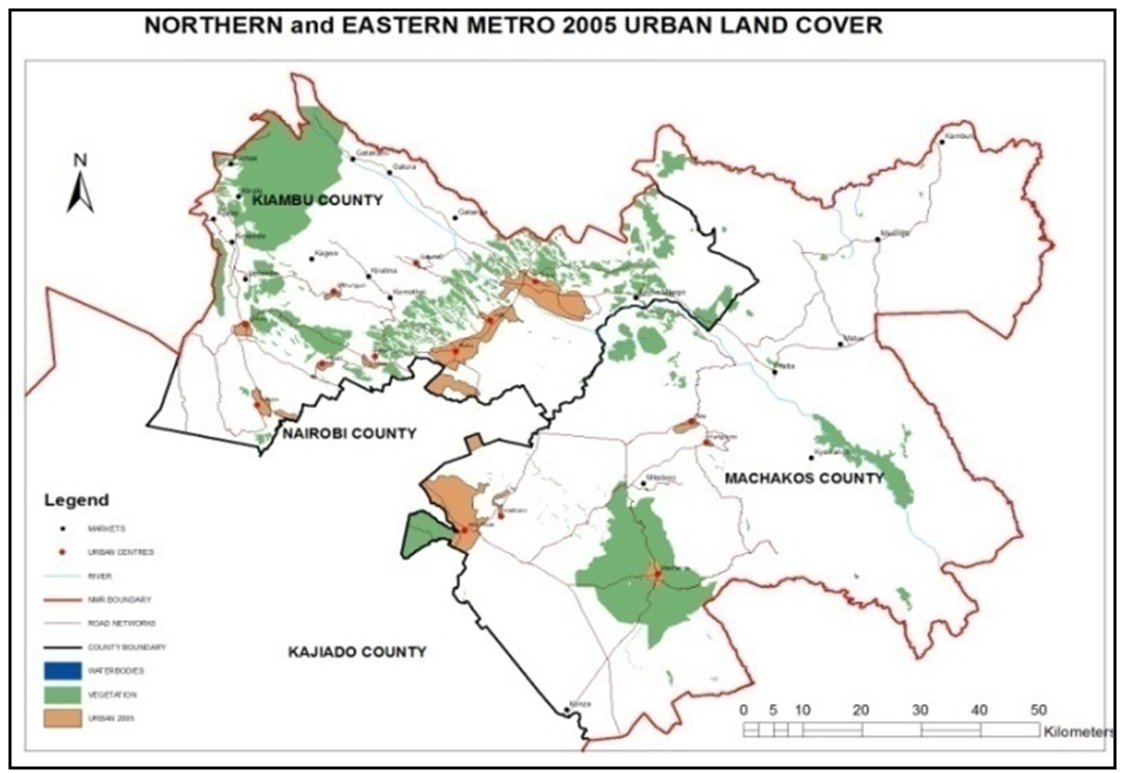 | Figure 11b. Kiambu and Machakos 2005 Urban Land Cover |
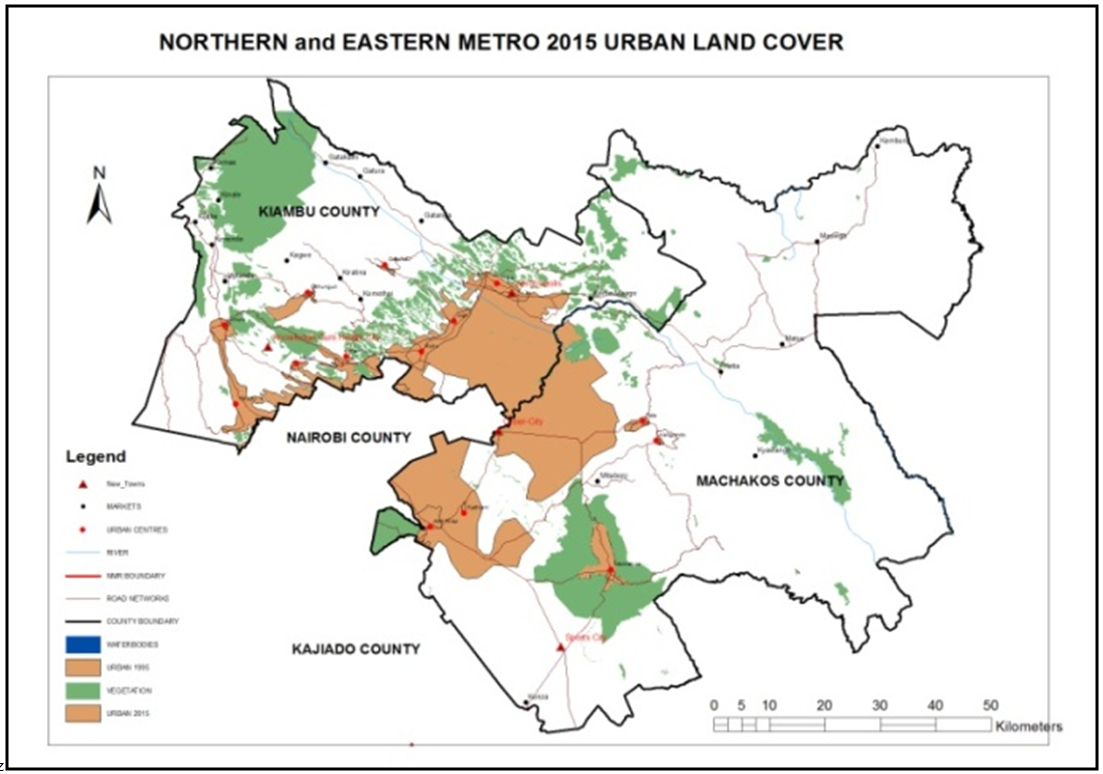 | Figure 11c. Kiambu and Machakos 2015 Urban Land Cover |
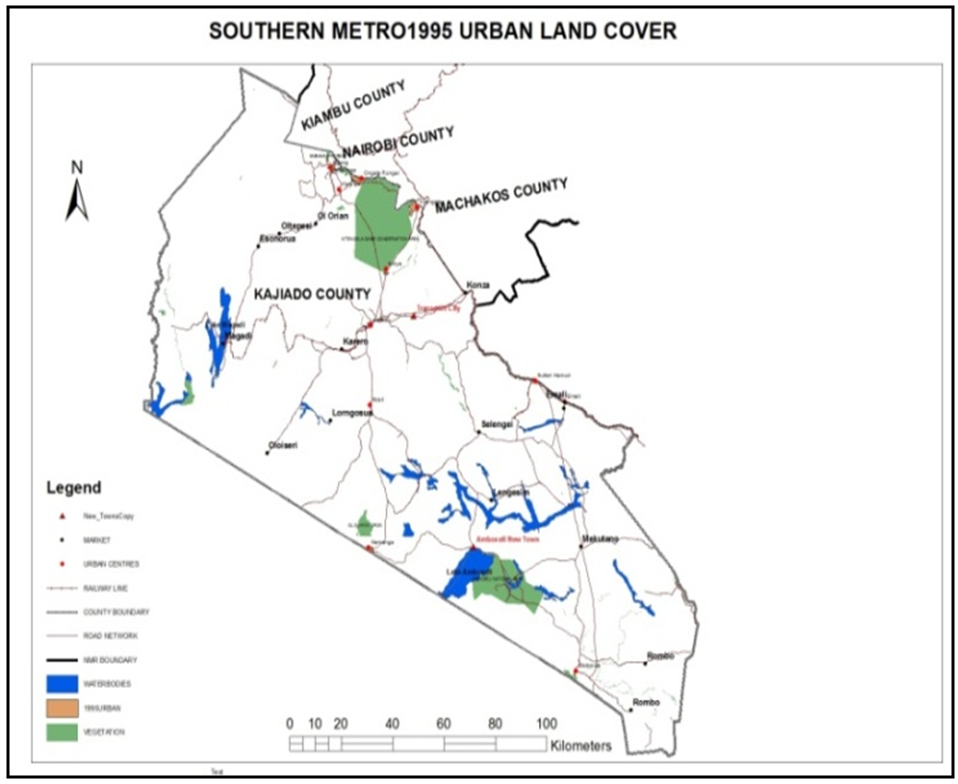 | Figure 12a. Kajiado 1995 Urban Land Cover |
 | Figure 12b. Kajiado 2005 Urban Land Cover |
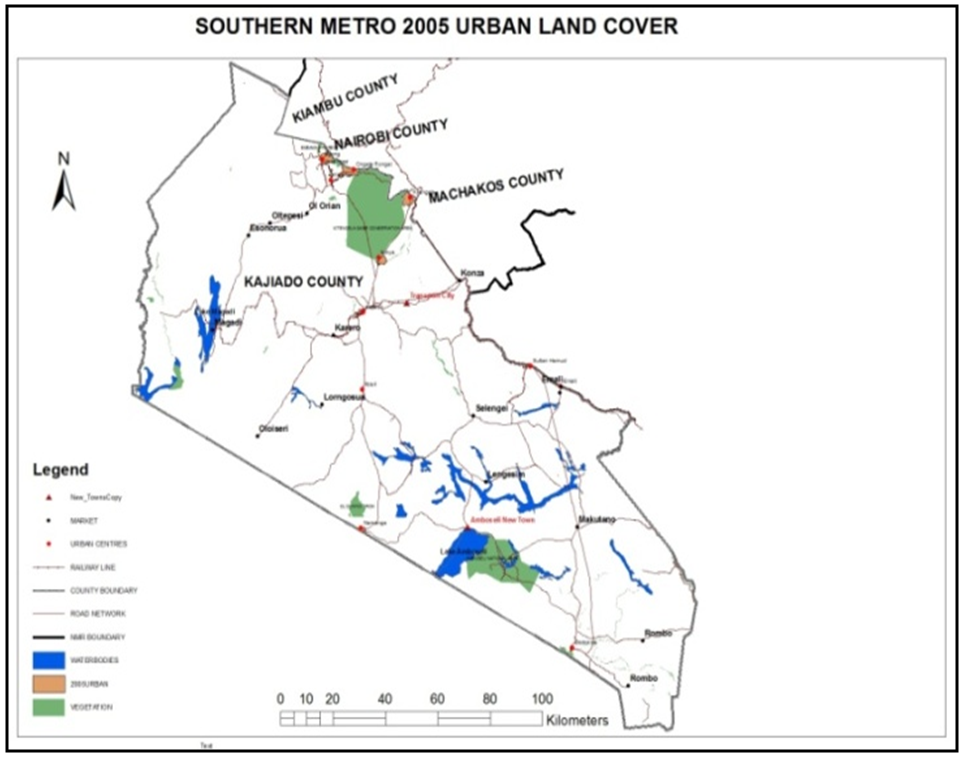
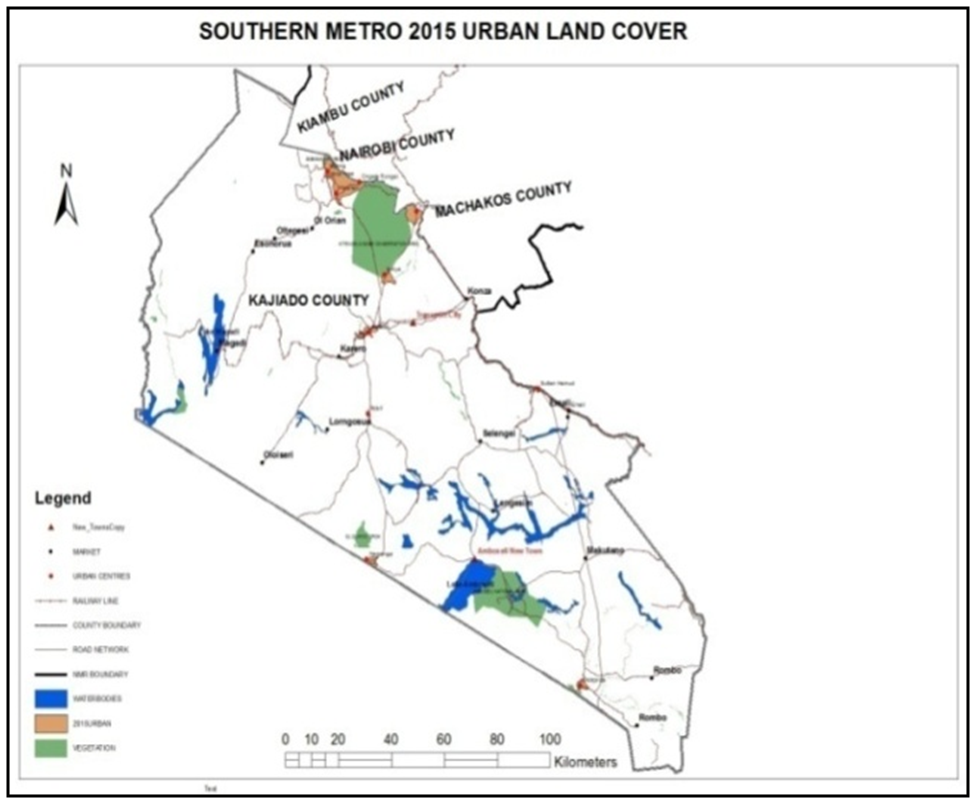 | Figure 12c. Kajiado 2015 Urban Land Cover |
3.5. NMR Land Use/Cover Status for 1995-2015
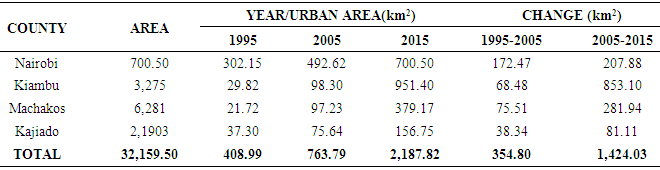
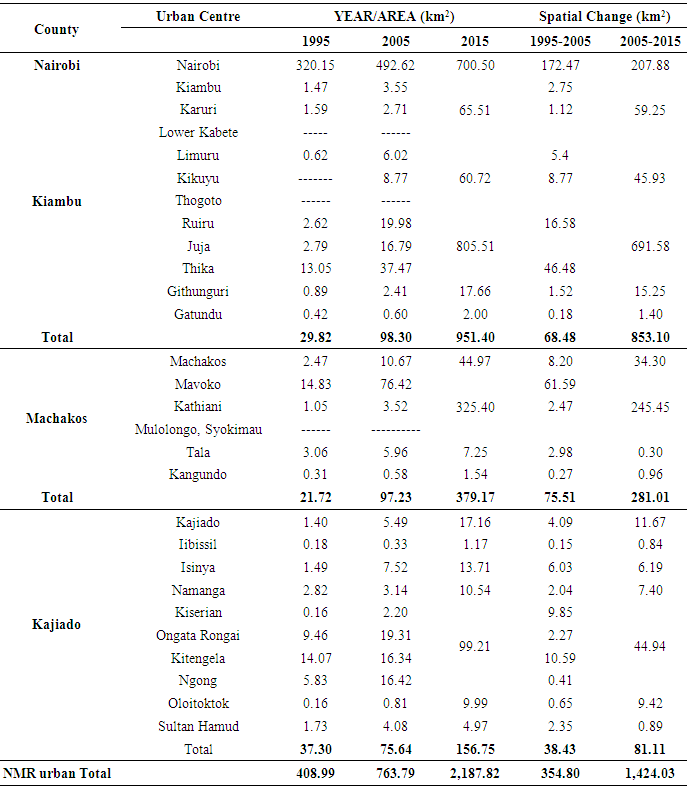
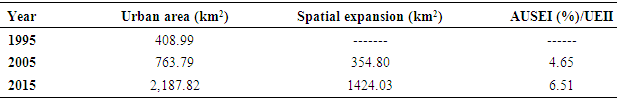
The urban area captured over three different years was quantified and compared (Figure 7, 8, 9, Table 5 and 6). Of the 32159.5 km2 NMR area, urban centres covered 408.99 km2 (1.27%), 763.79 km2 (2.38%), and 2187.82 km2 (6.80%) in 1995, 2005 and 2015 respectively (Figure 13 and 15).Table 5. NMR urban area cover and changes
 |
| |
|
Table 6. NMR Urban Land Cover in square kilometres
 |
| |
|
Table 7. Annual Urban Spatial Expansion Index for periods 1995 - 2005 and 2005- 2015
 |
| |
|
 | Figure 13. NMR Built-Up Land Cover between 1995 and 2015 |
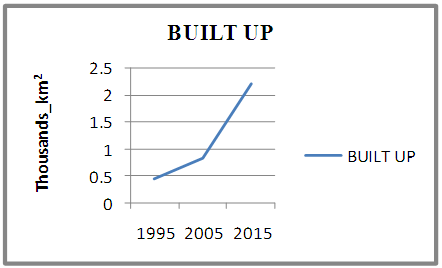 | Figure 14. Graph showing the NMR built-up area between 1995 and 2015 |
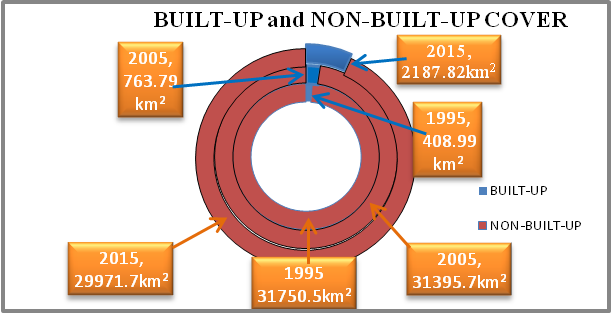 | Figure 15. Built-Up and Non-Built-Up Land Cover |
Rural areas covered 31750.51km2 (98.73 %), 31395.71 km2 (97.62%) and 29971.68km2 (93.20 %) in 1995, 2005 and 2015 respectively (Figure 15).
3.6. The NMR Urban Growth Analysis
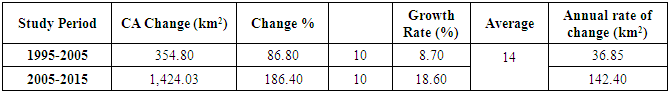
The Concentric zone, axial development and multiple nuclei theories explain urban growth in the NMR.Infrastructure projects like roads, electricity and water supply led to the expansion of the urban centres resulting from improved accessibility, service delivery and living standards in general. Built-up expansion occurred in a radial-axial manner along transport routes away from the core Nairobi city towards the urban centres and away from the urban centres towards Nairobi (Figures 7, 8 and 9).The urban land mass expanded rapidly between 2005 and 2015 (1424.03km2) compared to between 1995 and 2005 (354.80km2) (Figure 16).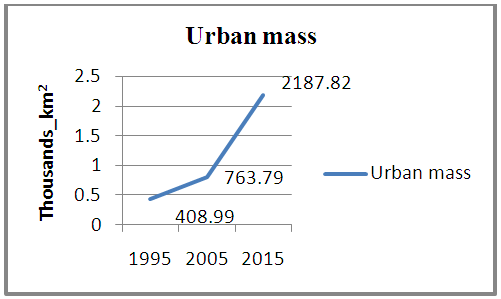 | Figure 16. Urban Spatial Expansion between 1995 and 2015 |
Urban growth was analysed using the indicator system. AUSEI was used to determine temporal changes in urban areas and growth rates (Table 8). Spatial metrics were used to describe and quantify changes in urban land cover (Table 9).Table 8. Description of the NMR using spatial metrics
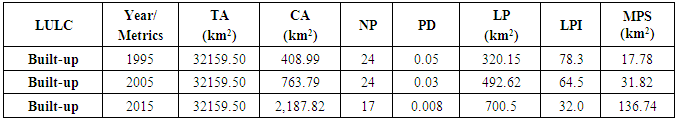 |
| |
|
Table 9. Analysis of built-up area expansion based on CA metrics
 |
| |
|
The number of patches (NP) metric quantifies the number of individual urban centres. There were 24 patches in 1995 and in 2005. NP reduced to 17 as a result of urban centres expanding towards each other and merging into continuous urban land cover. Changes in LPI and PD (fragmentation metrics) imply a decrease in spatial heterogeneity. There is reduced fragmentation of the built-up area in the region. A decrease in PD from 0.05 in 1995 to 0.008 in 2015 indicated the expansion of patches as a result of rapid continuous development and a decrease in the number of patches (Table 8).Nairobi city is the largest patch (LP) in the NMR. The significant decrease in the largest patch index (LPI) in the NMR indicated the expansion of the other urban centres or patches and a reduction in the non-built-up area in the region (Figure 17).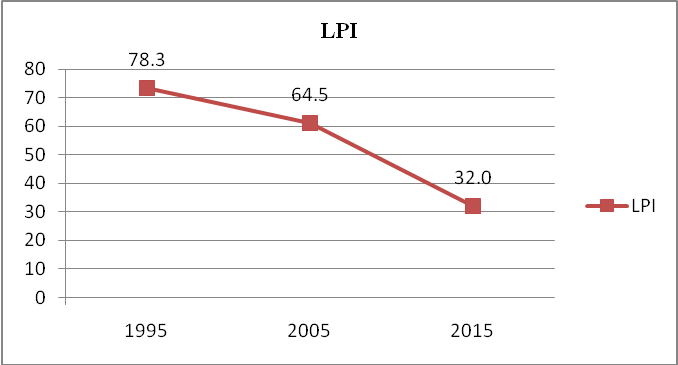 | Figure 17. Graph showing NMR largest patch index (LPI) |
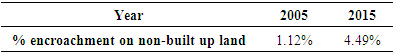
Continuous urban growth and development in the built-up area led to an increase in MPS and a reduction in fragmentation hence a reduction in the NP and PD caused by merging of the patches into larger patches. These patches grew as a result of their proximity to the dominant patch. NP reduced from 24 to 17 and PD from 0.05 to 0.008 (Table 8). The rates of urban land cover expansion varied during the 1995-2005 and 2005-2015 time periods (Table 9).According to the CA metric, the total built-up area increased by 1778.83km2 between 1995 and 2015.With regard to 1995, built-up land cover expanded by encroaching on non built-up land cover by 1.12% and 4.49% in 2005 and 2015 respectively (Table 10). 1778.83 km2non urban land cover was converted to urban land cover within the study period.Table 10. Built-up encroachment on non-built up land with regard to 1995
 |
| |
|
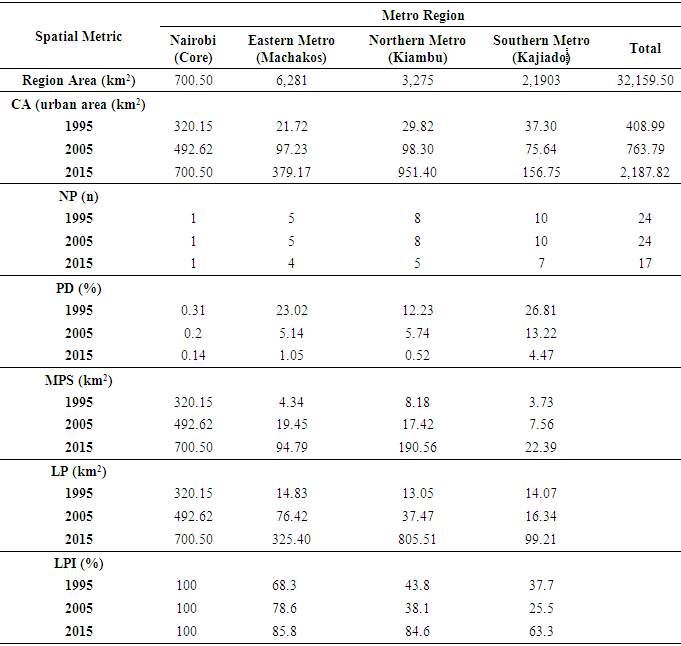
The expansion of Kangundo and Tala urban centres demonstrate the effect of topography on urban growth. Kangundo town has not expanded extensively as compared to Tala trading centre due to the nature of the terrain at its location. By the year 2015, Nairobi County was 100% urbanised with an urban land cover of 700.50km2. It was followed by the Northern metro (Kiambu county) and then the Eastern metro (Machakos county) with urban areas of 951.40km2 and 379.17km2 respectively. The Southern metro (Kajiado county) is the least urbanised region in the NMR with 156.75km2 of urban land cover and a patch density of 4.47 (Table 11).Table 11. Description of the NMR regions using spatial metrics
 |
| |
|
4. Conclusions
Significant urban growth influenced by both spatial and non-spatial factors occurred in the NMR within the study period especially after formation of the Ministry of Nairobi Metropolitan Development (MoNMeD) in the year 2008. Urban expansion in the NMR was dominated by extension developments and sprawl in a radial-axial manner at the Nairobi city periphery onto agricultural land in the rural areas. The expansion happened along transport routes from Nairobi city to other urban centres and from the urban centres to Nairobi city. The expansion was determined by environmental, social-economic, political, and technological factors. The government economic policy, improvements in infrastructure, part VI of the Physical Planning Act(CAP 286) of 1996, high values of land at the CBD’s i.e at the core Nairobi city and at the NMR urban centres, topography, population increase in the region and people opting to live on less congested affordable land encouraged spatial urban growth. Urban growth in the region does not affect the location of the NMR spatial plan proposed Transport city and Amboseli new town. The Cyber city, Knowledge cum Health city and the Aerotropolis need to be relocated due to urbanization. The spatial plan forecasted an urban land cover of 1,717.72km2 by the year 2030, yet by the year 2015, the NMR urban area was 2,187.82 km2. Lack of information about spatial urban growth in NMR like up to date maps prepared from high resolution satellite imagery denies planners a synoptic view of built up and non-built up areas in the region needed to formulate sustainable urban development strategies.Urban growth monitoring in the NMR will guide resource managers in making prudent decisions and for appropriate allocation of resources. The maps will guide the NMR planners in defining urban growth boundaries and delineate land uses.
ACKNOWLEDGEMENTS
We acknowledge the Regional Centre for Mapping Resources and Development (RCMRD) for their support with the satellite imagery used in this study.
References
| [1] | Al-sharif et al. "Quantitative analysis of urban sprawl in Tripoli using Pearson’s Chi-Square statistics and urban expansion intensity index." IPOScience (IOP Publishing), 2006. |
| [2] | Batta, B. Analysis of Urban Growth and Sprawl from Remote Sensing Data. Springer-Verlag Berlin Heidelberg, 2010. |
| [3] | Batty, Michael. "Geopatial analysis and modelling of urban structure and dynamics." The Geojournal, 1999. |
| [4] | Bousquet, Anne. Urban development in Kenya: Towards inclusive cities. No. 2008. Nairobi: French Institute for Research in Africa, 2008. |
| [5] | Cheng, Jianquan. Modelling Spatial and Temporal Urban Growth. Enschede: Febodruk BV, Enschede, The Netherlands, 2003. |
| [6] | Dubovyk. O., Sliuzas, R, Flacke. J. "Spatial temporal modelling of informal settlement development in Sancaktepe district, Istanbul, Turkey." Isprs journal of photogrammetry and remote sensing (66)2, 2011: 235-246. |
| [7] | MoNMeD. Final Spatial Planning Concept for Nairobi Metopolitan Region. Nairobi: GoK, 2012. |
| [8] | MoNMeD. Nairobi Metro 2030. Nairobi: Government of Kenya, 2008. |
| [9] | MoNMeD. Request for Proposals (RFP) to Develop a Spatial Planning Concept for the Nairobi Metropolitan region, Nairobi. Nairobi: GoK, 2009. |
| [10] | MoNMeD. The first edition of the Spatial Planning Concept. Nairobi: GoK, 2012. |
| [11] | Mubea, Kenneth. W. "Monitoring Land-Use Change in Nakuru (Kenya) Using Multi-Sensor Satellite Data." Advances in Remote Sensing., 2012: 1,74-84. |
| [12] | Mundia, Charles. Ndegwa, and Aniya. M. "Analysis of Land Use Land Cover Changes and Urban Expansion of Nairobi City Using Remoote Sensing." International Journal of Remote Sensing, 2005: 2831-2849. |
| [13] | Omwenga, Mairura. "Nairobi - Emerging Metropolitan Region: Development Planning and Management Opportunities and Challenges." Nairobi, 2010. |
| [14] | O'neil, R. V., Krummel, J. R., Gardner, R.H., Sugihara, G., Jackson, B,. "Indices of landscape pattern." Landscape ecology 1(3), 1988: 53-162. |
| [15] | Paul. N, Balchin, Bull Gregory. H, and Hieve. Jeffrey. L. Urban Land Economics, Fifth Edition. Palgrave Macmillan, 1995. |
| [16] | Pham, H.M., and Y. Yamaguch. "Urban growth and change analysis using remote sensing and spatial metrics fom 1975 to 2003 for Hanoi, Vietnam." International journal of remote sensing, 32(7), 2011: 1901-1915. |
| [17] | Ravindra, K.V. "Application of remote sensing and GIS technique for efficient urban planning in India." 2008. |
| [18] | UN HABITAT. Save Our Cites. EARTH ACTION, 1996. |

 Abstract
 Reference
 Full-Text PDF
 Full-text HTML