-
Paper Information
- Next Paper
- Paper Submission
-
Journal Information
- About This Journal
- Editorial Board
- Current Issue
- Archive
- Author Guidelines
- Contact Us
American Journal of Geographic Information System
p-ISSN: 2163-1131 e-ISSN: 2163-114X
2017; 6(2): 54-63
doi:10.5923/j.ajgis.20170602.02

Analysis of Standard Gauge Railway Using GIS and Remote Sensing
 Abstract
 Reference
 Full-Text PDF
 Full-text HTML
Josphat Ngunyi, Charles Mundia, Moses Gachari
Dedan Kimathi University of Technology, Institute of Geomatics, GIS and Remote Sensing, Nyeri, Kenya
Correspondence to: Josphat Ngunyi, Dedan Kimathi University of Technology, Institute of Geomatics, GIS and Remote Sensing, Nyeri, Kenya.
| Email: |  |
Copyright © 2017 Scientific & Academic Publishing. All Rights Reserved.
This work is licensed under the Creative Commons Attribution International License (CC BY).
http://creativecommons.org/licenses/by/4.0/

This research study was undertaken to determine optimal railway route using Remote Sensing and GIS modelling for the standard gauge railway. The factors for optimal routing were land use, geology, slope, topographic maps, and GIS layers relating to hydrology and transportation network. An expert questionnaire was administered to experts and professionals to obtain their responses on the relative importance of various factors in least cost path determination. The questionnaire analysis was used to derive weights for the variables using Multi-criteria Analysis and Analytical Hierarchy Process. A model was developed incorporating route length and the identified factors to generate an optimal route for the standard gauge railway. Geospatial Information System (GIS) was used for spatial modelling, analysis and data overlay. The optimal paths based on environmental, engineering and a combination of both engineering and environmental factors were derived and a comparison made. The results show that a purely environmental optimal route would be 90km longer than a purely engineering route. This demonstrates that optimal route planning using GIS could provide strong decision support for users in determining optimalroutes.
Keywords: Analytical Hierarchy Process, Multi-Criteria Analysis, Modelling, Optimal route, Spatial modelling
Cite this paper: Josphat Ngunyi, Charles Mundia, Moses Gachari, Analysis of Standard Gauge Railway Using GIS and Remote Sensing, American Journal of Geographic Information System, Vol. 6 No. 2, 2017, pp. 54-63. doi: 10.5923/j.ajgis.20170602.02.
Article Outline
1. Introduction
- Railway lines are the most efficient, cost effective and environmentally friendly means of transport both for human and heavy cargo transport. Efficient railway line leads to reduced wear and tear on roads, protects the environment through reduced emissions and accelerates industrialization through improved and cheap transport [12]. In the process of analyzing and evaluating solutions to infrastructure problems in a country, such as railway line, different criteria, and appropriate measures depending on such criteria, are used [4]. Traditionally, economic criteria and monetary measures were used dominantly in the analysis of infrastructure solutions. In contemporary conditions, characterized by population growth in cities and consequently more complex conditions for implementation of infrastructure solutions, the social aspect of the solution must be taken into account [3]. The impacts of selected solutions on the environment need to be considered through a comprehensive analysis of environmental issues. In the analysis of optimal routes through two dimensional spaces, they must first be transferred into a one dimensional graph structure with a finite set of movement options [1]. This is achieved using the cost surface approach in GIS. The cost accumulated surface can be calculated by considering the required factors that concern the routing process and combining them using a Multi-Criteria Analysis (MCA) approach through the Analytical Hierarchy Process (AHP) [2]. These methods have been used to solve real world problems such as: determination of optimal alignment of linear construction, [9], roads, [20] canals, power transmission lines and pipelines. Routes for linear engineering structures such as roads, railways, or pipelines are constrained by physical, environmental, political, social, economic and other regulatory factors. A system that can optimize these constraints and identify tradeoffs among these factors can produce a wide range of alternatives solutions [15]. It has also been applicable in modeling processes of human movement in archaeological research, management of protected and recreational areas and ecological research in order to predict the movement and migration of wildlife [16].In optimal analysis of railway lines, researchers have proposed a mix of factors. These factors include slope, land use and soil type [6], roads, geology, towns and population density [11]. The application of appropriate algorithms [13] and [17] and the use of GIS layers is important. Multi-criteria Analysis are tools developed to improve the decision making process in complex situations and are aimed at raising the level of transparency and objectivity of the solution selection process. Such problems are solved by finding the best or optimal alternative or a set of those good alternatives based on defined factors and their weights [19].Recent studies involving route planning process using GIS for optimality conclude that GIS assisted methodology of route planning is fast, and superior in comparison with the conventional and traditional method which is tiresome, slow and consumes a lot of time. MCE and least cost pathway functionalities was employed to generate a railway route from Rasht to Anzali in Iran. [5] The research considered a number of criteria that included roads, rivers, land cover, geology and cultural heritage. [8] used remotely sensed data and GIS for pipeline routing in a small section of the proposed Caspian oil pipeline. [10] in their research used GIS in routing high speed railway line in Minnesota Province, USA. [7] used a combination of spatial multiple criteria decision making in GIS. Environment in their research to choose the best railway line alternative. Geospatial layers and dominant factors included slope, protected areas, main roads, streams, faults, geology, land use and privacy of villages and town.It has also been demonstrated how an innovative approach, assisted by a GIS was used to analyze the multiple route option to determine a preferred route. [18]. [14], in their paper proposed a method for optimizing the choice of a ‘high speed rail’ (HRS), corridor based on “multi-criteria analysis” using GIS. This method was applied to a real case so as to evaluate and judge its economic feasibility as well as its social and environmental impact.
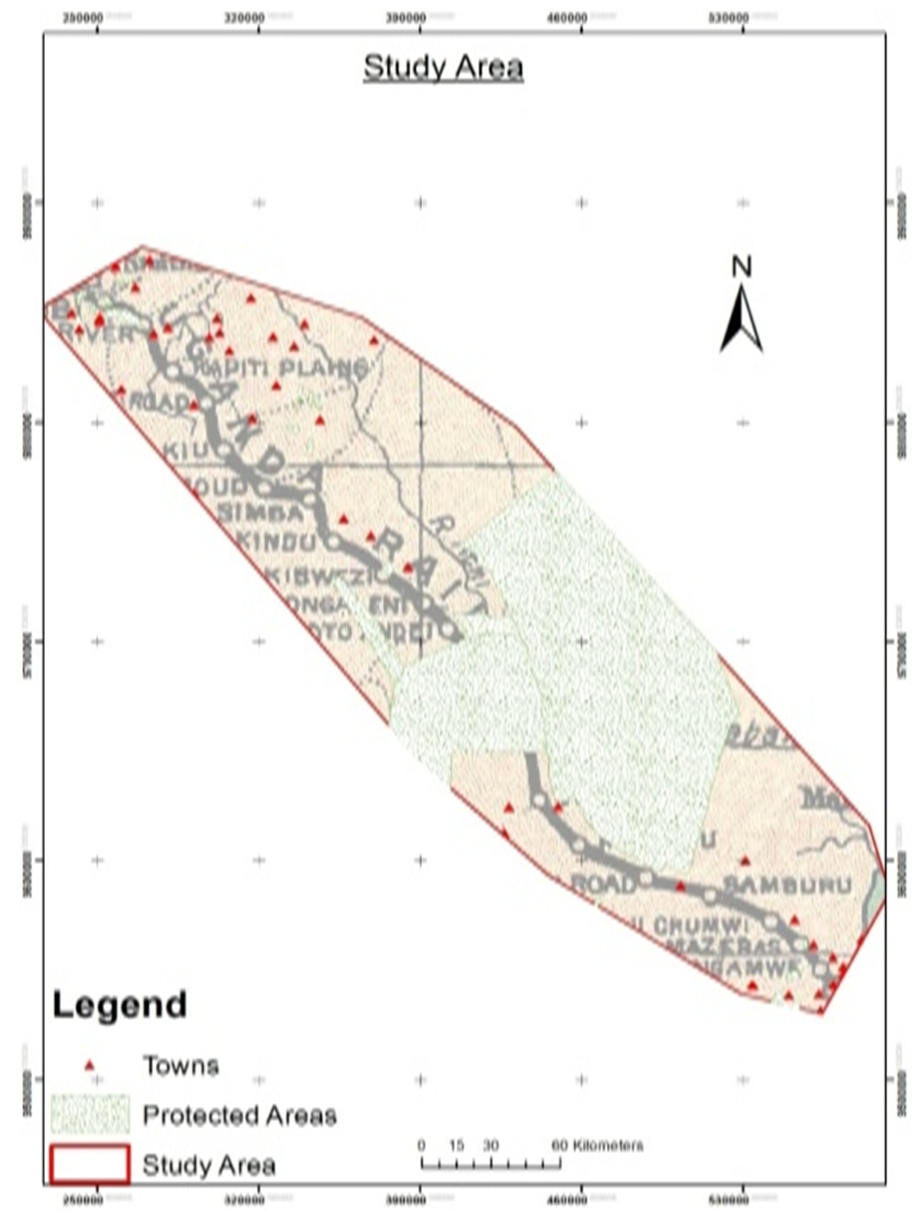 | Figure 1. Study Area |
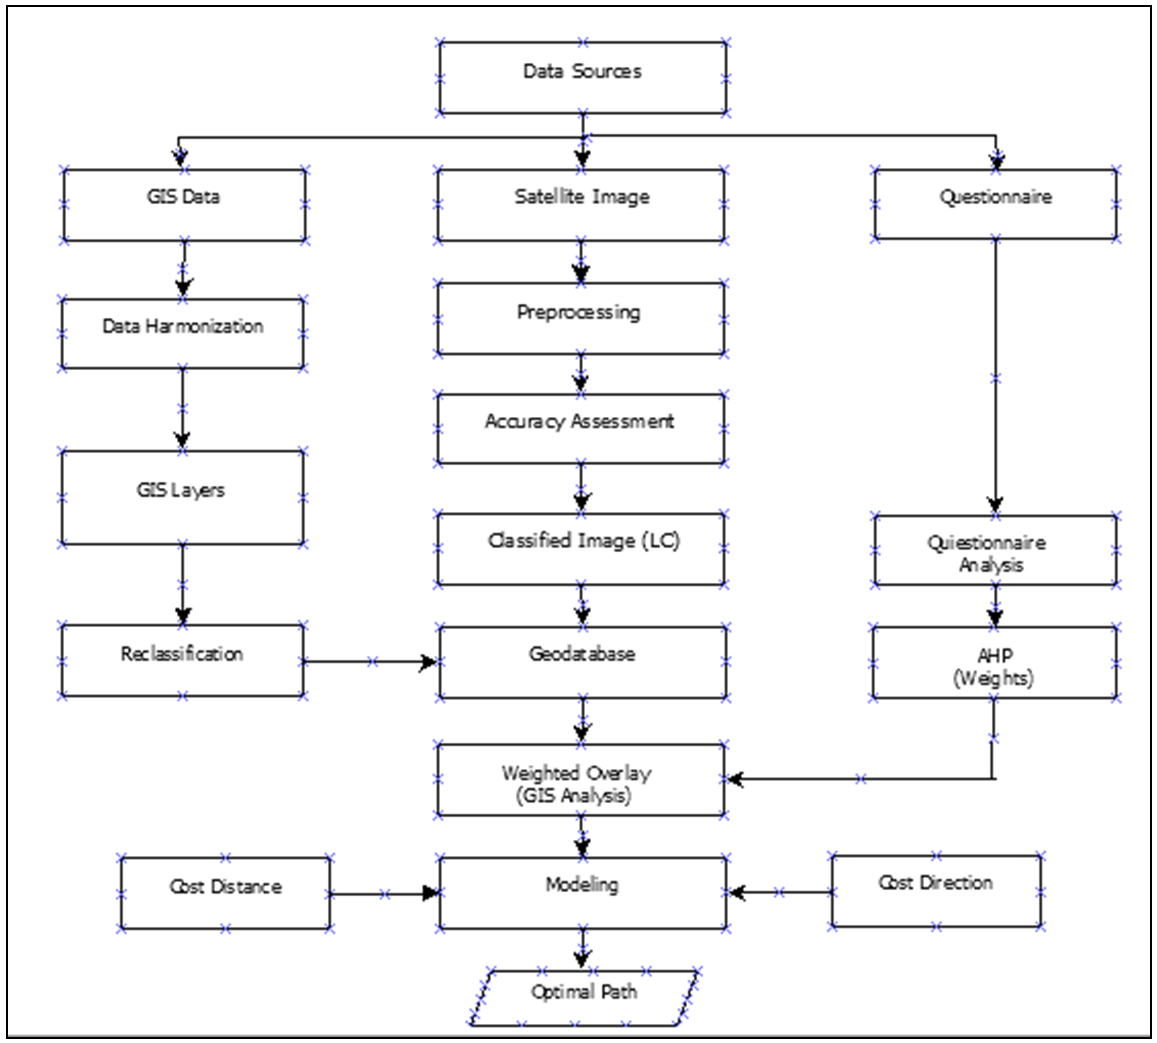 | Figure 2. Research methodology |
2. Methodology
2.1. Study Area
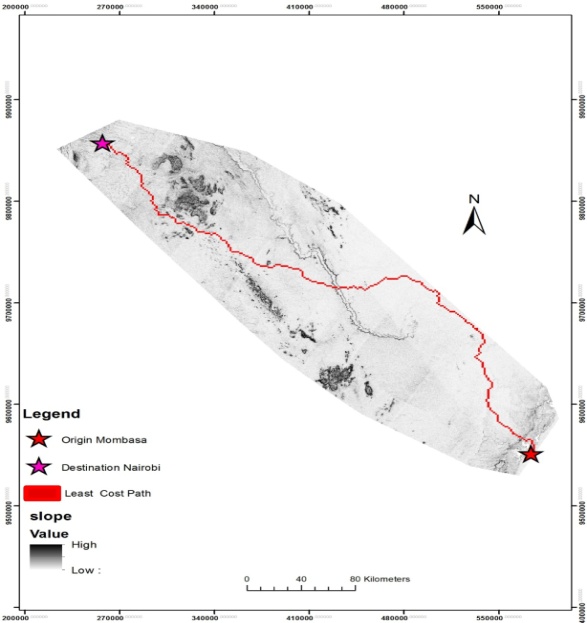
- The starting point for the route analysis was Mombasa while destination was Nairobi. The study area covers a distance of approximately 427.4km between Mombasa 4°03′S 38o40′E and Nairobi 1°16′S 36°48′E. Mombasa is the lowest point Mombasa is at sea level in the Indian Ocean and the elevation steadily increases to about 1795 metres above sea level in Nairobi. It passes through counties with varying population densities. Along the standard gauge railway, the geology comprises the coastal terrigenous lastic sediments of the Karoo system which belongs to the Jurassic and tertiary volcanic. The quaternary sediments include soils, alluvial sands and sandstones in the coastal region. Inland along the railway line are volcanic rocks of tertiary and quaternary sediments which are sources of limestone, clays, manganese and construction materials. Base metal minerals such as lead, zinc, barite and copper are also known to occur in the sedimentary basin. The main social economic activities along the rail route is tourism, agriculture, mining, sisal processing, gemstone mining, manufacturing, horticulture, livestock, steel mills industries as well as cement production. Other income generating activities include sand harvesting quarrying, soda ash mining as well as irrigation farming. The SGR culminates in Nairobi, the capital city, which participates in various social economic activities including industrialization, manufacturing, service industries, tourism and trade.
2.2. Study Approach
- To generate least cost path for the SGR project, the study began by sourcing both spatial and non-spatial data from different sources. Upon acquisition of the data, they were harmonized in order that they become consistent in terms of extent and co-ordinate system. The satellite image was then subjected to information extraction using maximum likelihood classification to derive thematic classes which were used as input to the weighted overlay.Maximum likelihood classification to derive thematic classes which were used as input to the weighted overlay. After information extraction, an accuracy assessment was conducted in order to test the extent to which the classification results were accurate. Reclassification on GIS layers was conducted. This is the process of taking input cell values and replacing them with new output cell values in order to simplify or change the interpretation of raster data by changing a single value to a new value, or grouping ranges of values into single values. Various datasets were derived including slope from the DEM, distance from roads, existing railway lines, streams and rivers locations, and settlements, using Euclidean distance. These derived data sets were combined to create a suitability map.The GIS reclassified layers and the reclassified image were then used to create a geo-database. This geo-database formed the input layer for the weighted overlay using AHP derived weights from the analysis of the questionnaire. Modelling was performed using cost direction and cost distance raster and the model parameters to generate the least cost paths based on environmental factors, engineering factors and a combination of both environmental and engineering factors. The rules established in the model were to minimize road crossings, rivers, wetlands, agricultural land, forest, game parks/reserves and to maximize on low gradient areas, bare land, and preferably sandy soils but avoid hard rocks, clay soils, high gradients and densely populated areas.
2.3. Datasets and Materials
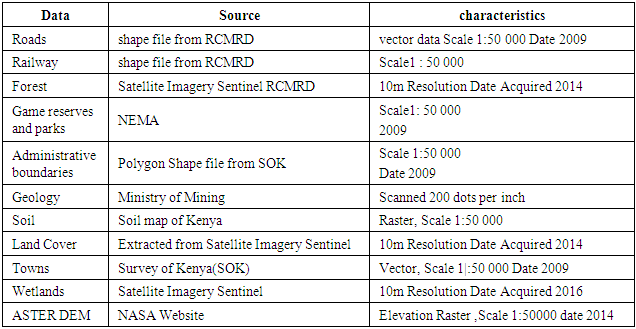
- The spatial data comprise shape-file of towns, protected areas, roads, and administrative boundaries and existing railway lines at a scale of 1:50000.A satellite image was also acquired which was used to extract forest, land cover and wetlands. Information extraction was conducted to generate thematic classes using maximum likelihood classification. Geology and soil maps were also acquired. An ASTER DEM was obtained from NASA website. These data sources were used to create a geo-database to perform GIS analysis with information derived from the expert questionnaires. The derived thematic classes were used as input to the weighted overlay. The aim of the questionnaire was to determine the relative importance of the different factors in railway routing and derive relative weights which were used in the model. Reclassification was applied to the data sets for purposes of weighted overlay.
2.4. Variables Description
2.4.1. Soils
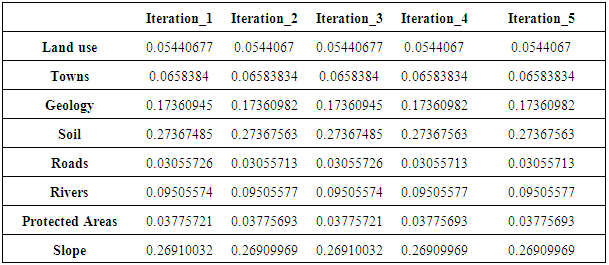
- The soil for railway construction requires thorough investigation of the soil characteristics on the railway route for purposes of identification of suitable soils for use as sub-base and fills materials during construction. A suitable classification of soil properties is necessary as it must be able to support structures under lateral and vertical loads. The route comprised of gravel, sand, silt, clay and peat. The assigned weight of 0.2737 was considered significant engineering factor.
|
2.4.2. Land Use
- The land use map was obtained from satellite image which was classified into five different classes. The different land use classes were used to present the different economic activities over the study area and gave an indication of the suitability or otherwise in the fiscal judgement for the best alternative to select the optimal route. This factor was assigned a weight of 0.0544.
2.4.3. Geology
- The geology map of the study area was obtained from the Ministry of mines. The suitability of the various rock types is optimal railway routing is necessary to be determined and depends on where such rock type is being used. The rocks are carefully evaluated and their suitability determined based on their degree of schistosity, efflorescence and mica content as well as inherent stability, permeability and settlement. Other parameters under consideration include rock structure, stratification, and hydro geological conditions relating to underground water and their effects, and geotechnics such as rock boundaries, response surface and geographic configurations. This engineering factor was given a weight of 0.1736.
2.4.4. Towns
- This spatial layer was given a weight of 0.0658. Its importance lies in the growth strategy of towns along or near the railway route.
2.4.5. Roads
- Roads play the role of substitute transportation network. Suitable distances of roads from railway routes are determined. A weight of 0.0305 was assigned in this analysis.
2.4.6. Rivers
- Suitable distance is determined so that the rail route does not pass very near a rail route. It’s also recommended to keep river crossings to a minimum in order to keep construction costs low. A weight of 0.0950 was used in the analysis.
2.4.7. Protected Areas
- This environmental factor was assigned a weight of 0.0377. Protected areas include forests, game parks, wildlife habitats, archaeological sites and monuments.
2.4.8. Slope
- This engineering factor was assigned a weight of 0.2691 which was quite significant and the lower the gradient the more suitable the location of the railway route.
3. Results and Discussion
- The GIS data acquired was harmonized in a spatial environment to achieve a consistent scale, extent and uniform co-ordinate system so that the data could be seamlessly integrated prior to analysis. The responses from the experts in the SGR routing questionnaire were used to define criteria for re-classifying the data into ranges. The reclassified images ranged between 1 (least suitable) to 6 (Most suitable). For all the factors that were to participate in the weighted overlay, reclassification based on a common scale was done using ranges given as response from questionnaires. For instance slopes between 0 – 15 percent was re-classed as 6 (most ideal).The satellite data acquired required image enhancement to improve visual appearance, pan sharpening to improve spatial resolution and sub-setting the image to the study area. Maximum likelihood classification was used for information extraction, using the IPCC classification standards. The generated information classes were then assessed for accuracy using the accuracy assessment’s confusion matrix. The intent of the classification process is to categorize all pixels in a digital image into one of several land cover classes, or "themes". This categorized data may then be used to produce thematic maps of the land cover present in an image. The objective of image classification was to identify and present the features occurring in an image in terms of the object or type of land cover these features actually represent on the ground. This was followed by an accuracy assessment, which was used to gauge, to what extent the classification was accurate, relative to a sample ground truth data from the ground. The results of the accuracy assessment, therefore give confidence in the results and they can thus be trusted in the subsequent phase of the research.The land use classes were reclassified to a scale of 1-5 where 1 represented least suitable whereas 5 represented most suitable. Digital classification was used since it allows several manipulations to be performed with the data, such as merging of different spectral data, which can help to improve modeling of the biophysical ground data (such as tree diameter, height, basal area, biomass) using the remotely sensed data. Digital analysis also allows for the immediate computation of areas associated with the different land categories. The AHP process was used to derive weights for each factor that participated in the weighted overlay. The responses were used to generate the pairwise comparison matrix, whose eigen vector is the matrix of weights. Several iterations were conducted in order to ensure consistent eigen vector values for subsequent iterations and the fifth iteration was adopted as the weighted matrix. Weighted Overlay was performed to create a suitability raster from the weighted average of the values of the re-classified inputs by subjecting each pixel to a weighted sum such that the output is a suitability raster for which each pixel shows to what extent the pixel is suitable for railway routing. These suitability layers were created using environmental and engineering factors respectively. The environmental factors comprised landcover/landuse, wetlands/rivers, protected areas and towns. The engineering factors were geology, soils and slope. These factors were assigned weights as derived from questionnaire results using AHP as shown in Table 2 and used to generate Environmental and Engineering cost rasters as shown in Figures 3 and 4.
|
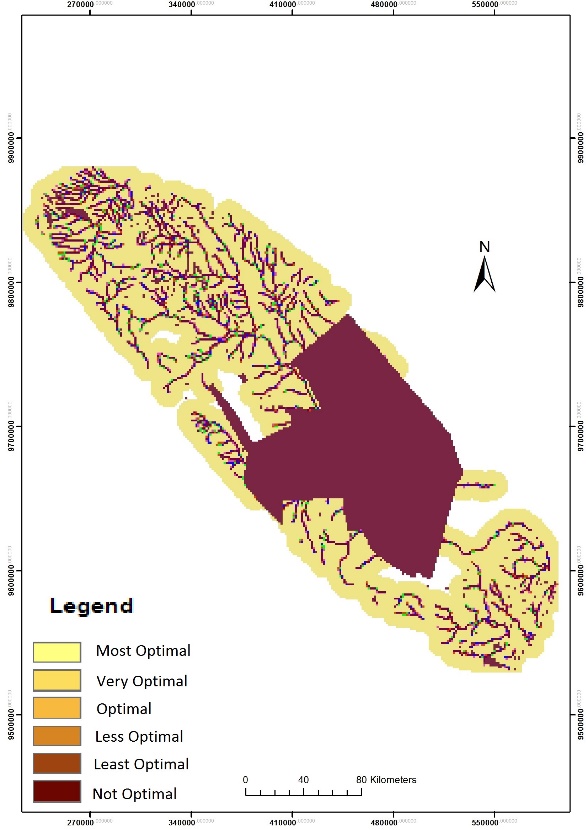 | Figure 3. Environmental Cost Raster |
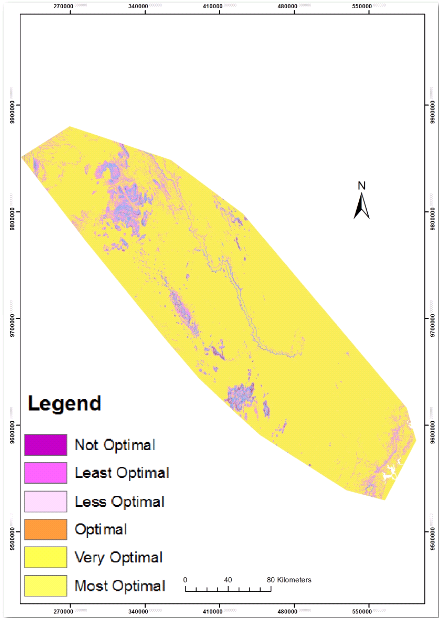 | Figure 4. Engineering Cost Raster |
|
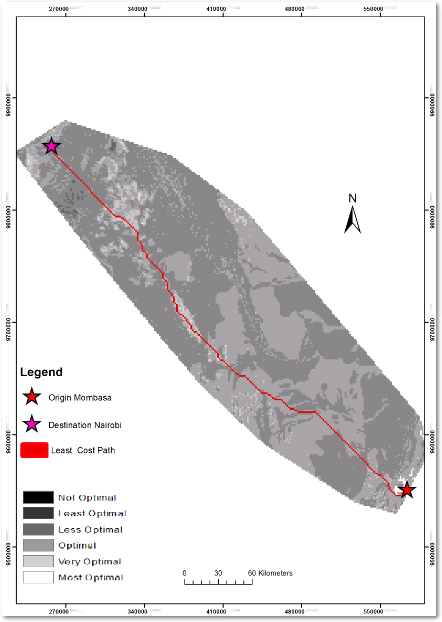 | Figure 5. Engineering Optimal Path |
 | Figure 6. Environmental Optimal Path |
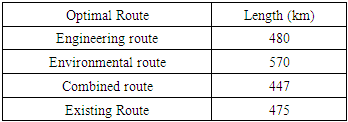
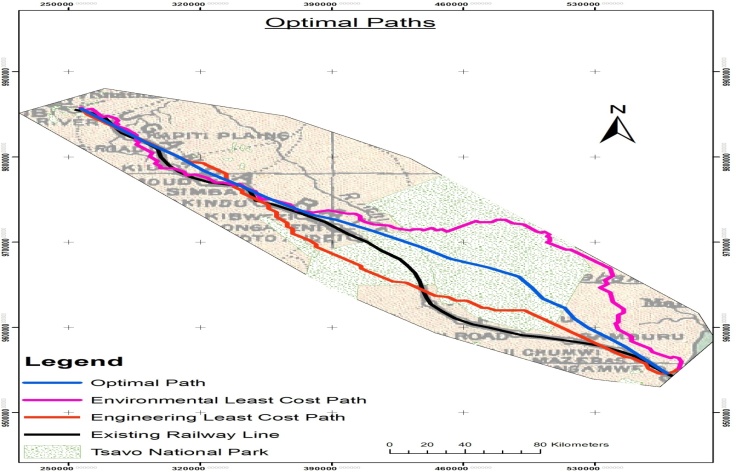 | Figure 7. A comparison of different route scenarios |
4. Conclusions
- Optimal routing for critical infrastructure is crucial for national development. This study was therefore undertaken to determine optimal railway route location using Remote Sensing and GIS modelling for the standard gauge railway line running from the Kenyan coast to Nairobi. In determining optimal route using GIS and Remote Sensing various constraints and criterion were used to develop a model. The database comprised GIS layers, Satellite Imagery and a Questionnaire of Experts. These data layers were overlaid using AHP weights. Three optimal routes were generated based on engineering factors, environmental factors and a combination of the two. The existing railway line measures 475km. The environmental route measure 570 km while the engineering route measured 480 km. The combined route measures 447.05km. The results show that a purely environmental optimal route would be 90km longer than a purely engineering route. This does not necessarily mean higher costs since the advantages that accrue to environmental conservation may actually supersede gains made on the shorter engineering route. However, a consideration of both engineering and environmental factors trade off shows an optimal route which is about 28km shorter while a purely engineering route is 5km longer than the existing route. This close comparison of the optimal engineering route and the existing route implies a good consideration of engineering factors during railway routing. The research study also shows that the existing route compares well with the GIS derived optimal route. The model developed can be used for modelling different linear structures in Kenya. The research highlights the dynamics of railway line routing and demonstrates the interrelationship among various factors. It demonstrates that optimal routes in linear structures can be achieved with a high degree of accuracy if all factors affecting linear routing can be considered. Political considerations can be avoided. The effects of Environmental impacts can be considered at a higher scale and classes of main factors can be incorporated to refine the model and the expected results. Availability of high accuracy data would lead to better results in determining the optimal routes.