American Journal of Geographic Information System

p-ISSN: 2163-1131    e-ISSN: 2163-114X

2017;  6(2): 41-53

doi:10.5923/j.ajgis.20170602.01


Integrated a GIS and Multicriteria Evaluation approach for Mapping Flood Vulnerability of Buildings in the Grande Niaye Watershed of Dakar, Senegal

Aimée Diop1, 2, Mamadou L. Ndiaye2, Hyacinthe Sambou1, 2, Honoré Dacosta3, Bienvenu Sambou1

1Institute of Environmental Sciences, Cheikh Anta Diop University, Dakar, Senegal

2Training and Research Laboratory in Geoinformation, Cheikh Anta Diop University, Dakar, Senegal

3Department of Geography, Cheikh Anta Diop University, Dakar, Senegal

Correspondence to: Aimée Diop, Institute of Environmental Sciences, Cheikh Anta Diop University, Dakar, Senegal.

Email:

Copyright © 2017 Scientific & Academic Publishing. All Rights Reserved.

This work is licensed under the Creative Commons Attribution International License (CC BY).
http://creativecommons.org/licenses/by/4.0/

Abstract

The watershed of Grande Niaye in Dakar is precisely located in the center-west of the Dakar region, capital city of Senegal. This basin, because of its wet ecosystems mainly called “Niayes”, seems fairly representative of areas at significant risks to flooding in the Dakar region and especially in its peri-urban area. Based on the diversity of factors that are considered responsible for flooding, this study aims to draw attention by evaluating the vulnerability of the watershed to flooding using GIS and Multicriteria Evaluation Approach (MCE). This study considered six factors as indexes of flood vulnerability identification and these included elevation, slope, groundwater level, soil type and the distance between dwelling areas and wetlands. These information were derived from aerial photograph of 1942 and satellite image of 2014, SRTM, nature of soil and groundwater level data of the study area. The data is standardized to facilitate the processing treatment. The criteria are then reclassified, scored, and weighted before being conducted to an aggregation step using the weighted linear combination (WLC) method to rank the various vulnerabilities of builds, using weighted sum overlay tool in ArcGIS 10.2 platforms. The modeling study and analysis of the results indicate four levels of vulnerability: highly vulnerable, moderately vulnerable, vulnerable and lowly vulnerable. As a result, 75% of the Grande Niaye watershed area is approximately vulnerable to flooding. Moreover, about 50% of the houses and buildings services occupy the vulnerable surfaces of the watershed. Overall, the results indicate that the study area constitutes a great danger to the well-being of the populations. In order to sustainably reduce flooding in the area, policy makers, urban planners and managers must, in the long term, promote a management policy based on the preservation and rehabilitation of wetlands in the Niaye. Indeed, their main function is the capture, regulation and the management of the full of waters due to the high vulnerability to the flooding of the buildings that are built in these wetlands.

Keywords: GIS, MCE, Flood vulnerability of buildings, Grande Niaye Watershed, Dakar, Senegal

Cite this paper: Aimée Diop, Mamadou L. Ndiaye, Hyacinthe Sambou, Honoré Dacosta, Bienvenu Sambou, Integrated a GIS and Multicriteria Evaluation approach for Mapping Flood Vulnerability of Buildings in the Grande Niaye Watershed of Dakar, Senegal, American Journal of Geographic Information System, Vol. 6 No. 2, 2017, pp. 41-53. doi: 10.5923/j.ajgis.20170602.01.

1. Introduction

Over the last 20 years, floods have become the most frequent and intense disasters in the world particularly in Africa [34]. Indeed, from 2011 to 2013, out of 147 disasters recorded on the African continent 67 are related to floods. They are responsible for one-third of the economic damage caused by disasters from 2001 to 2010 and accounted for 90% of economic losses from 2011 to 2012 refer to [61].
Senegal, a coastal country located in the western part of the African continent, is also affected by disasters caused by human activities and environmental damage [36]. These disasters include floods that have been a real national concern over the past few years because of their impacts [26]. However, floods mainly affect an urban area that is why they are considered as an urban social issue [58].
Dakar, the capital city of the country, comprises most of the country infrastructures and a quarter (23%) of the Senegalese population and accounts only 3% of the national territory [4]. Located in the coastal Sahelian climatic zone, the Dakar region records on average of only 400 mm of rain per year [19, 44]. The return to normal rainfall activities only exposes the poorly controlled occupation of the soil [54]. Indeed, the Dakar region is particularly vulnerable to floods due to the high population growth, a strong expansion of the urban fabric, the state of the drainage network and the conversion of natural and agricultural zones into dwelling areas [39, 18, 45]. The increasing of the floods in 2005, 2008, 2009 and 2012 is a key factor [65, 42, 16]. As such, vulnerability to flooding in the Dakar region is defined as being natural, in other words linked to physical characteristics, and / or caused by anthropogenic factors such as land occupation [3].
The Dakar region is highly vulnerable to climate change [66], which is likely to exacerbate the incidence of heavy rainfall [32]. Actually, the intensification of urbanization may increase the population's exposure to flooding.
Attempts at sustainable flood management in the Dakar region have not currently major impacts. Populations living in areas at risk are still in fear of the weather stormy which seems to be increasing every year [26, 44]. Indeed, the organizational, environmental and socio-economic conditions of the Dakar make it difficult to understand and manage floods, which are source of debate every year as the rainy season approaches [21].
In the evolution of flood risks management, a shift from one control strategy study to another based on controlling the vulnerability of infrastructures, accommodation or populations [56, 63]. Vulnerability is one of the key facts of flood risk and impacts when the risk occurs [31]. Its consideration is therefore essential to reduce the risk of flooding. However, this vulnerability is multidimensional and dynamic because it depends on several factors [48] and the attempts to evaluate it are numerous and methodologically various [56]. Thus, some researchers use a quantitative approach based on potential impacts on human living and property [49]. On the other hand, others evaluate it in term of factors related to damage or to the capacity of the populations’ reactions to a catastrophic situation [13]. In the Dakar region, most vulnerability studies consist in estimating the damage caused by the floods or investigating the causes. Some efforts should be done concerning decision-making measures that include an interdisciplinary and systemic approach [45].
GIS and multicriteria evaluation approaches are a perfect combination for proposing decision-support support, especially for spatially referenced problems. As a result, many real world spatial problems give rise to multi-criteria decision making based on geographical information system [5]. And according to [2] GIS has the capability to handle and simulate the necessary data gathered from various sources; it combines spatial data with quantitative, qualitative, and descriptive information databases, which can support a wide range of spatial queries. A multi-criteria evaluation (MCE) method can serve to inventorize, classify, analyze and conveniently arrange the available information concerning choice-possibilities in regional planning [64]. According to [37], 80% of the decision problems faced by an individual have a spatial connotation. Multi-criteria analysis is a spatial analysis method that combines several criteria, of different natures, in order to obtain results based on mapping indicating areas more or less able to solve the problem [7]. And a criterion is a judgment factor on the basis of which an action is measured and evaluated [10]. The identification of these criteria requires the collection and crossing of mapping and satellite imagery data. There are several criteria aggregation algorithms, including Weighted Linear Combination (WLC) [2]. It is one of the widely used MCE methods for land suitability analysis. Weighted linear combination, is based on the concept of a weighted average in which continuous criteria are standardized to a common numeric range, and then combined by means of a weighted average [38]. This method provides better site selection because of its flexibility in selecting the optimum sites. It has been the subject of numerous studies and in a wide range of fields [5, 24, 33, 41, 46, 47],
The main objective of this work is to carry out a spatial analysis of the vulnerability of the houses and public services to flooding in the Grande Niaye watershed. First, we will analyze land exploitation in the watershed, before and after its urbanization (1942 and 2014). The aim is to be able to identify natural spaces from those occupied by human activities and especially by the houses. This study is a contribution of to understand the disaster risks such as floods, which is a priority of the Sendai Framework for Disaster Risk Reduction, 2015-2030 [60], of which Senegal is a party.

2. Presentation of the Study Area

The Grande Niaye watershed is located in the center-west of the Dakar (Figure 1) and extends to 12.58 km2. It is the greatest part of the "Grande Niaye of Dakar". The latter is a particular ecosystem [17], atypical in the Sahel [12] and which involves several wetlands called "Niayes" [20].
Figure 1. Location of study area
The Grande Niaye watershed is characterized by rich biodiversity due to their presence in different areas of Dakar such as "Grande Niaye of Dakar", namely Niaye of Pikine, Niaye of Patte d'Oie and Niaye of Hann Maristes. The photographs 1 and 2 illustrate these Niayes. Surveys carried out in the area indicate an ornithological richness [22] and floristic [57]. However, these wet ecosystems play important socio-economic functions for the development of Dakar region and its inhabitants.
Photo 1. Wetland of the Niaye of Patte d’Oie
Photo 2. Wetland of the Niaye of Pikine
The hydrogeological unit that characterizes the study area is the water layer of the quaternary sands called the Thiaroye water layer. This water layer is made of clays and marls of the lower Eocene and is mainly renewed from rainwater [3]. The very low position of the wetlands causes the emerging of the water layer up to around 1.20 meter on average [57] and is in favor of the existence and lasting lakes. The availability of water supports the development of many income-generating activities such as market gardening, arboriculture, floriculture, fishing, pottery, grazing, palm wine exploitation and tanning [14]. The rather special microclimate present in the Niayes area, despite the large number of cars that run through the area, facilitates the reception of tourist and recreational activities.
The rainfall of the Grande Niaye watershed is similar to that of the Dakar region, estimated annually at around 400 mm [19]. The temperature varies from 28°C to 36°C [19].
The Grande Niaye watershed accounts for 10 administrative districts between the departments of Dakar, Pikine and Guédiawaye. They are very often confronted with floods being mainly located in the peri-urban zone of Dakar [16, 43]. In fact nearly 40% of the population in the Dakar peri-urban zone is highly exposed to flooding, whereas this risk is only 19% for those who live in the urban area [66]. The reason for this is most of the buildings found there are built in depressed and flood-prone areas which are formerly occupied by the Niayes [21, 25, 18, 30]. The lack of an efficient system of sewage and rainwater evacuation with strong demographic pressure is also found in all municipalities.

3. Methodology

3.1. Data use and Preprocessing

The data used in this study are from three sources: satellite, mapping and GIS. Some of them are about aerial pictures taken in 1942 (before the Great Drought), a 2014 Orbview satellite image, a Digital Terrain Model (DEM), a soil map and GPS surveys on the groundwater level of the study area. DEM information is acquired by the Shuttle Radar Topography Mission (SRTM) of the National Geospatial–Intelligence Agency (NGA) [62]. The DEM has a resolution of 30 × 30 m, and is available at the Global Land Cover Facility (GLCF). The pre-processing steps consist of data georeferencing, extraction of the study area, vectorization of map data and conversion to raster. For the spatialization of the groundwater level, an interpolation using the Inverse Distance Weighting (IDW) method is used. It enables to calculate, the average of the experimental values of its neighbors, preferring the closest points. All selected data is converted to raster and resampled at 30 m for easy analysis. All the raster data layers (criteria) were projected to UTM coordinate system for on-screen digitization. The selected criteria are shown in figure 2. And the pertinence of these criteria is described in table 1.
Figure 2. All selected criteria for vulnerability mapping
Table 1. Identification and description of the selected criteria in this study
     

3.2. Land Use Mapping

Figure 3 show a subset of each of Aerial photo, acquired in 1942 and a QuickBird, acquired in November 2014, respectively. These images are used to create land use maps, and to extract build layer. The images were geometrically corrected and geocoded to the Universal Transverse Mercator (UTM) coordinate system by using a reference image. A minimum of 10 regularly distributed ground control points (GCPs) were selected from the images. Resembling was performed using a nearest neighbor algorithm. The transformation had a root mean square (RMS) error of 0.5 pixels indicating that the image was accurate to within one pixel. The land use classes’ discrimination was based on a visual interpretation of images covering the study area in different dates and using ArcGIS 10.2 software. The visual interpretation of the aerial photographs was based on an interpretation key driven from image patterns and thematic meaning of dominant classes [39]. This approach consists of visually separating the different components from the soil through their spectral, textural and geometric characteristics. Then, three (03) types of land occupations are identified for the year 1942, such as: surface waters which are the areas occupied by water permanently and temporarily, bare surfaces and vegetation. For the year 2014, eight (08) types land occupation are identified in the area, namely: surface waters, houses, bare areas, areas of activity for market gardening, anthropogenic vegetation, Aquatic vegetation and dune vegetation. A total of 50 ground truth points (GTPs) were selected for each images. These points were verified in the field using a GPS (Garmin) and cartographic data from the study area. To validate the classifications, we computed two statistical indices: the global precision and the Kappa index. The overall classification accuracy is given by the average of correctly categorized pixels (MPCC) (Equation 1).
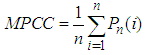
Where n is the total number of pixels included in the matrix.
The Kappa coefficient is a quality estimator that takes into account row and column errors. It varies from 0 to 1 (Girard and Girard, 1999). The latter is calculated using equation (2).
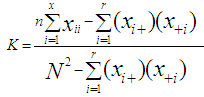
Where r is the number of rows in the matrix, xii is the number of observations in row i and column i (i.e., diagonal element, xi+ and x+i are the marginal totals of rows i and column i, respectly, and N is the total number of observations.
Figure 3. Overview of the Remote Sensing data used in this study: (a) Aerial photo of 1942 and (b) Satellite image of 2014

3.3. Mapping of Flood Vulnerability of Buildings

The mapping of the buildings vulnerable to floods in the The mapping of the buildings vulnerable to floods in the basin of the Grande Niaye of Dakar is adopted according to a multicriteria approach. For this we take into account these following criteria: elevation, slope, groundwater level, soil type and water areas in 1942 and 2014. The choice of year 1942 is justified by the high level of wetness the Niayes area before the great drought of the 1970s. On the classified images, we extracted the wetlands of 1942 and 2014 and we calculated Euclidean distances in order to use them for modeling. And all the criteria are of the factor type, because they are characterized by a quite various level of vulnerability, contrary to the criteria of constraint or binary which characterizes the vulnerability or not of a selected criterion [28]. Then we made sure that all the criteria are standardized, that’s to say converted into raster mode, to ensure that they have the same size (number of rows and columns) and the same resolution (30m). After this operation the criteria and sub-criteria were evaluated in order to assign them weights and scores.
According to [52], a fundamental problem of decision theory is how to derive weights for a set of activities according to importance. Importance is usually judged according to several criteria. Therefore, many decision-making methods attempt to determine the relative importance, or weight, of the alternatives in terms of each criterion involved in a given decision-making problem [5]. Thomas Saaty (1980) developed a new approach called Analytical Hierarchy Process (AHP) in order to refine the decision-making process by examining the coherence and logic of the decision maker's preferences. The AHP is the most widely accepted method and is considered by many as the most reliable multi-criteria decision making method [5]. This approach is based on pairwise comparison and arouses the interest of many researchers in a wide range of fields [6, 45, 59]. In this study, the criteria weight was calculated based on the AHP method using expert choice on the scores of each criterion. AHP suggests the use of a pairwise comparison matrix to compare the criteria, based on an evaluation scale defined by [53]. Using this comparison matrix, the selected criteria are evaluated by the experts to determine their relative weight. These experts are a total of nine and are researchers in the following fields: urban planning and architectures, spatial planning, environmental sciences and physical geography. Computed scores are assigned to the different sub-criteria on a scale of 1 to 4, where 1 = highly vulnerable, 2 = moderately vulnerable, 3 = vulnerable, and 4 = Lowly vulnerable. All classifications and grading values in spatial analysis come from expert opinion and field surveys conducted in the study area. The criteria and the sub-criteria used, their scores, and their weights are summarized in table 2.
Table 2. Attribute scores and weights for the maps Used for the location of areas vulnerable to flooding
     
For the aggregation of the criteria layers, Weighted Linear Combination (WLC) has been used. The WLC technique is a decision rule for deriving composite maps using GIS. It is one of the most often used decision models in GIS [67]. And it has four major phases: i. Criteria definition, ii. Values normalization of criteria layers (commensurate value attributes), iii. Weights definition and iiii. Weighted layers combination (weighted overlaying). To apply the WLC analysis practically, weighted sum overlay tool in ArcGIS 10.2 software was used. A weighted sum analysis provides the ability to weight and combine multiple inputs to create an integrated analysis; in other words, it combines multiple raster inputs, representing multiple factors, of different weights or relative importance [2]. The WLC analysis was applied using the following equation:
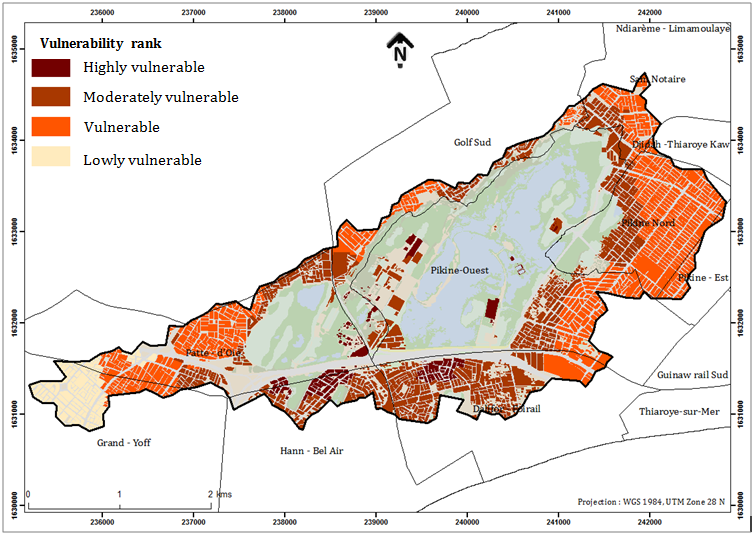
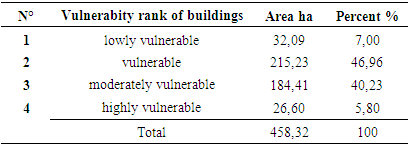
Where S is the suitability, wi is a weighting of factor i, and xi is the criterion score of factor i.
To identify the build vulnerable to the floods, we vectorized the result of the vulnerability, and then selected by locality the build according to the vulnerability. Ultimately, the proportion of each level of fracture vulnerability is calculated using the following formula:
With: = proportion of vulnerability of a given build class; area of a vulnerable building class; and corresponds to the remainder of vulnerable building class.
Figure 4. Organization Chart of the Data Processing Process

4. Results and Discussion

4.1. Land Use Mapping

The classification results are evaluated using a confusion matrix. The overall accuracies of the images classification is 84.22% and 89.65% and Kappa index, 0.82 and 0.87 respectively in 1942 and 2014. Overall, the accuracy of classification is considered good. Errors of omission and commission remain relatively low on all dates. In addition to the physiographic characteristics of a watershed, the importance of vegetation, the presence of natural lakes or ponds, the rate of waterproofing of the soil plays an important role in the infiltration and flow of water to the outlet [35]. Figures 5 and 6 show land use evolution in 1942 and 2014 in the Grande Niaye watershed. Consequently, the Grande Niaye watershed has become very impermeable from between these two dates. Indeed, the area of water and vegetation predominated in 1942, with 417.11 ha and 752.87 ha, respectively, corresponding to 33.15% and 59.85% (Table 3). On the other hand, the buildings occupy 458.60 ha in 2014 and predominate at 43.64% in the watershed. As for vegetation, it decreased strongly from 59.85 in 1942 to 21.13 in 2014. In 1942, surface waters were fairly well distributed in the watershed. On the other hand, they are mainly concentrated in the relics of the wetlands in 2014, and particularly in the Niaye de Pikine. The Niayes constitute catchment and storage areas for runoff. By reducing the area occupied by the Niayes, the buildings also reduced the drainage area of the watershed. This would justify the recurrence of urban flooding in the area. These result from the difficulty of infiltration of runoff in urban areas following the increase of waterproofed surfaces [17]. The crossing of the natural characteristics of the watershed with the land use has made it possible to better understand the degree of vulnerability of populations to floods.
Figure 5. Land use in 1942 in the Grande Niaye watershed
Figure 6. Land use in 2014 in the Grande Niaye watershed
Table 3. Area of land use units in the Grande Niaye watershed in 1942 and 2014
     

4.2. Flood Vulnerability in the Grande Niaye Watershed

The result of the vulnerability of the Grande Niaye watershed to flooding is illustrated in Figure 7 and Table 4. This result shows that the level of vulnerability varies from one commune to another and within the same commune. However, the level of vulnerability to flooding is increasing as and when we are close of the Niayes wetlands.
Figure 7. Vulnerability to flood in the Grande Niaye watershed
Table 4. Flood vulnerability statistics in the Grande Niaye Dakar watershed
     
The area that is highly vulnerable to flooding occupies 303.39 ha, or about 25% of the total area of the watershed. It concerns the central and southern part of the watershed. This is particularly the communes of Pikine-Ouest, Golf Sud, Dalifort, Hann Bel-Air and the Patte d'Oie.
The moderately vulnerable area to flooding is 624.24 ha, or about 50%. It is located mainly in the communes cited above, and in a lesser extent the communes of Pikine-Nord, Sam Notaire. Overall, about 75% of the study area is vulnerable to flooding.

4.3. Flood Vulnerability of Buildings

The result of vulnerability to flooding in buildings is shown in Figure 8 and Table 5. The analysis shows that buildings highly vulnerable to flooding occupy an area of 26.60 ha, or 5.80%. They are mainly located in the communes of Dalifort, Hann-Bel-Air, Patte-d'Oie and Pikine-Ouest. On the other hand, buildings moderately vulnerable to flooding occupy 184.41 ha, or about 40%. They concern those of the communes cited above. In sum, it is estimated that about 46% of the buildings in the Grande Niaye watershed are vulnerable to flooding.
The results also show that the buildings closest to the Niayes wetlands are the most vulnerable to flooding. This is why the buildings within the relics of the Niayes have vulnerability levels between: moderately vulnerable and highly vulnerable to flooding. Therefore, the primary function of the Niayes is the regulation of the full of water, a function which is incompatible with the construction of infrastructure.
Figure 8. Vulnerability of the buildings to flooding in the Grande Niaye watershed
Table 5. Statistics on the vulnerability of buildings to flooding in the Grande Niaye watershed
     

5. Conclusions

This study, carried out in a multicriteria approach, made it possible to assess the vulnerability of the Grande Niaye watershed to floods. It identified the areas most vulnerable to flooding but also the main risk factors for floods. The various criteria or factors explaining the vulnerability were first identified. Their combination has then to obtain the results relating to the vulnerability of the watershed and the buildings to the floods. Indeed, out of about 75% of the watershed vulnerable to flooding, 45% of buildings are concerned. Thus, the Grande Niaye watershed is highly vulnerable to flooding as well as its constructions. However, due to their degree of vulnerability, the build of the Communes of Dalifort and Hann Bel-Air has priority in the management of the floods. On the whole of the results, it is noted that the level of vulnerability to the floods increases as and when that we are close to the wetlands. Thus, the predominant factor in the vulnerability of constructions to floods is linked to the occupation of wetlands, particularly of the Grande Niaye of Pikine. This is increasingly the subject of a strong land pressure. In response to this situation, the authorities should take measures for sustainable wetland management. These include integrating wetland preservation and rehabilitation into management plans and policies to reduce the risk of flooding.

References

[1]  ADISE (2013). Association of Graduates of the Institute of Environmental Sciences. The preservation of the Technopôle, a challenge for all. Adise.environnement@gmail.com, 6 p.
[2]  Al-Hanbali, A., Alsaaideh, B. & Kondoh, A. (2011). Using GIS-Based Weighted Linear Combination Analysis and Remote Sensing Techniques to Select Optimum Solid Waste Disposal Sites within Mafraq City, Jordan. Journal of Geographic Information System, 2011, 3, 267-278. doi:10.4236/jgis.2011.34023.
[3]  ANRSA (2012). National Agency of Applied Scientific Research of Senegal. Scientific contribution to the ten-year plan of Sustainable Flood Management in Senegal, Workshop Act, Synoptic Document, 23 p.
[4]  ANSD (2010). National Agency of Statistics and Demography. Economic and social situation of the Dakar region in 2009, 114 p.
[5]  Ayehu, G. T. & Besufekad, S. A. (2015). Land Suitability Analysis for Rice Production: A GIS Based Multi-Criteria Decision Approach. American Journal of Geographic Information System, 4(3), DOI: 10.5923/j.ajgis.20150403.02, pp. 95-104.
[6]  Bagheri, M., Sulaiman, W.N.A, & Vaghefi, N. (2012). Land use suitability analysis using multicriteria decision analysis method for Coastal Management and Planning: A case study of Malaysia. Journal of Environment Science and Technology 5(5): 364-372, 2012. Dio: 10.3923/jets.2012.364.372.
[7]  Balzarini, R. (2013). Cognitive approach for the integration of geomatics tools in environmental sciences: Modeling and evaluation. Thesis University of Grenoble, 327 p.
[8]  Bassel, M. (1996). Water and Environment in Dakar: rain, runoff, pollution and evacuation of water. Doctoral Thesis in Geography. University Cheikh Anta Diop of Dakar, 202 p.
[9]  Bodian, A. (2014). Characterization of the recent temporal variability of annual precipitation in Senegal (West Africa). Physio-Géo, Volume 8, DOI: 10.4000/physio-geo.4243, pp. 297-312.
[10]  Chakhar, S., & Martel, J.-M. (2003). Enhancing geographical information systems capabilities with multi-criteria evaluation functions. Journal of Geographic Information and Decision Analysis, 7(2), pp. 47-71.
[11]  Chenal, J. (2009). Urbanization, urban planning and city models in West Africa: games and stakes in public space. PhD thesis in architecture, city, history, 570 p.
[12]  Dasylva, S. & Cosandey, C. (2010). Elements of evaluation and action of sustainable rainwater governance in an urbanized environment in the Sahel for biodiversity and food security. Biodiversity and Environmental Assessment Colloquium, International Francophone Secretariat for Environmental Assessment (SIFEE), Unesco, Paris, 20 p.
[13]  D'Ercole, R., Thouret, J. C., Dollfus, O. & Asté, J. P. (1994). The vulnerabilities of societies and urbanized spaces: concepts, typology, modes of analysis. In Revue de géographie alpine, tome 82, n°4, DOI: 10.3406/rga.1994.3776, pp. 87-96.
[14]  Diallo, F. B. (2015). Socio-spatial dynamics of market gardening in an urban wetland: the example of the Niaye de Pikine, Senegal. Master memory, Institute of Environmental Sciences, Cheikh Anta Diop University of Dakar, 48 p.
[15]  Dieng, N. M. (2009). Analysis of hydrological risks with satellite imagery: case of floods in the Dakar region. Master memory In Applied Geology / Cheikh Anta Diop University of Dakar, 111 p.
[16]  Diongue, M. (2014). Urban Outskirts and risks of flooding in Dakar (Senegal): the case of Yeumbeul Nord. Eso Travaux and documents, Work Summaries, n°37, pp 45-54.
[17]  Diop, A. (2006). Dynamic land occupation of the Niayes in the Dakar region from 1966 to 2003: Examples of the Great Niaye of Pikine and the Niaye of Yeumbeul. Memory of DEA, Institute of Environmental Sciences / Cheikh Anta Diop University of Dakar, 90 p.
[18]  Diop, A., Niang, C. I., Mbow, C. & Diallo, A. D. (2014). Study of the vulnerability of Thiaroye on sea to floods: factors and effects. Liens Nouvelle Série, N° 18 December, pp 186-200.
[19]  Diop, C. & Sagna, P. (2011). Climate vulnerability of Dakar districts in Senegal: Example of Nord-Foire-Azur and Hann-Maristes, Proceedings of the symposium "Reinforcing resilience to urban climate change: from spatialized diagnosis to adaptation measures" (2R2CV) 07 and 08 July 2011, Paul Verlaine University -Metz, France, 12 p.
[20]  DEVU (Direction of Urban Green Spaces), DDH Environnement Ltée (info@ddh-env.com), Cabinet PRESTIGE (prestige@sentoo.sn) and GEOIDD (geoidd@planet.tn) (2004). Elaboration of the Master Plan for Development and Safeguarding of the Niayes and Dakar green zones (PDAS), Report on Diagnostic Studies and Action Program for the Safeguarding and Urban Development of the Niayes and Green Areas of Dakar (PASDUNE), 172 p.
[21]  Djigo, M. (2009). Urban flooding in Senegal is becoming increasingly dangerous and less manageable. Communication on flooding in Dakar, 12 p.
[22]  Dodman, T. & Diagana, C. H. (2003). Censuses of Water Birds in Africa 1999, 2000 and 2001, Wetlands International, African Waterbird Census, Global Series n°16, Wageningen, The Netherlands, 368 p.
[23]  Ecological Monitoring Center (2010). Report on the state of the environment in Senegal, 265 p.
[24]  Emmanuel Udo, A., Ojinnaka, O. C., Baywood, C. N. & Gift, U. A. (2015). Flood Hazard Analysis and Damage Assessment of 2012 Flood in Anambra State Using GIS and Remote Sensing Approach. American Journal of Geographic Information System, 2015, 4(1), DOI: 10.5923/j.ajgis.20150401.03, pp. 38-51.
[25]  Faye, E., Dieng, H., Bogaert, J. & Lejoly J. (2014). Dynamics of the flora and vegetation of the Niayes and Groundnut basin in Senegal. Journal of Agriculture and Environment for international Development (JAEID), 2014, 108 (2): pp. 191- 206.
[26]  GFDRR, (2014). Global Facility for Disaster Reduction and Recovery. Le relèvement et la reconstruction à partir de 2009, Etude de cas pour le Cadre de relèvement post inondations au Sénégal, 44 p.
[27]  Girard, M.C. & Girard, C.M. (1999). Remote Sensing Data Processing. DUNOD Ed. Paris, pp. 236-334.
[28]  Godard, V. (2005). GIS and Decision Support, course notes, Department of Geography, University of Paris 8, France.
[29]  Hubert, P. Servat, E., Paturel, J.-E., Kouame, B., Bendjoudi, H., Carbonnel, J.-P. & Lubes-niel, H. (1998). The segmentation procedure, ten (10) years after. Water Resources Variability in Africa during The XXJh Century (proceedings of The Abidjan'98 Conference held al Abidjan, Côte d'lvoire. November 1998). IAHS Pub. Numéro 252, 1998, 7 p.
[30]  IAGU, (2014). African Institute for Urban Management. Floods in the suburbs of Dakar: Towards Adaptation through Improvements in Building, Infrastructure and Local Governance to Reduce the Vulnerability of Assets of Households and Communities, Final Technical Report. URI/URL: http://hdl.handle.net/10625/53300, n° 107026, 57 p.
[31]  IPCC, (2012). Summary for Policymakers. In: Field, C.B., Barros, V., Stocker, T.F., Qin, D., Dokken, D.J., Ebi, K.L., Mastrandrea, M.D., Mach, K.J., Plattner, G.-K., Allen, S.K., Tignor, M. and Midgley, P.M., Eds., Managing the Risks of Extreme Events and Disasters to Advance Climate Change Adaptation, A Special Report of Working Groups I and II of the Intergovernmental Panel on Climate Change, Cambridge University Press, Cambridge, UK, and New York, p. 1-19.
[32]  IPCC, (2013). Climate change 2013: The scientific elements. Summary for policy makers. Contribution of Working Group I to the fifth Assessment Report of the Intergovernmental Panel on Climate Change. Cambridge University Press, Cambridge, Royaume-Uni et New York (État de New York), États-Unis d’Amérique, 204 p.
[33]  Jankowski, P., Andrienko, N. & Andrienko, G. (2001). Map-centre exploratory approach to multiple criteria spatial decision making. International Journal of Geographical Information Science, Vol. 15, pp. 101-127.
[34]  Jha, Abhas K., Bloch, R. & Lamond, J. (2012). Cities and Flooding: A Guide to Integrated Urban Flood Risk Management for the 21st Century. World Bank Training, https://openknowledge.worldbank.org/handle/10986/2241. DOI: 10.1596/978-0-8213-8866-2, pp. 8-63.
[35]  Laaroubi, H. (2007). Hydrological study of the urban watersheds of Rufisque, PhD thesis in Geography, Cheikh Anta Diop University of Dakar, 265 p. + annexes.
[36]  Lo, M. & Chellouche, Y. A. (2013). National Consultation on the Post-2015 Framework for Action on Disaster Reduction, Report of Senegal with Technical Support from UNISDR Africa, Provisional Version, 90p.
[37]  Malczcewski, J. (1999). GIS and multicriteria decision analysis. Department of geography, University of Western Ontario, John Wiley & Sons, New York, 363 p.
[38]  Malczewski, J. (2004). GIS-Based Land-Use Suitability Analysis: A Critical Overview on ResearchGate, The professional network for scientists, Vol. 62, No. 1, 2004, DOI: 10.1016/j.progress.2003.09.002,URL. pp. 3-65.
[39]  Mbow, C., Diop, A., Diaw, A.T. & Niang, C.I. (2008). Urban Sprawl Development and Flooding at Yeumbeul Suburb (Dakar-Senegal). African Journal of Environmental Science and Technology, Vol. 2(4), pp 75-88.
[40]  MDRH, (1976). Ministry of Rural Development and the hydraulics of Senegal. Master Plan for Water supply and sanitation of Dakar and its region, Study II of the sanitation stormwater and wastewater, State of knowledge, Guidelines for the 3rd phase, 103 p.
[41]  Mokarram, M. & Aminzadeh, F. (2011). Gis-based multicriteria land suitability evaluation using ordered weight averaging with fuzzy quantifier: a case study in Shavur plain, Iran. The International Archives of the Photogrammetry, Remote Sensing and Spatial Information Sciences, Vol. 38, 350 p.
[42]  Ndao, M. (2012). Dynamics and environmental management from 1970 to 2010 of the wetlands in Senegal: Study of the land use by remote sensing of the Niayes with Djiddah Thiaroye Kao (in Dakar), Mboro (in Thiès) and Saint-Louis. PhD, University of Toulouse, Toulouse, 370 p.
[43]  Ndiaye, A. (2011). Geographic information system and remote sensing for the management of natural risks: Application to the floods of the Dakar region (Senegal). Memory of Master II, CRASTE_LF, 97 p.
[44]  Ndiaye, M. L., Traoré, V. B., Touré, M. A., Malomar G., Diaw, A T. & Beye, A. C. (2016b). Contribution of Remote Sensing to the Study of Spatiotemporal Evolution of Rainfall in Senegal: Exploitation of TRMM 3B43 Low Spatial Resolution. Journal of Multidisciplinary Engineering Science Studies, Vol. 2 (7), pp. 748-752.
[45]  Ndiaye, M. L., Traoré, V. B., Touré, M. A., Sambou, A., Diaw, A. T. & Beye, A. C. (2016a). Detection and Ranking of Vulnerable Areas to Urban Flooding Using GIS and ASMC (Spatial Analysis multicriteria): A Case Study in Dakar, Senegal. International Journal of Advanced Engineering, Management and Science (IJAEMS), Vol-2 (8). pp.1270-1277.
[46]  Nisar Ahamed, T. R., Gopal Rao, K. & Murthy, J. S. R. (2000). GIS-based fuzzy membership model for crop-land suitability analysis. Agricultural Systems, 63 (2000), 75–95.
[47]  Prakash, T.N. (2003). Land Suitability Analysis for Agricultural Crops A Fuzzy Multicriteria Decision Making Approach. The Netherlands: International Institute for Geo-information Science and Earth observation Enschede, pp. 6–13. (2).
[48]  Quenault, B., Bertrand, F., Blond, N. & Pigeon, P. (2011). Interdisciplinary and systemic reinterpretation of the couple vulnerability / urban adaptation to climate change. Proceedings of the symposium "Strengthening Resilience to Climate Change in Cities: From Spatial Diagnosis to Adaptation Measures" (2r2cv) 07 and 08 July 2011, Paul Verlaine University - Metz, France. 20 p.
[49]  Rafai, N., Khattabi, A. & Rhazi, L. (2014). Flood modeling of rivers for integrated flood risk management: case of the Tahaddart watershed (north-west of Morocco). Journal of Water Science, vol. 27, n° 1, 2014, p. 57-69. URI, DOI: 10.7202/1021982ar, 13 p.
[50]  Regional Council of Dakar, (2011). What are the synergies for flooding in the Dakar region?, Research-Seminar Report, URL : https://www.urbamonde.org/sites/urbamonde.org/files/seminaire_regional.pdf, 56p.
[51]  Roche, M. (1963). Surface Hydrology. Gauthier-Villars ORSTOM, Paris, 430 p.
[52]  Saaty, T. L. (1977). A scaling method for priorities in hierarchical structures. Journal of mathematical Psychology, No 15, pp. 234-281.
[53]  Saaty, T. L. (1980). The Analytic Hierarchy Process. New-York (USA), McGraw-Hill, 287 p.
[54]  Sène, S. & Ozer, P. (2002). Rainfall evolution and the relationship between floods and rain events in Senegal. Bulletin of the Geographical Society of Liège, n° 42, pp. 27-33.
[55]  SONES (2013). National Senegal Water Company. Emergency fight against floods program, component: disconnection drilling Thiaroye, communication Sones during the workshop to share the results of the water analysis of Diambar pumps and exchanges on pumping drilling Of the Thiaroye groundwaterlevel, 13, 14 and 15 September 2013, Dakar, Senegal, 18 p.
[56]  Soto, D. & Renard, F. (2014). Spatial assessment of the risk of flooding by crossing the hazard and the vulnerability of the stakes: application to the Great Lyon floods. University of Lyon, France. 10 p.
[57]  Thi, C. N. (2013). Preliminary study of the dynamics of land use, some lakes and the vascular flora of the Dakar Technopole, Senegal. Memory of Master II in environment, Cheikh Anta Diop University of Dakar, Institute of Environmental Sciences, 44 p.
[58]  Thiam, M. D. (2011). The flooding syndrome in Senegal. Presses Universitaires of Sahel. 224 p.
[59]  Triantaphyllou, E. & Mann, S.H. (1995). Using the analytic hierarchy process for decision making in engineering applications: some challenges Inter’l Journal of Industrial Engineering: Applications and Practice, Vol. 2, No. 1, pp. 35-44.
[60]  UN (2015). United Nations. Sendai Framework for Disaster Risk Reduction 2015-2030, Third United Nations World Conference in Japan, Sendai, 14-18 March 2015, 35 p.
[61]  UNISDR Africa, CUA & EAC (2013). Secretariat of the International Strategy for Disaster Reduction of the United Nations (Regional Office for Africa), Commission of the African Union and East African Community. Fourth African Regional Platform, Annex 1: Africa's Situation Report on Disaster Risk Reduction. Executive Summary. On 13, 14 and 15 February 2013, Ngurdoto Lodge, Arusha (Tanzania). 5 p.
[62]  USGS (2016). https://earthexplorer.usgs.gov/, website visited in October 2016.
[63]  Veyret Y. & Reghezza M. (2006). Vulnerability and Risks, Recent Vulnerability Approach, Accountability and Environment, n° 43, pp. 9-14.
[64]  Voogd, H. (1983). Multicriteria Evaluation for Urban and Regional Planning, Pion Limited, London.
[65]  Wade, S., Faye, S., Dieng, M., Kaba, M. & Kane, N.R. (2009). Remote sensing of urban flood disasters: the case of the Dakar region (Senegal), Scientific Animation Days (JAS) of the AUF, Algiers November 2009.
[66]  World Bank, (2009). Preparation for the Management of Natural Hazards and Risks Related to Climate Change in Dakar, Senegal: A Spatial and Institutional Approach, Report of the Pilot Study. Washington, DC, World Bank, 112 p.
[67]  Malczewski, J. (2000). On the use of weighted linear combination method in GIS: Common and Best practice approaches, Transactions in GIS, 4(1): pp. 5-22.