American Journal of Geographic Information System

p-ISSN: 2163-1131    e-ISSN: 2163-114X

2017;  6(1): 14-25

doi:10.5923/j.ajgis.20170601.02


Framework Development of Cybercartography for Mobile Environment

Amr H. Ali

Surveying Engineering Department, Faculty of Engineering Shoubra, Benha University, Cairo, Egypt

Correspondence to: Amr H. Ali, Surveying Engineering Department, Faculty of Engineering Shoubra, Benha University, Cairo, Egypt.

Email:

Copyright © 2017 Scientific & Academic Publishing. All Rights Reserved.

This work is licensed under the Creative Commons Attribution International License (CC BY).
http://creativecommons.org/licenses/by/4.0/

Abstract

According to the different wide application of mapping for smart devices, a new paradigm of cartographic principles is needed, where Cybercartography is representing this new era of cartography. The main objective of this research is to propose a conceptual framework for Cybercartography that deals with theories and technologies of dynamic cartographic visualization of spatial data and its interactive use on smart devices. This framework consists of two main domains, the visualization domain and the technology domain. In order to prove the feasibility of the proposed framework, a customized application is developed using standard mobile software development kit (SDK) that is used to build highly focused generic Mobile GIS mapping solution with offline capabilities. It will be on encoding geo-information for smart devices along with handling dynamic symbolization and maintaining quality standards for the map rendering.

Keywords: Cybercartography, Mobile devices, Spatial visualization, Mobile mapping, API

Cite this paper: Amr H. Ali, Framework Development of Cybercartography for Mobile Environment, American Journal of Geographic Information System, Vol. 6 No. 1, 2017, pp. 14-25. doi: 10.5923/j.ajgis.20170601.02.

1. Introduction

With the widespread Internet and web mapping a further ‘democratization’ of the geo-information use took place. Nowadays, the tremendous success of the Internet and the smart mobiles over the last decade, the recent technological waves seem to offer a convergence of the cartographic principles [1].
Cybercartography is a new paradigm for mapping in the information era. It is defined as "the organization, presentation, analysis and communication of spatially referenced information on a wide variety of topics of interest to society". Cybercartography is presented in an interactive, dynamic, multisensory format with the use of multimedia interfaces [2].
Conceptually, Cybercartography is not as a sudden and dramatic shift from past theories of cartography, but it is an evolutionary and integrative process which incorporates fundamental elements with new approaches in theory and practice. It uses multimedia formats and new telecommunication technologies, such as the World Wide Web and mobile. Also, it is highly interactive and engages the user in new ways; it is applied in multi-disciplinary directions as an analytical tool [3].
This paper illustrates a general conceptual framework for geo-information use in a mobile environment. Herein, specific user tasks and requests in a mobile environment are identified and followed by an outline of possible methods to personalize a GIS for better mobile assistance.

2. Methodology

Due to the recent drastic changes of the fields of geo-information technology and cartography, the dissemination of digital geospatial data is no longer bounded by the desktop platform. It is available now on smart devices such as PDAs (personal digital assistants) [4].
We can see that the map display on a handheld device is a challenge to cartographers due to the limiting factors such as screen size, colours, resolution, processing power, memory and power supply, while people are demanding more advanced reliable applications [5].
So, we are going to develop a conceptual framework for Cybercartography that deals with theories and technologies of dynamic cartographic visualization of spatial data and its interactive use on smart devices. This framework consists of two main domains, the visualization domain, and the technology domain. A developed application will be customized to evaluate this frame work. Figure (1) describes the abstract framework of it.
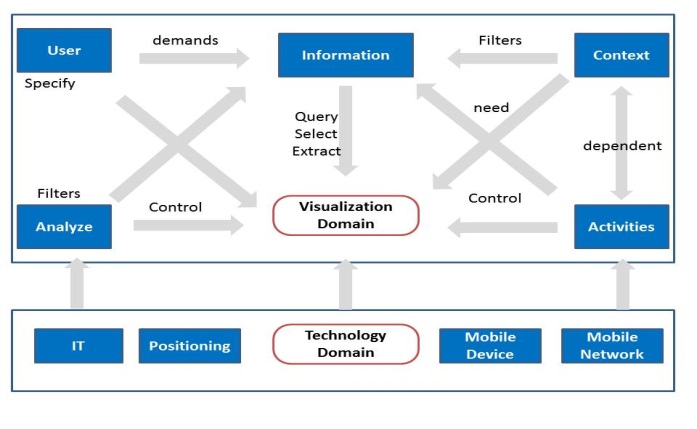
Figure 1. Conceptual Framework of Cybercartography

2.1. Visualization Domain

The main target of this domain is to consider the challenges of the map visualization due to the technical limitations such as small sized display and resolution, lack of processing power and memory, the battery life and the mobile network bandwidth that is considerably narrower than that in fixed networks [1].
Cartographic visualization refers to the creation of a visual image of spatial data "either mentally or physically" by using graphic means [6].
Since, the geo-visualization on small displays is dominated by the constraint of small display sizes. This poses an immense generalization pressure. However, the generalization alone cannot assure the fitness for the uses required in mobile geographic information of image situations. This leads to a very important component, which is grouping of concealing objects. [7].
Data availability at different scales to the users is the new role introduced in mobile cartography. User can switch between different data views as per one’s requirement. At present the spatial data is stored in the form of layers at pre-defined different scales while ambition of the data providers is that they ideally have data at all the scales [8].
During cartographic information analysis process the type of data and the purpose of maps should be firstly understood and analysed so the data can be symbolized to serve the mission of the map. The information in the reality can be divided into four main data types; Nominal data on different nature/identity of things (qualitative), Ordinal data with clear order, though not quantitatively determined (ordered), Interval quantitative information with arbitrary zero, and Ratio quantitative data with absolute zero [4] as shown in Figure (2).
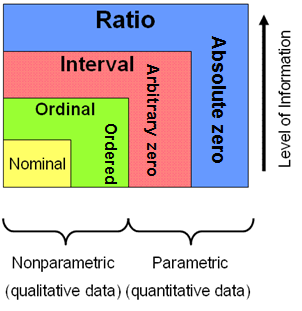
Figure 2. Different Data Types [10]
The data to be visualized will always refer to objects or phenomena in reality. To select each symbol from one another, six visual variables are distinguished as shown in Figure (3) [9].
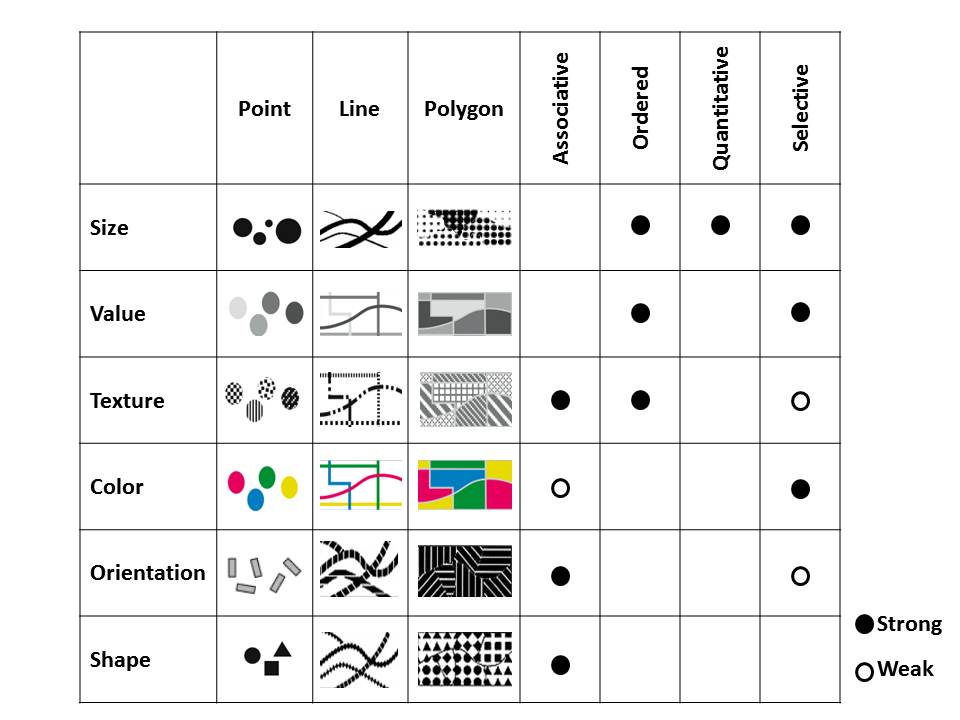
Figure 3. Basic Visual Cartographic Variables
The visual variables have certain perception properties, where it should be matched with the nature of information to be represented. Meanwhile, the grouping in these categories is based on how they stimulate a certain perceptual behaviour within the map user. The most important design principles for cartography are legibility, visual contrast, figure-ground, and hierarchical structure.
Legibility is how the graphic symbols are used to depict reality. The size and familiarity with the area are factors that affect the legibility. Contrast is important in presenting features to be easily distinguished from the adjacent and the background. The separation of visual field into figure and ground that is also necessary when we need to focus on specific criteria of the given information.
Due to the complexity of real environment, successful map requires some kind of structuring information. Three kinds of hierarchical organization are used in mapping features. The first one is stereogrammic, which gives the map users the impression that classes of features lie at different visual levels. The second one is the extensional; this refers to the ranking of the features and therefore is usually ordinal. The latter is sub divisional, which is significant when you want to portray the internal relationships of a hierarchy especially in case of area features [10].
Practically, the basic map design/visualization principles will remain applicable for mobile environment and linked to the technology domain, while the rest of the problems are legibility and contrast.

2.2. Technology Domain

Generally, the mobile computing environment is characterized by some technical limitations that reflect on the performance. The Display size of the devices is still the major limitation. It makes the graphical design different from PC applications, where spatial data must be readable at different zoom levels regardless of different screen sizes. Thus, generalization and grouping of concealing objects is required. The most common solution is using zooming and panning. Zooming option can be available in three different ways: (a) Static linear zooming where the relation between zoom factor and map content is static. When zooming operation is applied into the map, the image is linearly enlarged without changing the content of the map, (b) Static stepped zooming, where a series of maps of the same area is available, each one designed for a different scale or scale range. When the user requests zoom in or out, the software automatically selects the most suitable maps for the desired scale. This can be used in case of mobile maps but require constant link with the server at high speed as at each zoom in or out activity the data is retrieved from the server and rendered on the client device. (c) Dynamic zooming: In this case there is direct relation between map scale and content. The larger the scale the more detail is shown in the map. The cartographic symbolization may change with change of scale [11].
Another factor is that the paper maps and digital maps usually use the geometric or abstract symbols to represent the ground features. Now in case of mobile maps there is no space for a legend and users doesn’t have time to understand the symbols. These factors give another challenge to the map design.
The solution to this problem is to use the pictographic symbols/colours that must be self-explanatory and familiar to the users, such as blue for water, green for vegetation etc.., where, pictorial symbols require large space to become legible. The symbol's size needs to be determined optimally so that they give the messages in effective way without hindering the other features of the map [12].
This critical size of symbols leads to another limitation, which is the legibility of the symbols and text. Also, labelling every feature cannot be applied as it will make the map cluttered. Therefore, certain possibilities such as mouse over tool tips can be used, which triggers the information in text form describing the object. One more possibility to increase the legibility of the symbol can be that while the user moves his/her pointer on the object its size gets bigger and by clicking it gives further information [13].
Another one of the biggest limitations is the frequent need to keep the file size small; this in turn leads to the need to optimize the amount of information on a map and to take great care with generalization [14].
Moreover, the smart devices have low colour range varying from 8 bit (256 colours) to 16 bit (65536 colours), so while designing maps it is safest to assume the user’s configuration set to be 256 colours. In case of mobile maps visual contrast becomes more important considering the outdoor viewing conditions. Thus, the contrast between different features in the map needs to be increased to enhance the visibility [15].
Furthermore, most of the mobile maps services used raster maps, thus it is difficult to interact with and require large space for storage. These kinds of problems can be solved by using vector approach, where it makes it easy to transfer through the narrow bandwidths. Finally, visualization to the user can be created and showing the name of the features in many languages, where the user will get map in local language he prefers to use. Based on that, new possibilities of visualization can be offered like adaptability, user focus, dynamism, and context awareness. Figure (4) shows the basic principles of adaptive mapping.
Figure 4. Conceptual framework of mobile cartography and adaptation components
Adaptive map rendering means the ability of the visualization technique to adapt to a specific user and his current context. The context influences the information demand of a user. This demand can be expressed by explicit queries to map. However, user and context also define the amount and detail of information and the way this information is visualized. This means that for the same location, different visualizations can be generated for different users.
The adaptive map is rendered for the mobile visualization process in a raster format that integrated with vector files. To demonstrate the geo-visualization adaptation, we define a geo-visualization service with the display of points of interest (POI), landmarks, and related territory with its routes search results capabilities.
These services should produce visualized maps based on cartographic principles, which can be rendered fast, graphically concise, attractive, crisp, and legible. In addition, their content should be adaptive to different users, activities, and situations [16].
To prove the possibility of the proposed approach we will develop a prototype application. The main focus will be on encoding geo-information for mobile devices with handling dynamic Symbolization and maintaining quality standards for the map rendering.

3. Case Study

The area chosen for this research is Nasr city, the first area subdistrict, Cairo, Egypt as shown in Figures (5a and 5b). The map prepared by field survey at a scale of 1:5000 and contains the major natural and man-made features (water bodies, street network, land marks and POI).
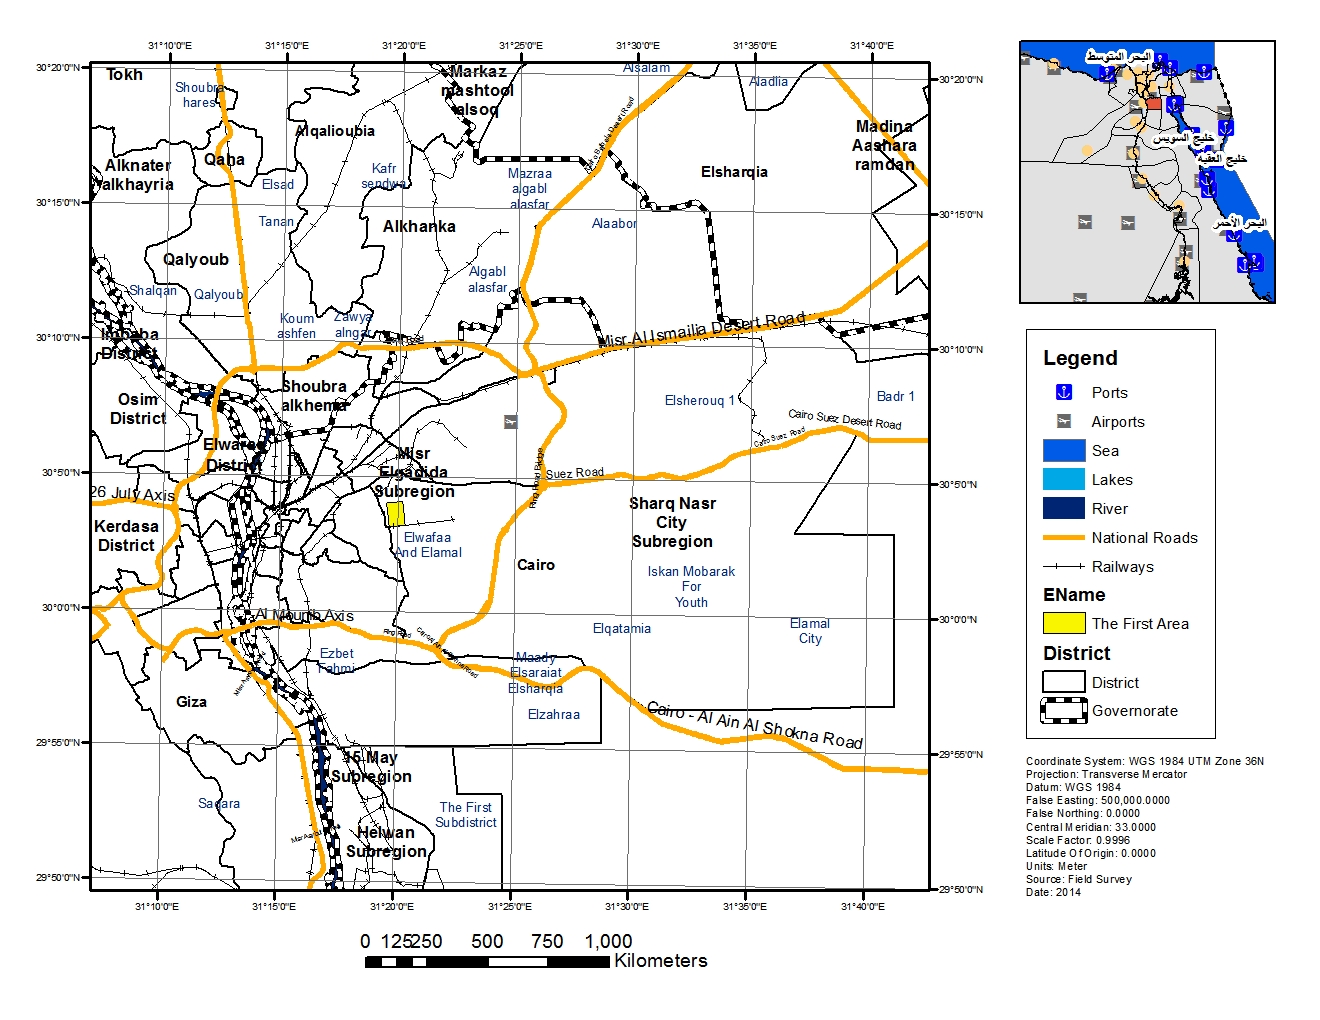
Figure 5(a). The First Area sub district, Nasr City, Cairo, Egypt
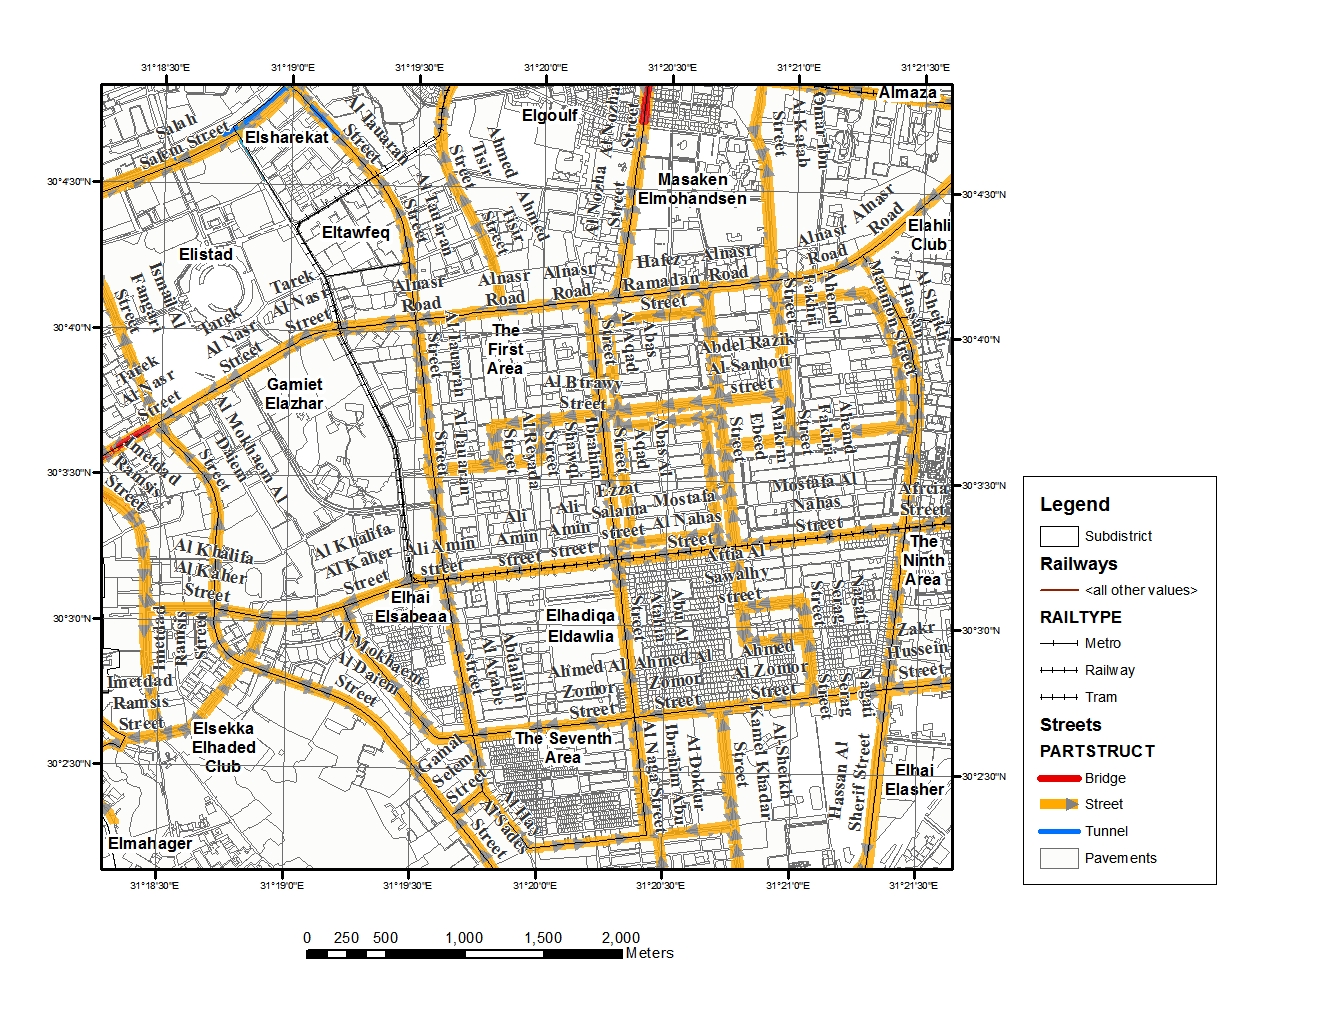
Figure 5(b). The First Area sub district, Nasr City map
The proposed application is developed with the help of the Windows mobile software development kit (SDK) for the Microsoft. NET framework.
The goal of this application is to develop a map client application programming interface (API) with offline capabilities and to provide a highly performance map viewer, showing spatial data from different sources.
The end-user will get a better map view with smooth graphics rendering, intuitive and responsive controls for interaction. Also, it has the capability to integrate with the positioning gathered using GPS.
The system consists of two major components the desktop utility, and mobile utility. The desktop utility is a customized tool that developed to automate the ESRI ARCGIS software for the proposed map cache scenario. Maps that will be displayed and edited on a mobile device are stored in a map cache SQLite database. This scenario is performed through the following steps: (a) Loading the vector base map and POIs layers, (b) Break the whole area into blocks, (c) Execute routing service to generate the optimum routes of the POIs within each territory, (d) Export interested area for the base map, the routes and POIs table of each block. Figure (6) summarizes the scenario of desktop utility.
Figure 6. Desktop Utility Scenario
Caching the base map into tiles is intensely speeding the performance of running maps at mobile devices. Herein, we render the area of interest (AOI) into tiles and store it in a SQLite database. These tiles are of square shape of 256* 256 pixels in Portable Network Graphics (PNG) format. The maximum zoom level of the AOI is rendered as single tile of level zero. Each tile at any consecutive zoom level is replaced by 4 equal-sized tiles. As the size of each new tile is still 256×256 pixels, the pixel size at the next level is four times smaller than the pixel size at the preceding level. The numbering of a tile at zoomed level is described by a pair of integers (x,y), where x is the column number of the tile, starting from the upper left corner, and y is the row number of the tile (Figure 7). This encoding is based on Quad tree spatial index structure, which optimizes the storage and indexing of tiles [17].
Figure 7. Caching Process
Cache data is divided into three types, base map in raster format, overlaid with annotation layer, and feature vector layers that contain the stored features in the map cache. SQL queries can be performed against the feature layer and get data tables back in return. The integration with SQLite provides added flexibility and improved usability for directly bind data tables to be controlled.
The mobile utility is a stand-alone application, which will run on the handheld to provide the below described functions. Figure (8) summarizes the scenario of mobile utility.
Figure 8. Mobile Utility Scenario
This application is divided into 3 main tiers; the hardware resources tier that includes display driver, GPS driver, flash memory driver, keypad driver, and power management, and the windows operating system to access the hardware tier through kernel and finally, the core libraries for application development to represent graphical objects and to transmit them to the output devices.
It acts as an interface between the programmer and hardware that facilitates the final rendering, and construct the K-dimensional "Kd" tree with all the POIs in form of (x,y) coordinates. When the user selects a point on the map, a nearest neighbour algorithm is executed on the constructed Kd tree. This algorithm is based on graph theory that aims to find the point in the tree which is nearest to a certain point.as follows (see Figure 9): (1) Starting with the root node, the algorithm moves down the tree recursively, in the same way that it would if the search point were being inserted (i.e. it goes right or left depending on whether the point is greater or less than the current node in the split dimension). (2) Once the algorithm reaches a leaf node, it saves that node point as the "best node". (3) The algorithm is rollback to the unvisited nodes and the recursion function is performing the following steps at each node: (a) If the current node is closer than the best node, then it becomes the best node. (b) The algorithm checks whether there could be any points that are closer to the search point than the best node. (3) When the algorithm finishes this process for the root node, then the search is complete. (4) To save computation, the algorithm uses squared distances technique. [18].
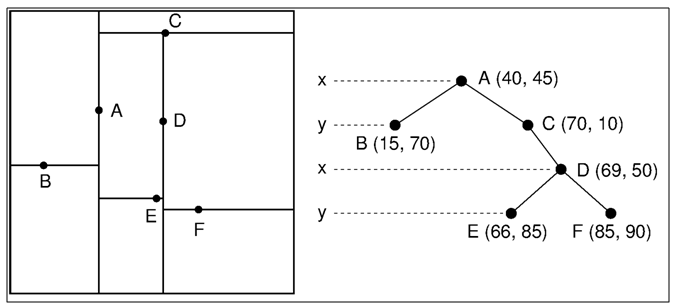
Figure 9. Kd Tree Algorithm
Figure (10) describes the diagram of the main tiers of the mobile application.
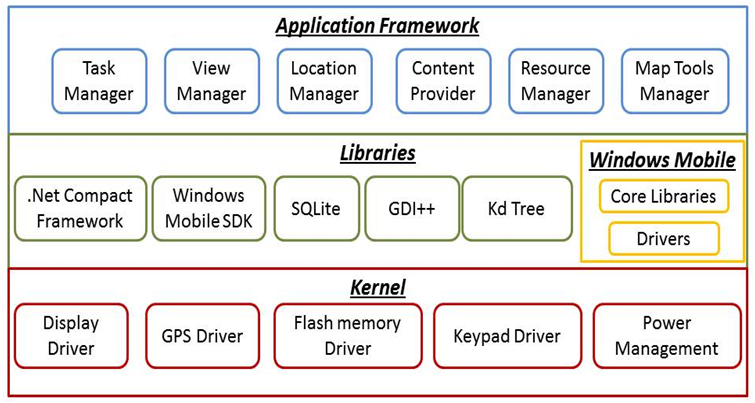
Figure 10. Conceptual view of the Mobile component architecture
The mobile application provides functions divided into 4 main modules as follows: Displaying spatial data through view manager module, which is characterized by being light, rich map, fast rendering, low storage, and windows independent. Also, the map includes the basic functionalities of zooming of (in, out, full extent), Pan, and POIs Identifier through the map tools manager module. The fetching of map tiles from the memory to a client is accelerated by using appropriate indexing and caching strategies, tile images is indexed appropriately using B+ tree and Quad tree to accelerate their access on demand.
Proper algorithms on top of index structures are used to support the access to adjacent tiles (after a pan operation) or tiles at different zoom levels (after a zoom in/out operation), where the core of loading tiles process is applied through three following steps, (a) Using the new centre and the new zoom level to translate the screen top left corner and the right bottom corner coordinates, (b) Loading all images from the SQLite database that has any corner of their 4 corners within the range of the translated coordinates, and (c) Placing the images on the screen according to their order and position. Interactive data display for showing the results of the searched POIs and load the related routes for the territory through content provider module. Among all these standard GIS functionalities, the application will be capable of integration with the GPS and locating the current position on the map using location manager module. Moreover, each POI on the map will be actively joined with the corresponding record in the database through the data entry GUI using the common id to edit/add POIs data. Figure (11) illustrate the flow chart of the main functions.
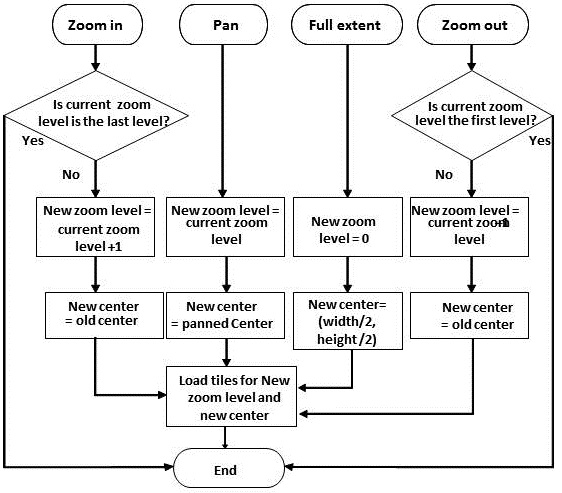
Figure 11. Flow chart of the main functions of the mobile application

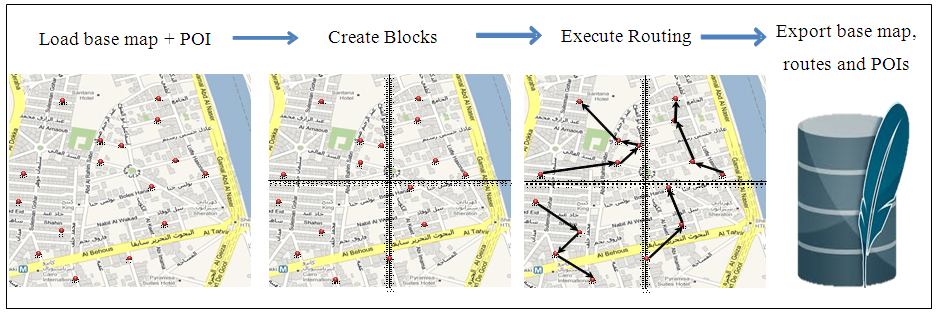
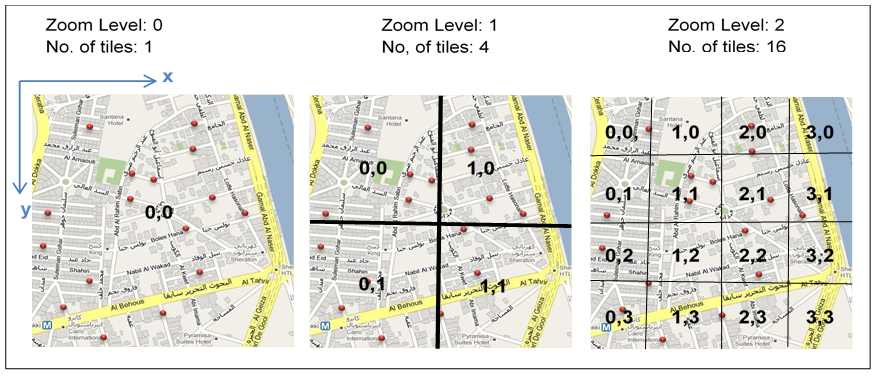
4. Results and Analysis

Map use is the core for map design consideration to achieve the visualization goal of the proposed framework. To ensure the research concept, two use cases are considered, searching for specific landmark and the predefined routing solution.
Spatial data was rendered into two parts, cached base map and vector graphics that linked to the related attributes.
For such purpose, the PDA was selected for testing the design possibilities and environment. The selected device is Intermec CN50 of 3.75G wireless mobile computer with standard 256MB RAM and 512MB Flash Memory allows the user to run multiple simultaneous applications [19].
As the small display screen of the PDA, the content and density of the information should be limited. Depending on that and on the purpose of the map, the accuracy of map is defined, thus the scale, information content, and size of display are all correlated. Also, a panning option is needed to get information as well as the integration of the GPS is attached to PDA where the location of the user is in the centre of the display.
At the scale of 1:10,000, are symbols overlapped so, on higher scale the map gets clumsy. At scale 1:5000, which covers an area of 450 m by 600 m on ground, it is showing sufficient information and density seems reasonable. All the symbols are legible and there is no overlapping even in congested areas, thus a scale of 1:5000 can be considered as the default for the purpose of map. On increasing the scale to 1:2500, the information increased with an area covering 300m x 400m, while, on selecting the scale 1:1000 the map shows area of 150 m by 200 m on the PDA. This would be small area to present the information. Figure 12 represents the visualization at different scale levels.
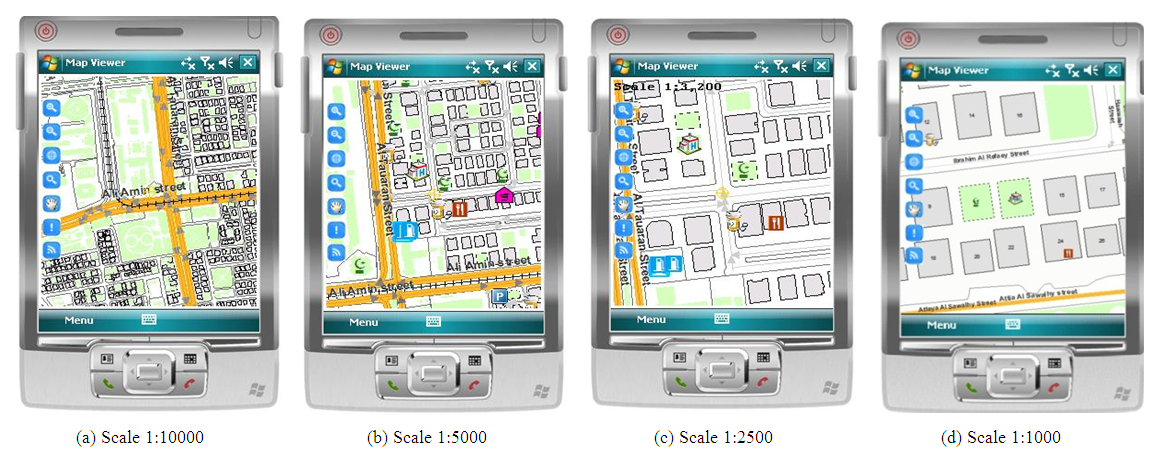
Figure 12. Visualization of Spatial data at different scale levels
To find the proper symbology for a map, we need to execute a cartographic data analysis. The core of this analysis process is to access the characteristics of the data in order to find out how they can be visualized. The selected data for the purpose of the map is of nominal type except roads layer, which is ordinal. The considered roads are of two types, major and minor. These have been shown by using the visual variable ‘size’. The nominal data has been shown with the help of variable shape (style). POI symbols should be based on the everyday signs in the street and other places to be familiar to users so they can recognize these symbols from the map on the handheld devices without much effort as shown in Table 1. The size of the symbols should be optimally selected with the help of the legibility principles and later on effectiveness of these are determined based on users testing. Symbol sizes are varying from 15 pixels to 25 pixels in the map [20].
Table 1. Point Symbols
     
Standard cartographic symbols , conventions, and colours are used, such as (blue colour for water, green for parks and open spaces, red for roads, light grey for landmark, and light grey for built up area, etc.).
Herein, roads are of ordinal data type and are shown by using visual variable size where the widths were chosen for representing minor and major roads respectively and varies between 0.25 mm (1 pixel) and 0.5 mm (2 pixel).
Considering the figure-ground organization principle, the built up area has been given light grey colour using basic 256-colour palette. This colour helps to figure out the points and other features thus increases the readability. Overall four to five colours are used in the map where the use of more colour will hamper the understanding of the map without legend. Bertin's six visual variables and the derived graphic variables transparency and blur focus are used in the map design [21].
Different kinds of visualization were created; in Figure 13(a) roads are shown with normal single line while roads are shown in double line thus giving the impression of individual blocks in between road segments as in Figure 13(b). However effectiveness of these different kinds of visualizations was assessed on the basis of user testing.
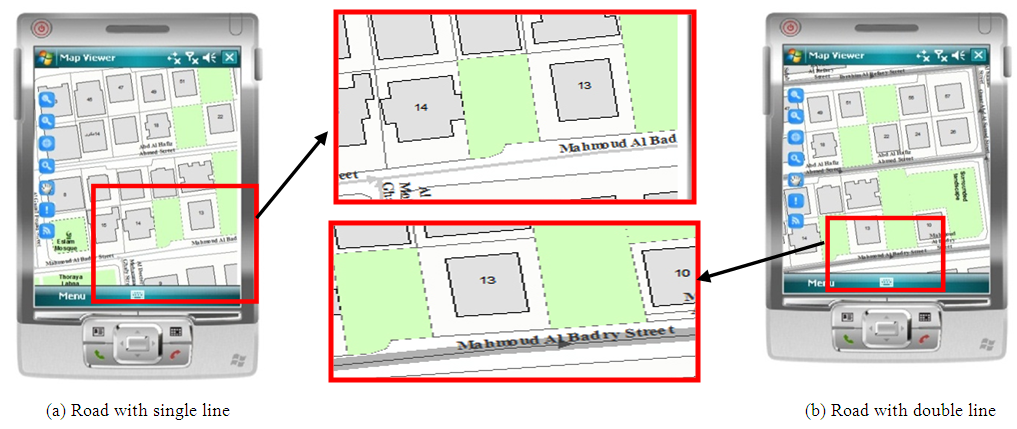
Figure 13. Different style of road visualization
Text is an important feature of a map, so fonts should be selected carefully. For the purpose of labelling in mobile maps, Arial font of San-serif family of the size 8 – 10 points of black colour is used. This is because serif type fonts tend to look messy when displayed on a monitor as shown in Figure 14.
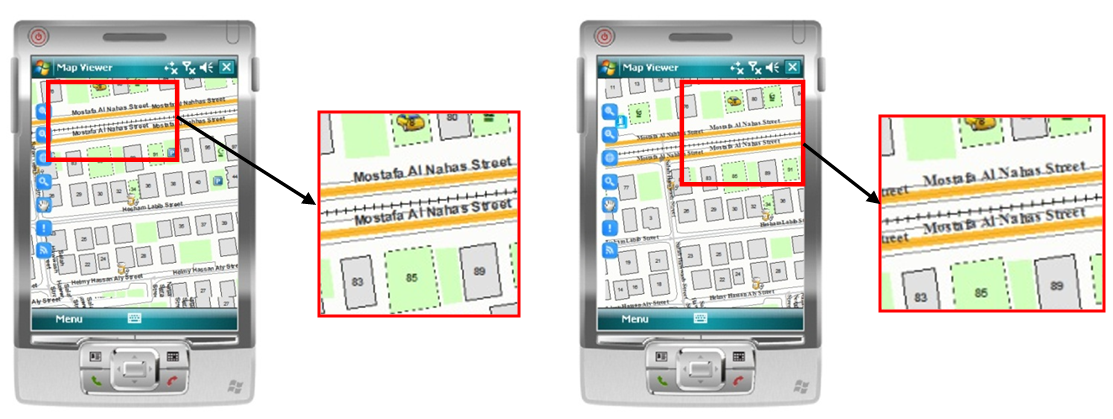
Figure 14. Map Labeling using different font families
It is observed that when we place the text in slanting position its readability decreases as compared to horizontal positioning. In horizontal position, where the text size of 8 points of font Arial is legible while it is recommended to use little higher one in case of slanting positions. The roads are generally sloping thus font size should be of little higher colours. Labelling cannot be done for each feature in such a small area, where it will make the map cluttered, so only major roads are named. The tool tip and identify option is used to reveal the description of other features and symbols as shown in Figure 15.
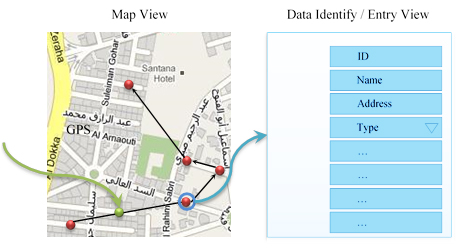
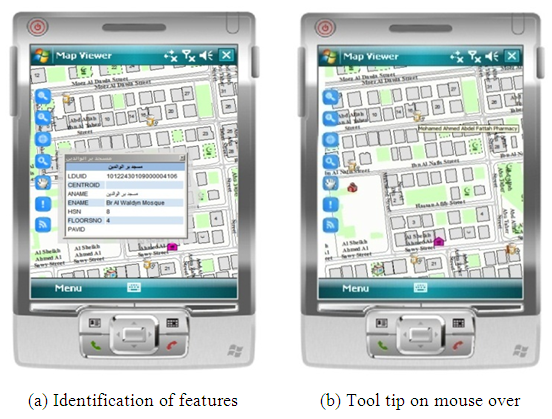
Figure 15. Attribute information exploration
At the first use case, where the user is looking for the closest ATM to his position that defined through the connected GPS, different visualizations are generated with the help of the query builder. The user’s position is shown with the asterisk symbol, see figure (16).
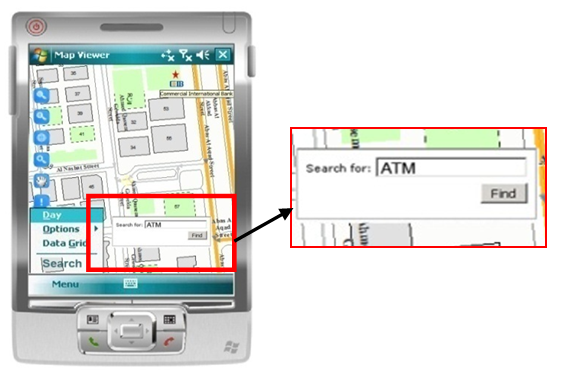
Figure 16. Searching for a landmark
The second use case is generating an interactive data display for a daily pre-defined route. The mobile devices will be used in outdoor environment so it is necessary to see whether the colours in the designed map are visible in the sunlight or not. It was tested in the sunlight for the colours, visibility etc. [22], during the user testing session it was observed that there is not much problem in the bright sunlight. Here the user is interested to view the map in Arabic language instead of English. This can be done when the user choose “Arabic Language”. See figure (17).
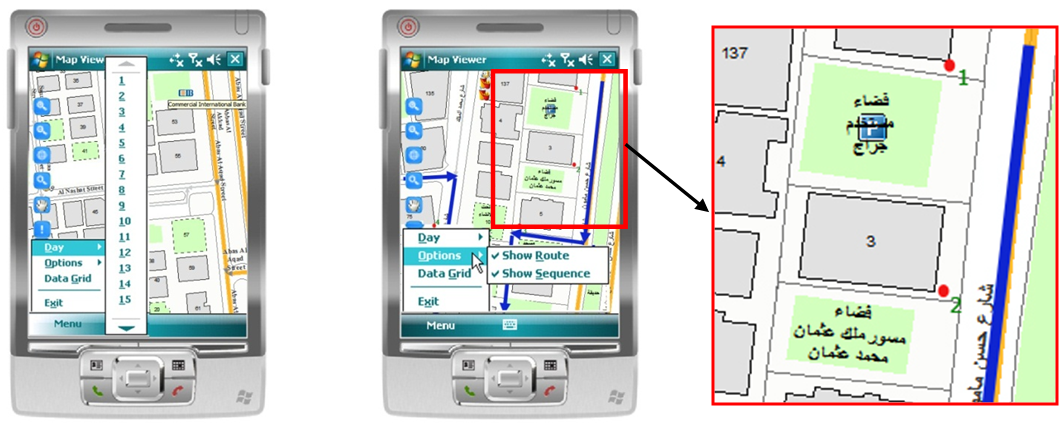
Figure 17. Predefined route generation

5. Conclusions

This research has tackled the development of the theories and technologies of dynamic cartographic visualization of spatial data and its interactive use on mobile devices. Based on the conceptual framework for Cybercartography that proposed in this paper, we succeeded to consider the challenges of the map design due to the limitation of mobile through the visualization domain and the technical limitations due to mobile device nature as display size, lack of processing power, low colour range, slow connectedness, limited storage, and less bandwidth.
Most of the mobile maps used raster maps, thus it is difficult to interact with them and require large space for storage and further quality is poor. In this framework the mobile map depends on the integration of the raster base map that is designed by carefully selecting the information content required at a particular scale for specific demand (Zooming and Panning), and vector approach, where it allows better queries and analysis.
The proposed mobile application has user friendly interface that follows the usability roles. It is a custom application that does not depend on a third party application and characterizes with offline capabilities.
A range of cartographic visualizations concepts were discussed based on the possibilities and limitations of map design in two use cases which are searching for specific landmark and generating predefined routing solution.
Spatial data was selected considering the two use cases, where the map is designed using the common map design principles and Bertin's visual variable that consider the limitations and possibilities of map design for mobile applications. This research emphasizes the possibility of applying adaptive geo-information visualization which overcomes the lack of flexibility inherent to other techniques. A flexible system can partially get over usability problems arising by using the system.
Future researches in mobile cartography are oriented to automate generalization process, integrate new technologies as nanotechnology, augmented reality with mobile cartography.

References

[1]  H. T. Wunderlich, h.. L. Meng, D. Dransch, and H. M. Sester (2004). Mobile Cartography – Adaptive Visualization of Geographic Information on Mobile Devices, Ph.D. thesis, Technical University of Munich, Faculty of Civil Engineering and Surveying.
[2]  D. R. Fraser Taylor (1997). Maps and Mapping in The Information Era, 18th International Cartographic Conference, ICC 97, Stockholm.
[3]  D. R. Fraser Taylor, Cybercartography (2004). Theory and Practice, Geomatics and Cartographic Research Centre (GCRC) and Distinguished Research Professor in International Affairs, Geography and Environmental Studies Carleton University, Ottawa, Ontario, Canada. ELSEVIER. Edited by/Edite par.
[4]  P. Longley, M. Goodchild, D. Maguire, and D. Rhind (2005). JGeographic Information Systems and Science, 2nd edition John Wiley & Sons, Ltd.
[5]  I. Ikodinovi, V. Milutinovi, Z. Dimitrijevi, A. C. Prete (1999). GPS-enabled Handheld Cartographic Display Systems: A Survey, Technical Report, [Online,] Available WWW: http://galeb.etf.bg.ac.yu/~igi.
[6]  M.-J. Kraak and F. Ormeling (2013). Cartography: Visualization of Geospatial Data, Routledge, Taylor & Francis Group, London and New York.
[7]  R. S. Nagi (2004). Cartographic visualization for mobile applications. Thesis at the International Institute for Geo-Information Science and Earth Observation, Enschede, The Netherlands.
[8]  D. Gotlib (2009). A concept of cartographic software for designing data visualization in mobile systems, International Cartographic Conference, Chile.
[9]  Ł. Halik (2012). The analysis of visual variables for use in the cartographic design of point symbols for mobile Augmented Reality applications, GEODESY AND CARTOGRAPHY, Vol. 61, No 1, pp. 19-30. DOI No 10.2478/v10277-012-0019-4, © Polish Academy of Sciences.
[10]  B. D. Dent (1999). Cartography: Thematic Map Design, William C Brown Pub.
[11]  B. A.. N. Emmer and J. V. D. WORN (2001). Cartographic Design and Production in the Internet Era: The Example of Tourist Web Maps, The Cartographic Journal, Vol. 38, No.1, pp. 61-72.
[12]  A.-M. Nivala and L. T. Sarjakosk (2005). Adapting Map Symbols for Mobile Users, Proc. of the International Cartographic Conference 2005: Mapping Approaches into a Changing World, Theme 12: Internet Location-Based Services, Mobile Mapping and Navigation Systems.
[13]  C. Molyneux and W. Cartwright (2012). Developing a conceptual design framework for multi-format map publishing, School of Mathematical and Geospatial Sciences, RMIT University, Melbourne, Victoria, Australia.
[14]  D. Schobesberger (2012). Towards a Framework for Improving the Usability of Web-mapping Products, Ph.D. Dissertation, Wien University.
[15]  J. E. Campbell, and M. Shin (2012). Geographic Information System Basics, Creative Commons by-nc-sa 3.0 license, freely downloadable.
[16]  Wu Zenghong, Chen Yufen (2009). Context awareness and modeling in self-adaptive geo-information visualization. In: 24th International Cartographic Conferences, Santiago (2009).
[17]  E. Stefanakis (2015). Map Tiles and Cached Map Services. GoGeomatics. Magazine of GoGeomatics Canada. December 2015.
[18]  M. Otair (2013). Approximate K-Nearest neighbor based spatial cluster using K-D tree., International Journal of Database Management Systems (IJDMS) Vol.5, No.1, February 2013 DOI: 10.5121/ijdms.2013.5108 97.
[19]  Intermec Technologies Corporation (2011). Mobile Computer – Intermec, product profile, Copyright © 2011 Intermec Technologies Corporation.
[20]  K. Wealands (2007). Cartographic user interface design models for mobile Location-Based Services applications, Ph.D. thesis, School of Mathematical and Geospatial Sciences Science, Engineering and Technology Portfolio, RMIT University.
[21]  K. Wealands (2007). School of Mathematical and Geospatial Sciences Science, Engineering and Technology Portfolio, RMIT University, August 2007.
[22]  C. K.-W. Su and L.-K. Chen (2008). Interface Design of Location-Based Services, Chapter In book: Advances in Human Computer Interaction, DOI: 10.5772/5917 • Source: InTech.