-
Paper Information
- Paper Submission
-
Journal Information
- About This Journal
- Editorial Board
- Current Issue
- Archive
- Author Guidelines
- Contact Us
American Journal of Geographic Information System
p-ISSN: 2163-1131 e-ISSN: 2163-114X
2016; 5(2): 55-67
doi:10.5923/j.ajgis.20160502.03

Erosion Sensitivity Assessment of Communities in Owerri, Nigeria Using Geographic Information System and Revised Universal Soil Loss Equation- Based Model
 Abstract
 Reference
 Full-Text PDF
 Full-text HTML
Ngozi AC-Chukwuocha, Ogbenna Uchechukwu, Ogugua Chizoba, Emenike Nnedinma
Department of Environmental Technology, Federal University of Technology, Owerri, Nigeria
Correspondence to: Ngozi AC-Chukwuocha, Department of Environmental Technology, Federal University of Technology, Owerri, Nigeria.
| Email: |  |
Copyright © 2016 Scientific & Academic Publishing. All Rights Reserved.
This work is licensed under the Creative Commons Attribution International License (CC BY).
http://creativecommons.org/licenses/by/4.0/

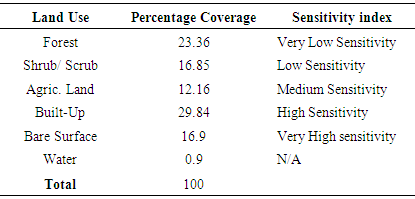
Soil erosion menace is a major environmental concern in South East Nigeria; that calls for quick measures to minimize the rate of devastation. These measures are sustainable if geospatial information on erosion sensitivity and degree of sensitivity is provided. This study identifies and integrates variables such as land use (derived from IKONOS 2012 Satellite Image), soil erodibity, rainfall erosivity, slope steepness (from Digital Terrain Model), level of imperviousness, drainage and population density to assess the degree of sensitivity in Owerri area of Nigeria to water erosion. The datasets were integrated into the GIS environment with the use of ArcGIS 10.3. The functions of weighted overlay were used to analyze the degrees of sensitivity of the entire study area to erosion hazards. The results showed that 57.56% of the study area mapped ranked medium sensitivity to erosion. With the built-up and forest land use accounting for 29.84% and 12.16%. Impervious surface analysis showed that 53.57% of the sub-watersheds had low level of imperviousness. While 46.43% of the study area had medium level of imperviousness (between 10%-25%). The study also revealed that Ohii with highest percentage sand (87.3%) and lowest percentage organic matter (0.635%) had the highest erodibility status. The study concludes that the degree of erosion sensitivity prevalent (medium) was observed in the low population density areas with substantive vegetative covers. While areas close to the city recorded very high sensitivity to erosion because of the high population density.
Keywords: Soil Erosion, RUSLE, GIS, Soil Erosion Sensitivity Assessment
Cite this paper: Ngozi AC-Chukwuocha, Ogbenna Uchechukwu, Ogugua Chizoba, Emenike Nnedinma, Erosion Sensitivity Assessment of Communities in Owerri, Nigeria Using Geographic Information System and Revised Universal Soil Loss Equation- Based Model, American Journal of Geographic Information System, Vol. 5 No. 2, 2016, pp. 55-67. doi: 10.5923/j.ajgis.20160502.03.
Article Outline
1. Introduction
- The spate of land degradation through soil erosion is of great concern in South east Nigeria. Soil erosion caused by water is triggered by a complex interaction process of many factors such as natural (climate, topography, soil, vegetation) and anthropogenic (tillage systems, soil conservation measures, overgrazing and deforestation [1]. Soil erosion occurring under natural conditions or geologic time scale is slow and has produced some of the most spectacular landscapes in the world. This continuously slow and constructive process can be significantly altered and aggravated by anthropogenic activities such as encroachment of agricultural activities on forest areas, deforestation for commercial and industrial purposes, urbanization and general misuse of land, as well as the effect of climatic changes such as high rainfall regime, drought, and desertification. This creates an imbalance in the natural equilibrium between soil loss and soil formation. The consequences of this imbalance are in many cases highly unfavorable to the human society. Erosion can be said to be a catalyst to several environmental problems such as decreased land productivity, challenges to agricultural sustainability, degradation of soil and water quality, and indirect pollution of the environment through the transport of contaminants such as agricultural and industrial waste attached to sediments to other parts of the environment and the hydrographic network [2, 3]. Some of these problems are presently witnessed in the South east region of Nigeria. The region of high population density with high rate of infrastructural development and the consequential flood and erosion hazards [4]. A report shows that about 45% of the region is affected by considerable sheet erosion and about 20% of the land area suffers severe sheet erosion [5]. The Soil Erosion Sensitivity Assessment provides a method of identification and prioritization of the potential risks posed by erosion to both the environment and the populace by identifying the areas or surfaces that are likely to be affected by erosion and the extent to which they are affected. This can be done by identifying various factors that determine the rate and intensity of erosion. These factors include; soil erodibility (dependent on inherent soil properties such as soil texture, structure and organic matter content), rainfall erosivity (dependent on rainfall amount, frequency and intensity), terrain (dependent on slope length and steepness), land cover (includes canopy cover, biomass and root system), socio-economic factors (include landuse, policies, population density, etc.). Various erosion focused studies have been carried out by researchers in the country [6-8] but most of these studies have largely been made through ground survey of the affected sites. Few studies [9], [8] and [10] have employed the power of the Revised Universal Soil Loss Equation in modeling erosion processes and mapping areas of high erosion risks in the South east of Nigeria. This study however focuses on a particular locality, and therefore integrates some measurable variables such as erodibility index assessed from soil samples, erosivity index determined from rainfall data, slope length and steepness derived from Digital Terrain Model, land cover management factor derived from classified landuse of Landsat 7 ETM satellite image. In addition other variables such as drainage density, impervious surfaces, were analysed. These variables were integrated with the RUSLE (Revised Universal Soil Loss Equation), in GIS (Geographic Information System) environment to determine the degree of sensitivity of the study area and to identify sub-areas of high sensitivity to erosion, so they could urgently be targeted for mitigation and remediation strategies, as well as serve as a tool for the development of best management plan.
2. Materials and Methods
2.1. Study Site
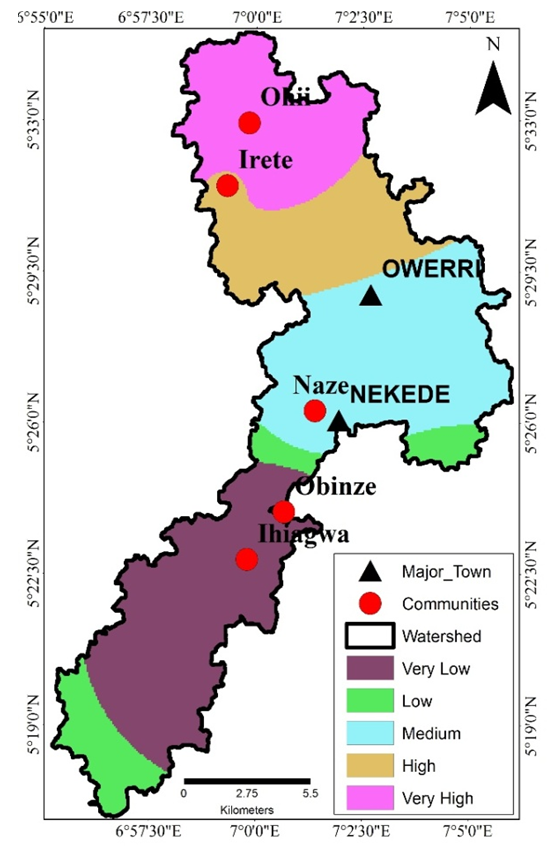
- The study area covers five (5) communities in Owerri West Local Government Area in Imo State, Nigeria. The communities are Ohii, Irete, Obinze, Naze and Ihiagwa. Two surface waterbodies flow through the study area, Otamiri and Nworie River. Owerri is a rapid growing urban centre consequent to its designation as the capital of Imo state in 1977, in South-Eastern Nigeria. The study area is located between longitude 6° 56’ 45’’E and 7° 5’ 0’’E, and latitude 5° 18’ 15’’N and 5° 34’ 45’’N shown in figure 1. The general topography of Owerri is fairly flat and its watershed is mostly covered by depleted rainforest vegetation, with mean temperatures of 27°C throughoutthe year and total annual rainfall exceeding 2500mm [11]. The Otamiri River is joined by the Nworie River at Nekede in Owerri, a river about 9.2 km in length. The climate of Imo State is typically humid and its vegetation is tropical rain forest. Owerri has its max temperature as 33.4°C and min temperature as 21.2°C, its highest and lowest rainfall was recorded as 19 and 2mm respectively for 2012.
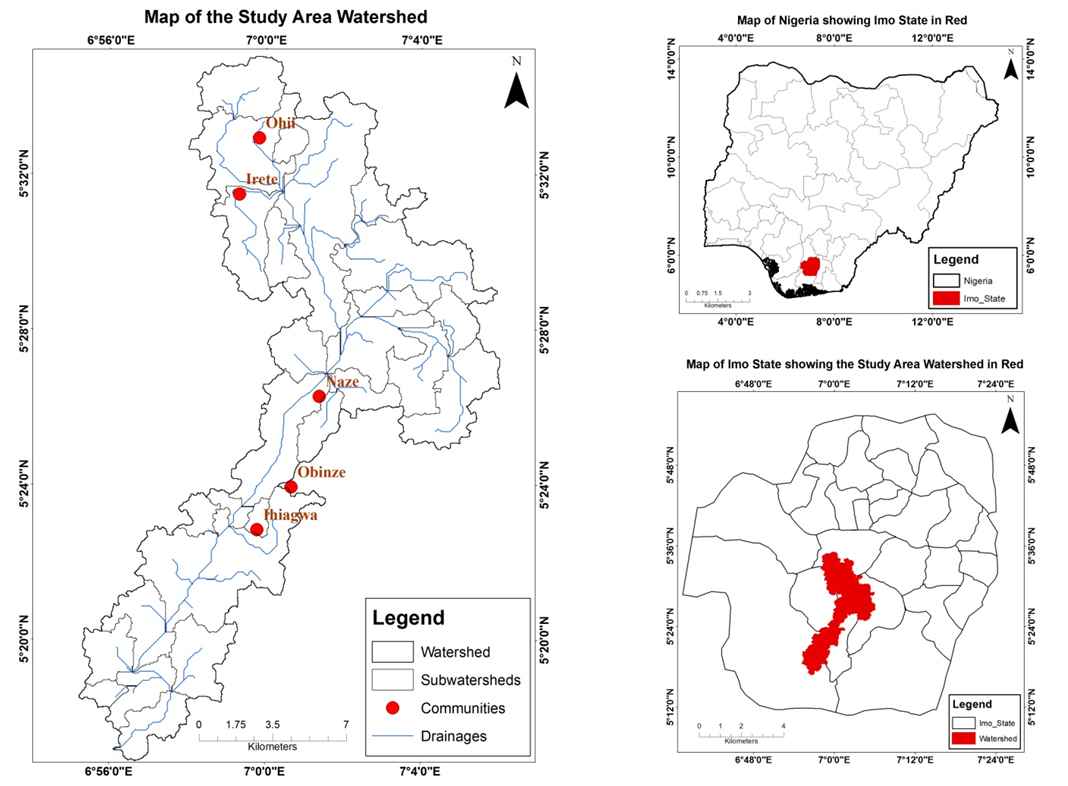 | Figure 1. Location Map of Study Site |
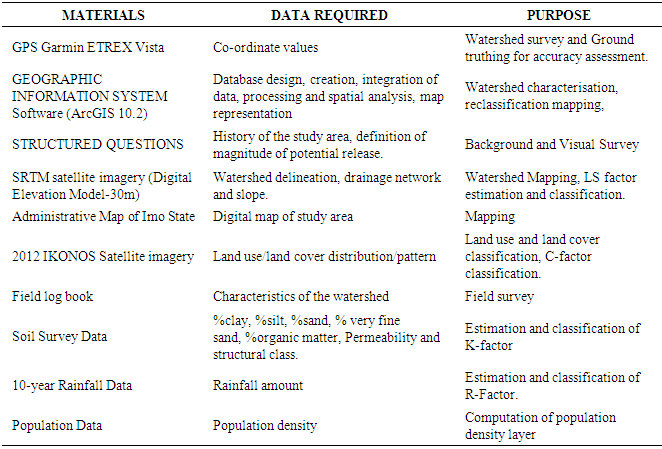
2.2. Materials
2.3. Methods
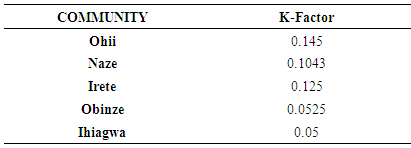
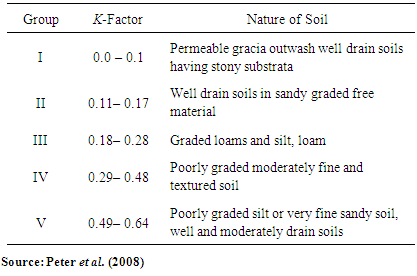
- The integration of RUSLE equation into the GIS environment led to the following standardised methods which were used to produce each of the factors as grid layers. Ÿ Geo-Database Design - A Personal Geo-Database was created in the ArcCatalog environment to store and manage the two different geographic data models (Vector and Raster) as well as their attributes, coordinate systems and projection properties.Ÿ Coordinate System - All coordinates were in Mercator projection; the Geographic Coordinate System (GCS_WGS_1984) and Datum (D_WGS_1984) were applied in the project. Ÿ Watershed Delineation Process - HEC-GeoHMS extension in the ArcMap 10.2 platform was utilized in this process. In this step, a terrain model is used as an input to derive seven additional datasets that collectively describe the drainage pattern of the watershed and allows for stream and sub-basin delineation. The first five datasets were grid layers that represent the flow direction, flow accumulation, stream network, stream segmentation, and watershed delineation. The next two datasets are vector layers of the watersheds and streams.The values for the RUSLE factors to be inputted into the GIS software include the following:Rainfall-Erosivity: R-FactorThe rainfall erosivity factor is used to quantify the ability of rainfall to cause soil loss under different conditions. It represents the erosion potential caused by rainfall [13]. The R-factor for a particular locality is the average annual total of the storm EI30 values for that locality [13]. EI30 is the individual stormindex values which equals to E which is the total kinetic energy of a storm multiplied by I30 which is the maximum rainfall intensity in 30 minutes [14]. Due to lack of data on rainfall intensity, the R-factor was computed using an equation developed by [15] as seen below:R= 38.5 + 0.35PrWhere Pr is the mean annual rainfall in mmThe mean annual rainfall was estimated from monthly mean precipitation datasets compiled from precipitation records from the year 2004-2013 (10 years) obtained from NIMETS, Owerri Airport Station (Latitude 5° 29’N Longitude 7° 13’E).Soil Erodibility: K-FactorThe soil erodibility factor is an empirically derived index that indicates susceptibility of soil to rainfall and runoff detachment and transport (rates of runoff) based on soil texture, grain size, permeability and organic matter content. It thus reflects the ease with which the soil is detached by splash during rainfall and/or by surface flow [10]. It denotes the average soil loss per ton per acre per unit area for a particular type of soil under standard unit plot condition (cultivated, continuous fallow with slope length of 22.13m and percentage slope steepness of 9%) [16].The K-factor was computed using the soil-erodibility nomograph using measurable properties developed by [17]. The soil erodibility nomograph comprises five soil profile parameters which include; percent of silt + very fine sand (0.002-0.1mm), percent of sand (0.1-2mm), percent of organic matter (OM), class for soil structure (s) and permeability (p).A detailed explanation of the parameters used for K value calculations is as follows:Percentage Silt (0.002-0.05mm), Very Fine Sand (0.05-0.1mm) and Sand (0.1-2mm)A mechanical analysis of the particle size distribution using the hydrometer sedimentation test method was carried out to determine the percentage silt, very fine sand, sand and clay (>0.002mm).Percentage Organic MatterPercentage Organic Matter was derived using the equation below;Percentage Organic matter = 1.724 * Percentage Organic CarbonOrganic Carbon was obtained using the Dichromate Oxidation Method [18].Soil Structure ClassThe classificationof structure involves consideration of the shape and arrangement, the size and the distinctness of the visible aggregates or pebbles. The grade of soil structure is dependent upon soil moisture content and varies seasonally.Permeability ClassPermeability is a measure of the soils ability to transmit a fluid, usually water. Permeability value in cm/sec was determined using Allan Hazens equation. Permeability=D10*100cm/sec.Where D10 is the diameter corresponding to 10% of percentage passing. It is called the effective size.The above parameters were inputted into the erodibility nomograph (Figure 2) to obtain the K-factor for the soil in the various communities. The values of the K-factors obtained were inputted into the attribute tables of the communities associated with the study area. An inverse distance weighting interpolation was carried out in the ArcGIS environment to obtain the K-Factor surface for the study area. The result after the interpolation process was reclassified on a scale of 1-5 to reflect its sensitivity to erosion.
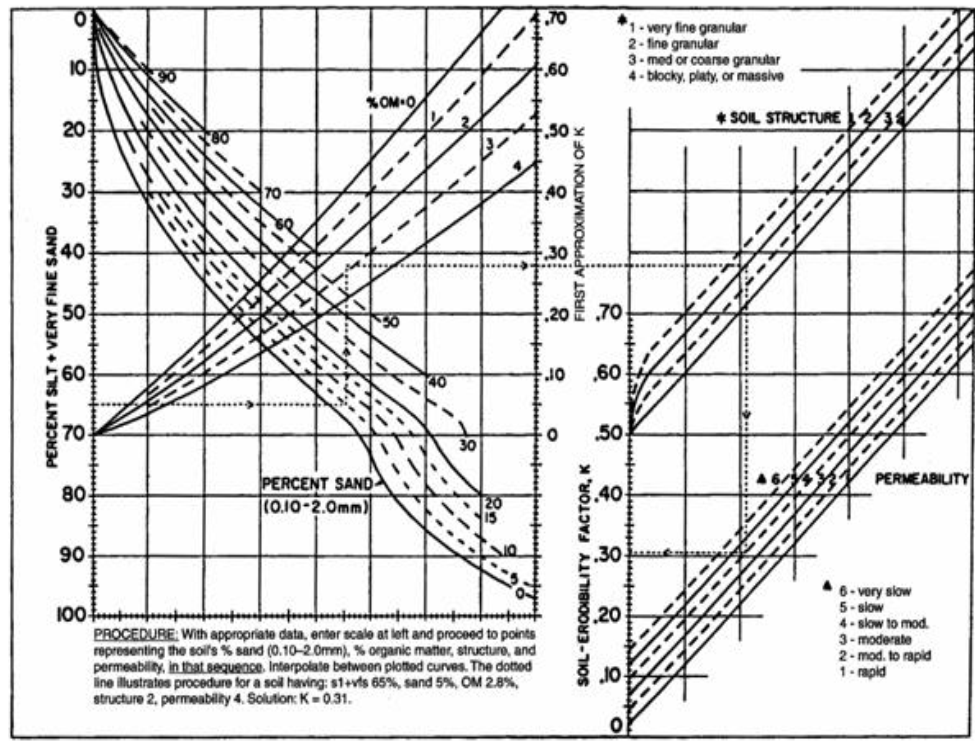 | Figure 2. Soil erodibility nomograph by Wishmeieret al., 1971 |
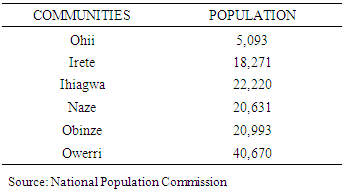
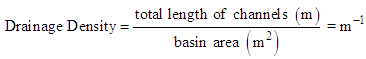 The drainage density of each subwatershed was analysed in the GIS environment and converted to a raster format and then reclassified based on the existing reclassification categories to establish a thematic layer which was to be integrated later to obtain a final sensitivity map.Population Density LayerThe population data was obtained from the Ministry of Planning and Economic Development, Imo State Secretariat Complex, Owerri; then an inverse distance weighting interpolation was carried out on the data to obtain a surface. The layer was then reclassified to reflect their influence based on erosion.
|
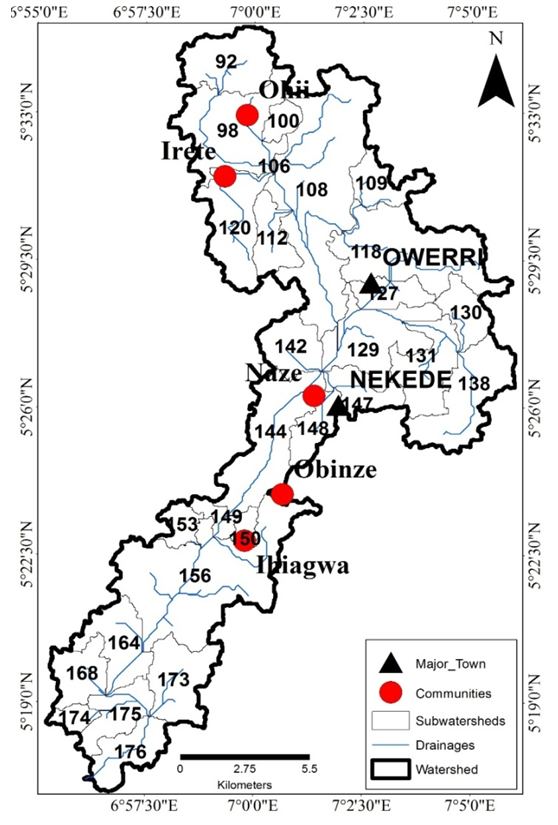 | Figure 3. Map of study area sub watershed showing stream networks |
3. Analysis and Results
- Watershed Delineation and CharacteristicsThe watershed land area covers a total of about 229.692km2 of Owerri West LGA with twenty eight (28) sub watersheds and their drainage networks. The total drainage networks in the watershed ranged from 0.102km to 23.585km length. Figure 3 shows the sub watershed and its drainage networks in the watershed as already described.Particle Size DistributionThe particle sizes range from clay (>0.002mm) to silt (0.002-0.05mm) to very fine sand (0.05-0.1mm) to sand (0.1-2mm). Results from the particle size analysis indicate that soil samples generally had a high percent of sand (72% - 94.5%) and fell under the USDA textural classification of sand and loamy sand. This signifies the lack of the ability to aggregate together therefore little force is required to detach and transport the soil particles, but because most sandy soils are highly permeable thereby generating low surface runoff, erosion is often light. This suggests that although the soil particles in these areas are easily detached, they are not easily transported due to low runoff and large particle size therefore the overall erodibility is low. Percentage Organic MatterSoils with higher organic content form more soil aggregates and hence is less erodible than soils with lower organic matter content. [22] suggested that soil erodibility decreases linearly with increasing organic content over the range of 0 to 10%, therefore Ohii with the least percentage organic matter (0.72 and 0.56) are more susceptible to erosion and Ihiagwa with 2.18 percent had the highest organic matter content therefore is most resistant to aggregate breakdown.Soil Structure ClassificationWell-developed soil structure promotes a network of cracks and large pores that accommodate infiltrating water, resulting in reduced erosion due to decreased runoff. Good aggregation also holds particles together, enabling the soil to resist the detachment forces of water and raindrop impact [21]. The soils were majorly sub-angular soils and from their texture, fell under fine granular soils which form relatively unstable cods. This makes them easily erodible.Permeability ClassificationPermeability is a measure of the rate at which water percolates through a soil. Highly permeable soil encourages infiltration and generates low runoff. In the study area, Ohii had the least permeable soil making them more susceptible to erosion as they produce more runoff.Generation and Reclassification of Thematic Layers as Regards to Erosion Sensitivity.Rainfall-Runoff Erosivity (R-Factor) LayerDue to the nature of data collected from NIMET, there was no spatial variability in the R-Factor layer as shown in Figure 4 below.
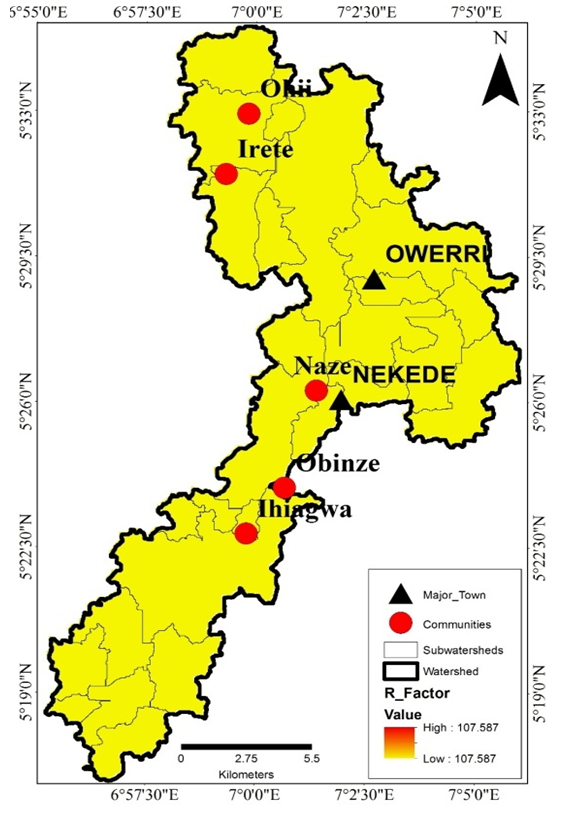 | Figure 4. Map Showing Study Area Rainfall Erosivity |
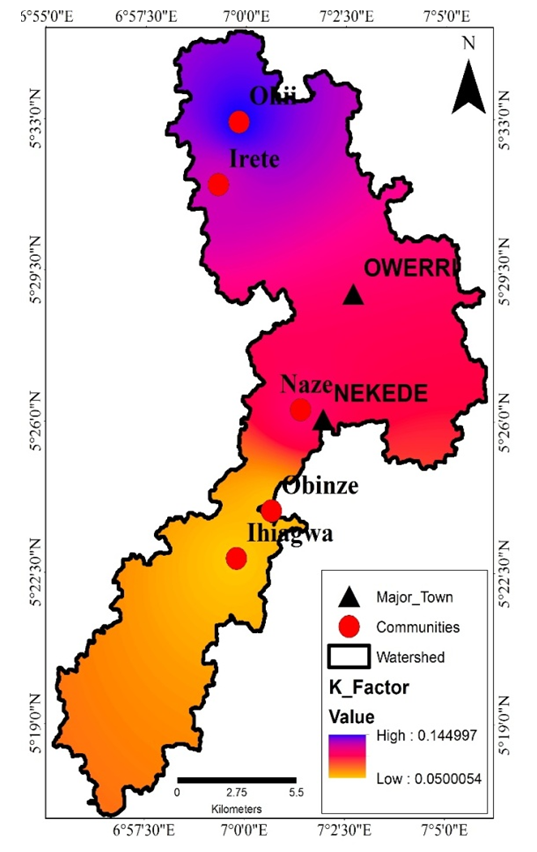 | Figure 5. Map showing the Spatial Distribution |
 | Figure 6. Map showing the reclassified Spatial Distribution |
|
|
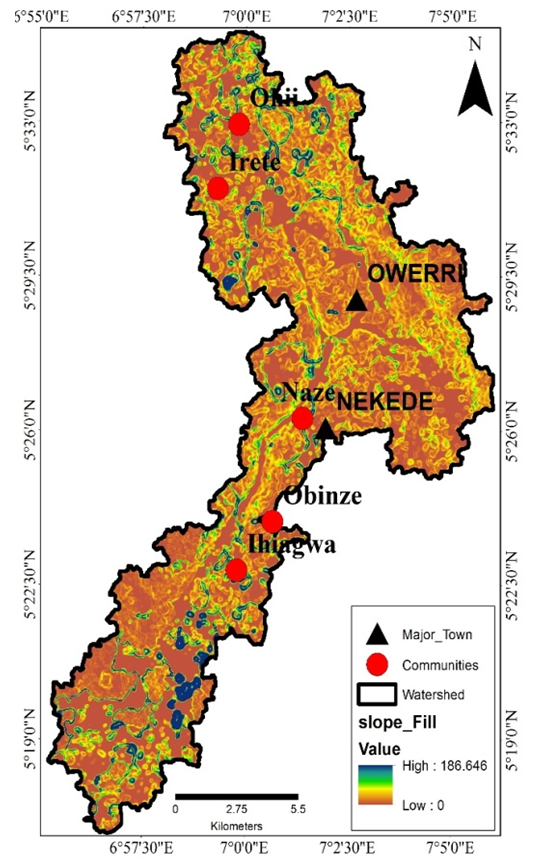 | Figure 7. Map showing the LS-Factor of the Study Area Watershed |
 | Figure 8. Map showing the Reclassified LS-Factor of the Study Area Watershed |
|
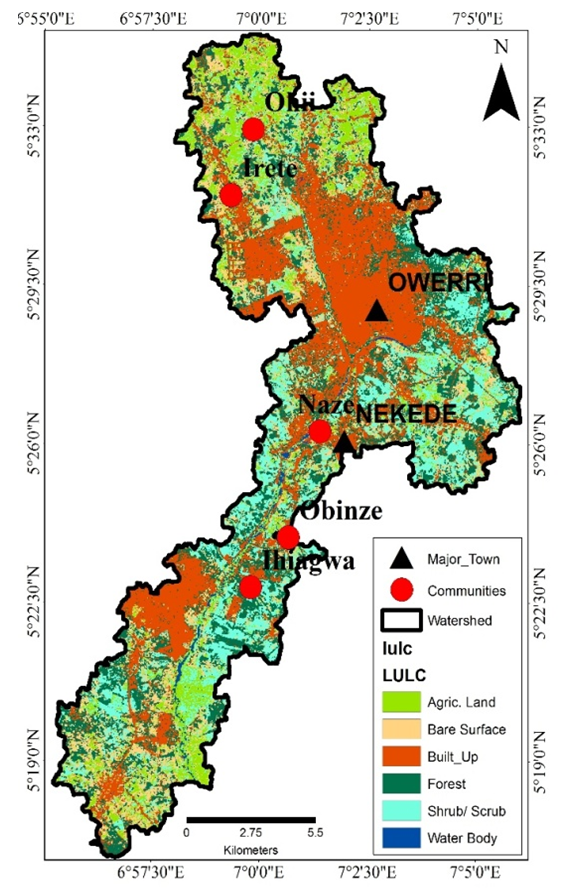 | Figure 9. Map of study area sub watershed showing land use distribution |
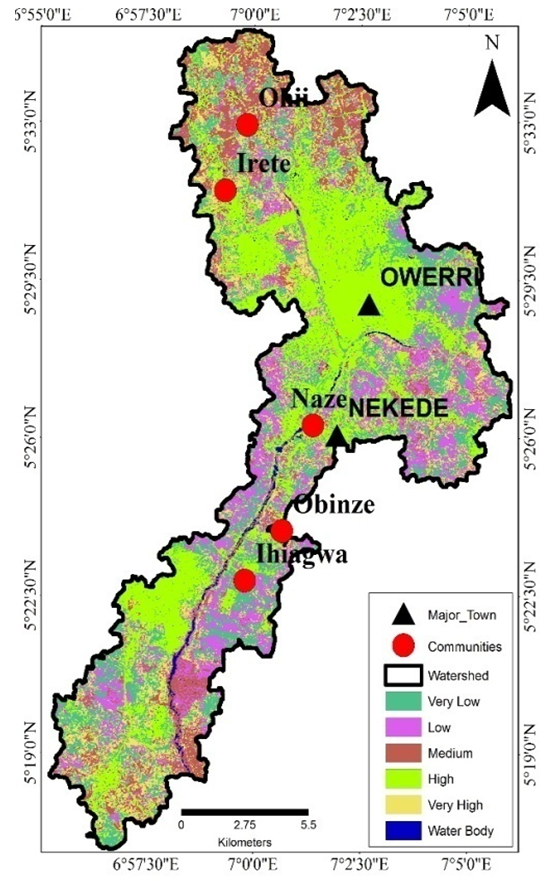 | Figure 10. Map of study area showing C_Factor (Reclassified Land use/ Land cover) |
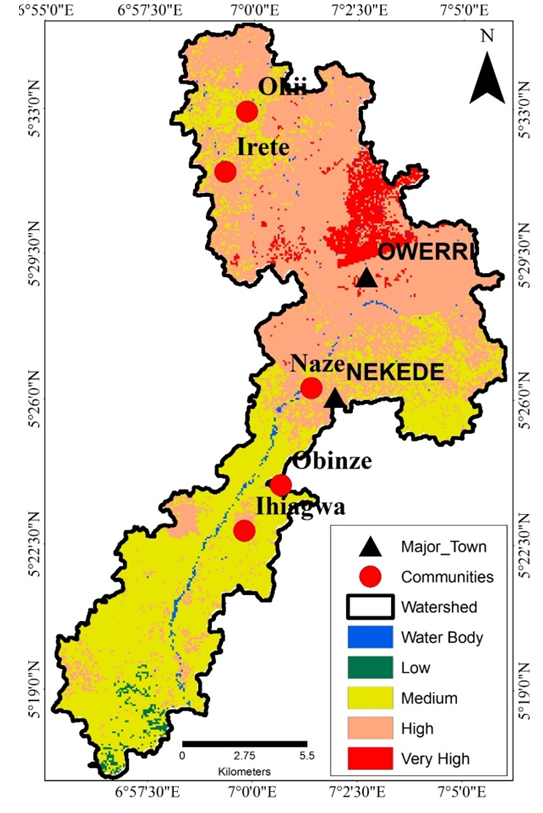
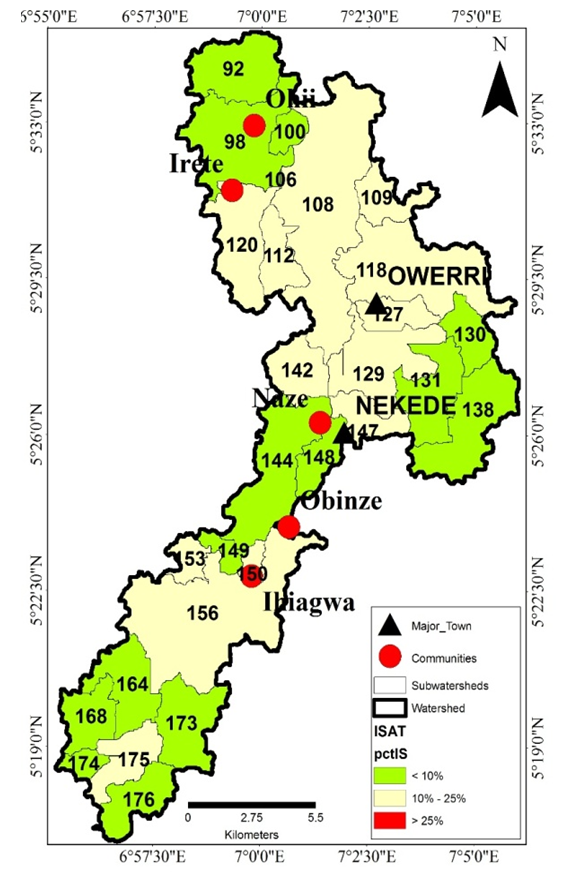 | Figure 11. Map Showing Study Area Imperviousness |
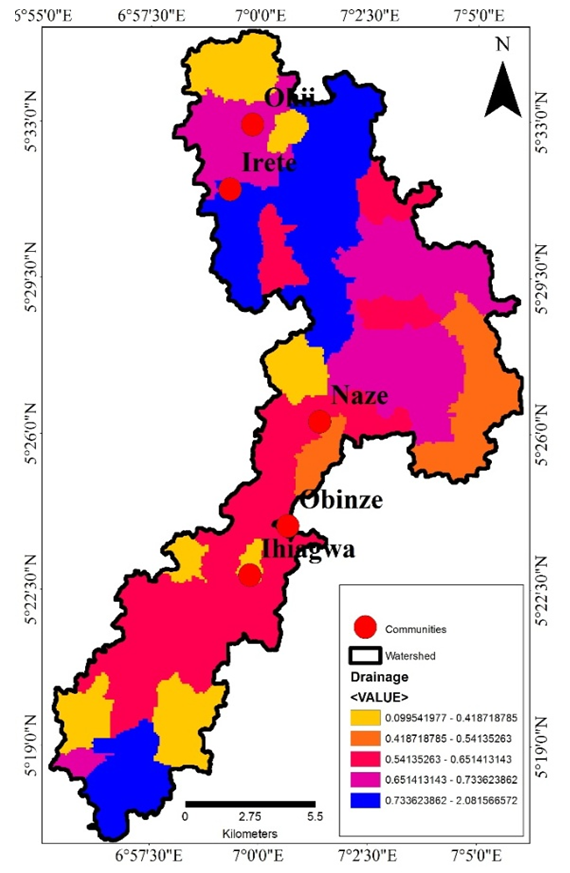 | Figure 12. Result of the Study Area Drainage Density |
 | Figure 13. Result of Reclassified Drainage Density |
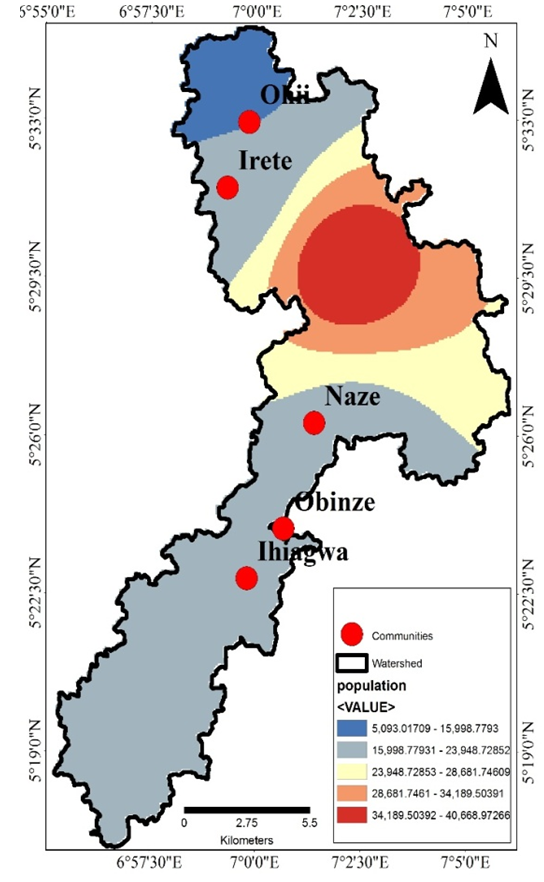 | Figure 14. Map Showing the Spatial distribution of population |
 | Figure 15. Map Showing the Reclassified Spatial distribution of population |
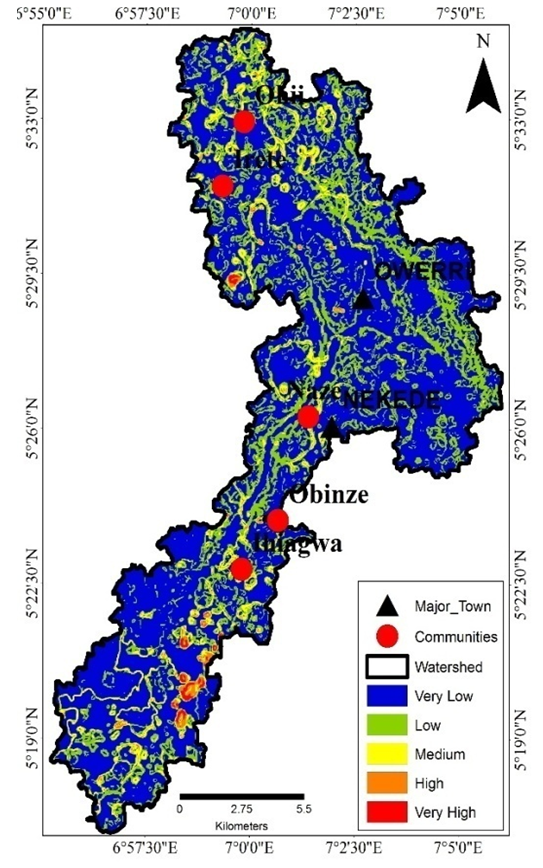
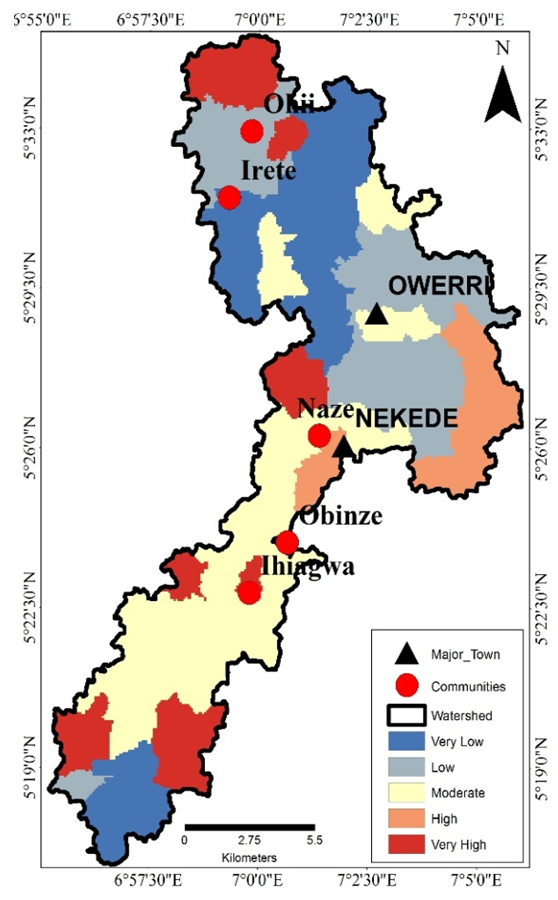
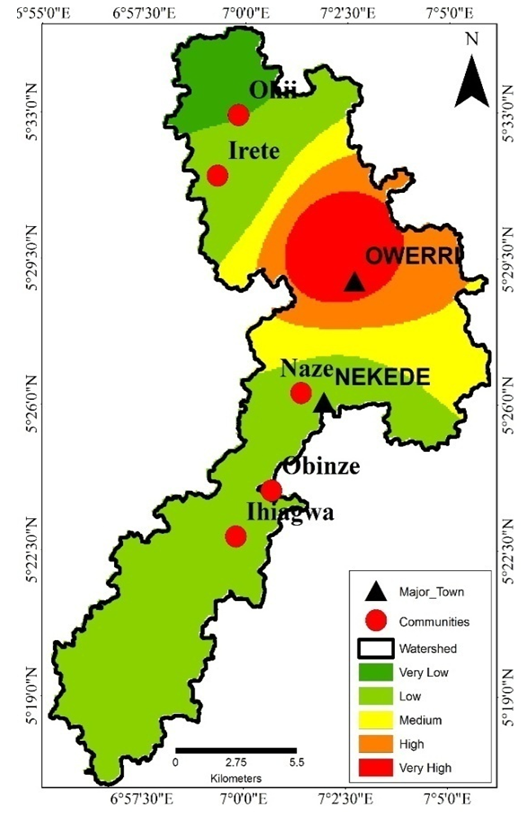
 | Figure 16. Map Showing the Sensitivity of the Study Area to Erosion |
4. Conclusions
- This study has shown that integrating RUSLE prediction model and other environmental components such as drainage density, level of imperviousness and population data were integrated into the GIS platform, thereby making it possible and easier to study each environmental component independent of others. The watershed approach was applied in the study to enable the study area to be broken up into different environmental components and therefore studied independently. This model can be extrapolated to a larger watershed land area if the functional capacities of GIS are used, because they allow model integration of additional basic and factorial data. At the same time, the thematic and derived maps for each factor layer can be updated and evaluated to assure precision before executing the model and obtaining the final map of sensitivity to erosion.