-
Paper Information
- Paper Submission
-
Journal Information
- About This Journal
- Editorial Board
- Current Issue
- Archive
- Author Guidelines
- Contact Us
American Journal of Geographic Information System
p-ISSN: 2163-1131 e-ISSN: 2163-114X
2016; 5(2): 40-54
doi:10.5923/j.ajgis.20160502.02

Benefits for the Population of Assiut City of an Efficient and Sustainable Transport Network: A Study Using Graph Theory and GI
 Abstract
 Reference
 Full-Text PDF
 Full-text HTML
Yasser Abdelazim Abdelmawgoud Samak
Faculty of Arts, Department of Geography and GIS, Assiut University, Old University Building, Assiut, Egypt
Correspondence to: Yasser Abdelazim Abdelmawgoud Samak , Faculty of Arts, Department of Geography and GIS, Assiut University, Old University Building, Assiut, Egypt.
| Email: |  |
Copyright © 2016 Scientific & Academic Publishing. All Rights Reserved.
This work is licensed under the Creative Commons Attribution International License (CC BY).
http://creativecommons.org/licenses/by/4.0/

This study provides an analysis of accessibility and spatial interactions within Assiut City, Egypt, in order to develop a strategic plan for an efficient and sustainable transportation network. Graph theory, GIS and remote sensing techniques have been used to derive in-depth information about the existing and probable spatial network of transportation. Several indices were checked for compatibility with a possible future strategic plan on the basis of the findings of the study. Calculations show possible transport routes during disaster management and the degree of connectivity of the streets in the city, as well as details of ideal accessibility, spatial interactions and real-time variances. It is concluded that to ensure a sustainable strategic plan for a transportation network in Assiut City, it is important to analyze the data presented in matrices and to use the collation of this data for effective decision making.
Keywords: Transportation network, Transport planning, Strategic planning, GIS, Assiut City, Egypt
Cite this paper: Yasser Abdelazim Abdelmawgoud Samak , Benefits for the Population of Assiut City of an Efficient and Sustainable Transport Network: A Study Using Graph Theory and GI, American Journal of Geographic Information System, Vol. 5 No. 2, 2016, pp. 40-54. doi: 10.5923/j.ajgis.20160502.02.
Article Outline
1. Introduction
- Quality of life and the economy of a nation are highly dependent on the efficiency and characteristics of the transport system of a place, hence strategic planning is essential. A properly operating transport network can ensure access to sources of raw materials, and the smooth collection and distribution of agricultural and industrial products. The administration of a city would also be able to run more smoothly, owing to greater mobility [1].A strategic plan developed for efficient transportation needs to ensure that different forms of mobility seamlessly co-exist in the transportation networks, that there is high accessibility to the nearest transport networks and nodes, and that daily commuting for work becomes less problematic. In most countries, strategic transportation planning has been done through the use of mathematical tools like GIS (geographic information systems) and graph theory, and techniques like remote sensing. Surveys, questionnaires and workshops have helped many countries predict the usability of different modes of transport on their roads. Keeping topologies, local community identities and business areas in mind helps ensure the effective use of tools in strategic planning. Cities like Surrey and Dhaka reflect the most common transportation requirements of all countries, as also seen in separate studies in the Caribbean [2], Iran [1], the Netherlands [3], China [4] and Bangladesh [5] wherein the most important part of the investment in setting up an efficient transportation network goes into road transport. Transit agencies have found better employee coherence in delivery of transport services, owing to well defined strategic planning taken up at the agency level, thus showing that strategic planning need not be a government initiative alone [6]. Building a balanced framework involving vehicle mobility and walkways further improves the situation, since most people do not mind commuting a short distance by walking on a daily basis [7], and this reduces investment and betters the quality of life of local people [8]. Walkways also allow the use of bicycles, roller skates, hover-boards, wheelchairs [9], electric scooters and traditional forms of transportation like carts and rickshaws. Integrating all forms of mobility increases transport efficiency for business, health, and recreational purposes [10]. A major issue in setting up a new strategic plan is the identification of key indicators and the setting up of realistic goals. Local community surveys work best in helping with the assessment of what is lacking and what is needed immediately [3, 10]. Special focus is needed on areas inhabited by lower income groups, since access to public transport is crucial for such residents [2]. Steps to avoid deregulation of services will help create sustainable transport fares and uniform flow of traffic year round. 293 different causes for delay in road construction have been identified in Egypt alone [11]). It is noted also that efficient transportation networks are highly important for post-disaster management [12].Once the different challenges of strategic planning are recognized, one needs to arrive at the mathematical tools that will help develop a convincing plan. Monographs help best in assessing linear and non-linear programming, non-smooth and non-convex optimization of strategies, graph theory, integer programming, real-time synchronization, fuzzy sets and fuzzy goals, stochastic programming, differential and functional equations, and multi-criteria and multi-modal optimization through various usable indices, simulation modelling and so on [13]. Real-time transfer synchronization has been used to study the efficiency of transit schedules and has helped researchers optimize existing network and schedules through simulation and analysis of spatial and modal alignments [9, 14]. In our current study, we use graph theories and geographic information systems to develop a strategic plan that is then analyzed for variance between ideal and real-time mobility records. We use methodology inspired by the GIS-based physical deprivation index developed by the Cairo Governorate [15]. The efficiency of the study and its analytical results shows us that GIS is an effective tool in deciphering uncharted zones. Developing a strategic transportation plan in Assiut will be easy, as the GIS helps us find new topographies not previously considered in the construction of roadways for connecting remote areas of the city. The graph method has also been used to evaluate the risk factors involved in public transport in the Netherlands and uses link criticality over link importance to predict disruptions in the public transport system in case of an emergency, and suggests new modes to overcome these disruptions. The empirical study also suggests reducing per transport loads to minimize disruptions, since heavily loaded public transportation areas experience maximum disruptions [16]. Road network analysis on the basis of GIS is an efficient approach to support data derived through real-time synchronizing that aids in future decision making [17]. Our study is centered on the city of Assiut in Egypt, a major hub of business and education, situated about 400 km south of Cairo. This ancient city is today the administrative center of the province of Upper Egypt and is also an important agricultural center. With the third largest university in Egypt situated in its heart, Assiut has been a witness to the growing literacy in Egypt and is an important educational center for the country. In 2007, it boasted a 2,763 square foot area of land used for residential, commercial and public service facilities. The proposed simulation models seek to contribute to the development of the transportation network and improve the functionality of the region.
2. Methodology
2.1. Graph Theory
- Analysis of the spatial distribution of a city’s systematic data sets on topography and population allows a first-hand approximation of the degree of relationship between the settlements of a region. Generally, settlements do not have a regular distribution in space, resulting in differences in the possibilities of interaction between their populations. The differences in accessibility can also result from poor public services and zero awareness of existing services and routes. Centrality measures allow a glimpse of the most representative locations within a system. If a settlement system with regular distribution within a region has its density localized in the center, then the center half should match the focal point of the region [20]. However, the actual location hardly matches with the empirically derived centrality measured in this manner, since within a single system of a city there are many areas where multiple settlements are concentrated, causing the displacement of the medium center to those areas which are originally overlapped sets of data, and thus do not provide a clear picture of actual location or information.
2.2. Dimensional Analysis of Transport Networks
- In every territory, there are different linear spatial entities, some natural and others anthropogenic. This corresponds to what Boots and Haggett [18] consider to be the basis of networks and movements. These entities could be classified into:• Isolated seamless lines between spatial entities • Trees: line segments that have intersections as hierarchical branches that do not form cycles and loops, for example, a hydrographic network • Circuits or networks where lines form closed loops together, for example, the streets of a city.The notion of a network is based on the concepts of diversity and territorial heterogeneity in relation to the distribution of the points of production, consumption and services, therefore temporal and spatial discontinuity, and the need to eliminate them through systematic exchange. The connection between sources of generation and attraction flow is by means of transportation and communication. Balanced, connected and developed networks allow exchanges on various scales, while disjointed, unbalanced and dysfunctional networks polarize the territories and contribute to increasing inequalities [19]).
2.3. Topological Connectivity Measures
- Index (I) Medium Density: The index calculation average density of a network is obtained through the ratio between the length and the surface of the network. Usually, to find out how developed a transport network is, it is immediately associated with the number of kilometers of transport roadways or networks. The greater the number of kilometers, the more development has been achieved in the area.
 where I(s) is the average density, depending on the area of the network, L the length of the network and S the surface of the study area.The result of this ratio is a first approximation, and that is why we have proposed additional calculations more tailored to regional realities values.Index (II) Medium Density: This second index calculation average density of a network allows for a tighter result of the average density of the network. For this index, population should be considered, since this is related directly to the demand for transport. The index value is calculated from the ratio of the network length and the population size.
 where I(p) is the average density of the network based on the population, L the length of the network and P the population.
2.4. Accessibility Measures
- Accessibility measures provide precise quantitative values of the position of each location in space relative to the total locations that generate interactions in the study area. Ideal accessibility of each locality (AIi) is calculated from the sum of the linear distance between locations. Euclidean distances were calculated using ArcGIS proximity point distance tool.
 where AIi is the ideal for the settlement, diij is accessibility and i is the distance from i with respect to each of the other locations, and j is the study area.Ideal regional accessibility (AIr) is derived from the above calculation, being the sum of all results.
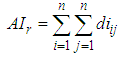 Quality Index of Communication of each locality (ICCi): To calculate this index, one should compare the ideal distances with the real distances.
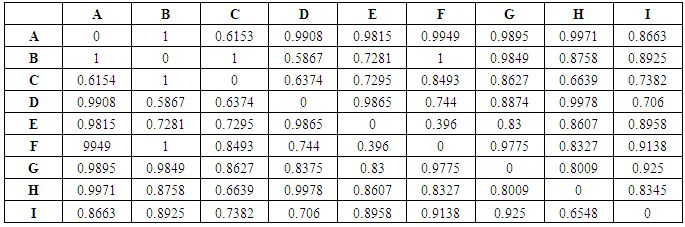
 where ICCi is the Quality Index of Communication of each locality i, AIi is the Ideal Accessibility and ARi is the Real Accessibility Index Quality in Regional Communication (ICCr): This is obtained from the regional results.
 Path Index of each locality (ITi): To calculate this ratio, ideal distances should be compared with the actual distances. This indicates whether all links between locations are ideal and the percentage of extra length to be covered in the study area to navigate from one location to the other.
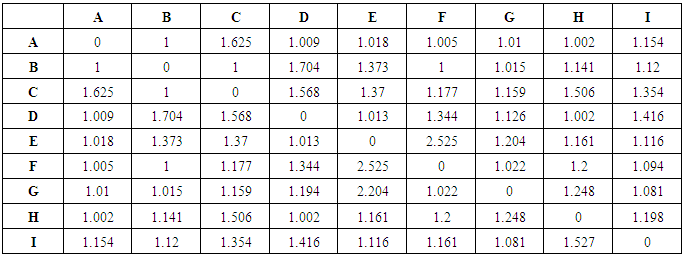
 where ITi is the Quality Index of Communication for each locality i, ARi is the Real Accessibility and AIi is the Ideal Accessibility. Trajectory Regional Index (ITr): This is obtained from the regional results:
2.5. GIS Analysis
- Transport networks can be simplified and interpreted as graphs, which can be analyzed through a set of measures that express the topological network connectivity and accessibility of different nodes. In our study, locations can be considered nodes, and arcs as routes. The arcs together have the properties of any network:• Each network has a finite number of places. • Each arc connects two different locations. • A pair of nodes consists of a single arc.• In the arcs, displacement in two directions is possible.Road network hot spot accessibility and spatial interactions was determined using ArcGIS Spatial Analyst extension tool, Kernel Density. Kernel Density calculates the magnitude-per-unit area of roads using a kernel function to fit a smoothly tapered surface to each road.
2.6. Measures of Connection
- The measures allow analysis of existing connections that helps to determine the degree of two-way communication between different nodes. The level of a network connection is greater when more arcs own the network, in relation to the existing nodes.The Beta Index (β) corresponds to the ratio between the number of arcs and the number of existing nodes in the network.
 where a is the number of arcs and b the number of nodes. The index values can range from 0 to (n - 1) / 2. In a network, the numerator null would be equal to 0, so that the index would yield a value equal to 0. However, when the number of arcs increases, the Beta Index will grow too, in the complete graphs.The Alfa Index (α) corresponds to the relationship between the number of existing circuits and the maximum possible in the network.
 where μ is the number of cycles and n the number of nodes.
3. Results
3.1. Evaluation of Road Networks
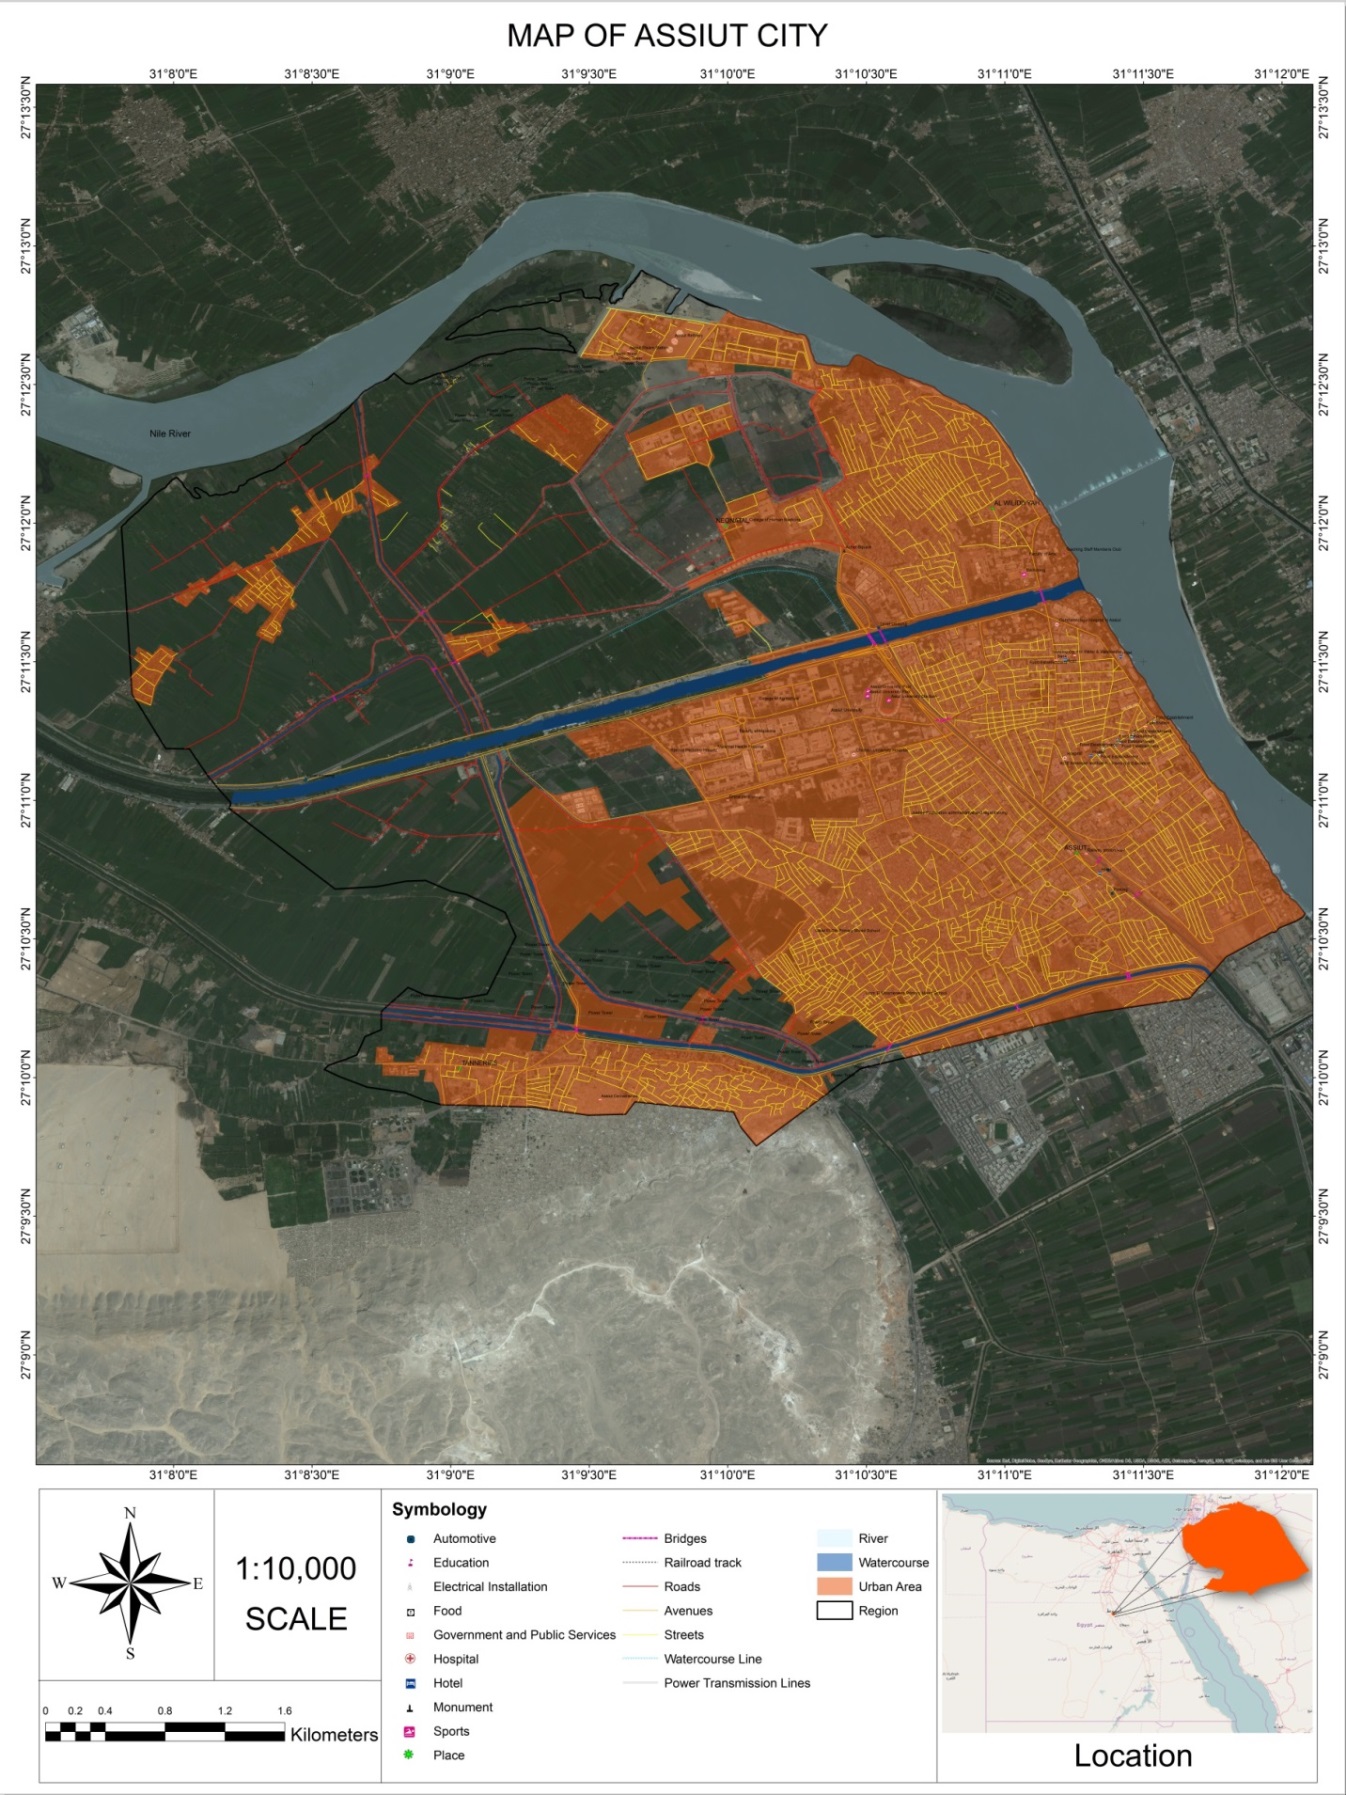
- Connectivity or cohesion determines the degree of reciprocal communication between the vertices, and the degree of integration or interconnection presents a network for its internal operations. The more arcs the graph has, the greater the degree of connectivity. In fact, it indicates the degree of structural complexity of the network. The total area of the city north of the ring road is about 25.31KM2. Land cover zones were digitised from imagery using ArcGIS. The agrarian zone covers about 45%, while the built-up area is about 53%, and water covers 2% of the city's total area. (See Figure 1 and Appendix 2.)
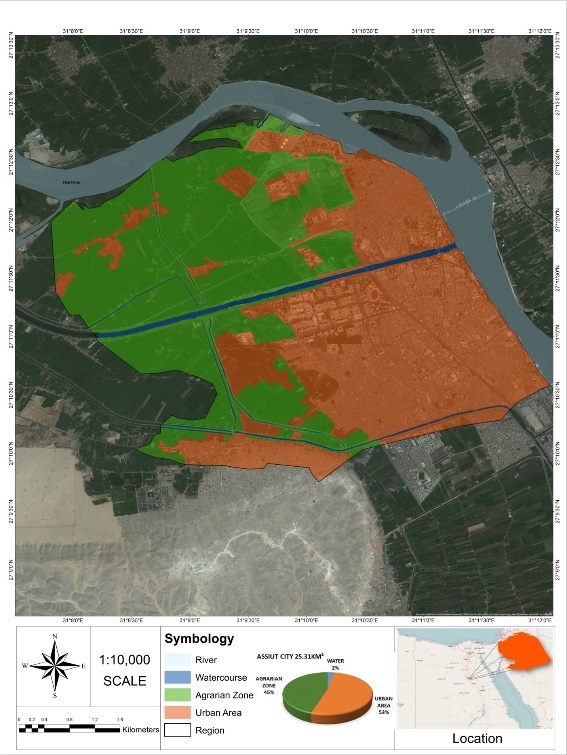 | Figure 1. Distribution of Assiut City territory. (Source: US Dept of Stat Geographer, 2016 Google, Image Landsat, 2016 ORION-ME.) |
3.2. Ideal Accessibility
- Accessibility measures allow us to analyze the spatial organization of the nodes of a graph, and competition processes have been established hierarchically, according to the ease of access from each, relative to the other nodes in the graph.
3.3. Calculations of Accessibility and Spatial Interaction
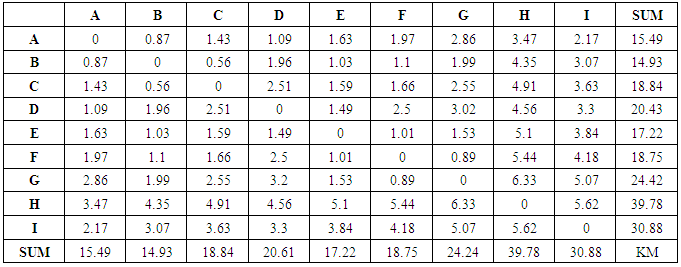
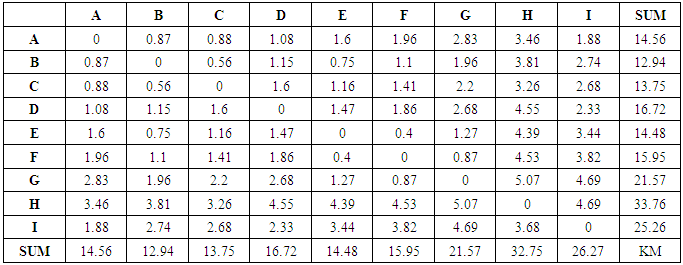
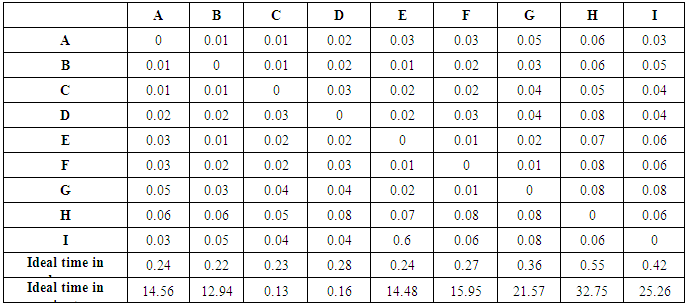
- Calculations were performed on nine samples located within Assiut City to generate matrices. Accessibility matrices are formed by rows and columns, and the distance (measured in km) is between the points.The values for Ideal Accessibility to Real Accessibility are obtained from the sum of rows and columns. The matrices are seen in Table 1 and Appendix 1.
|
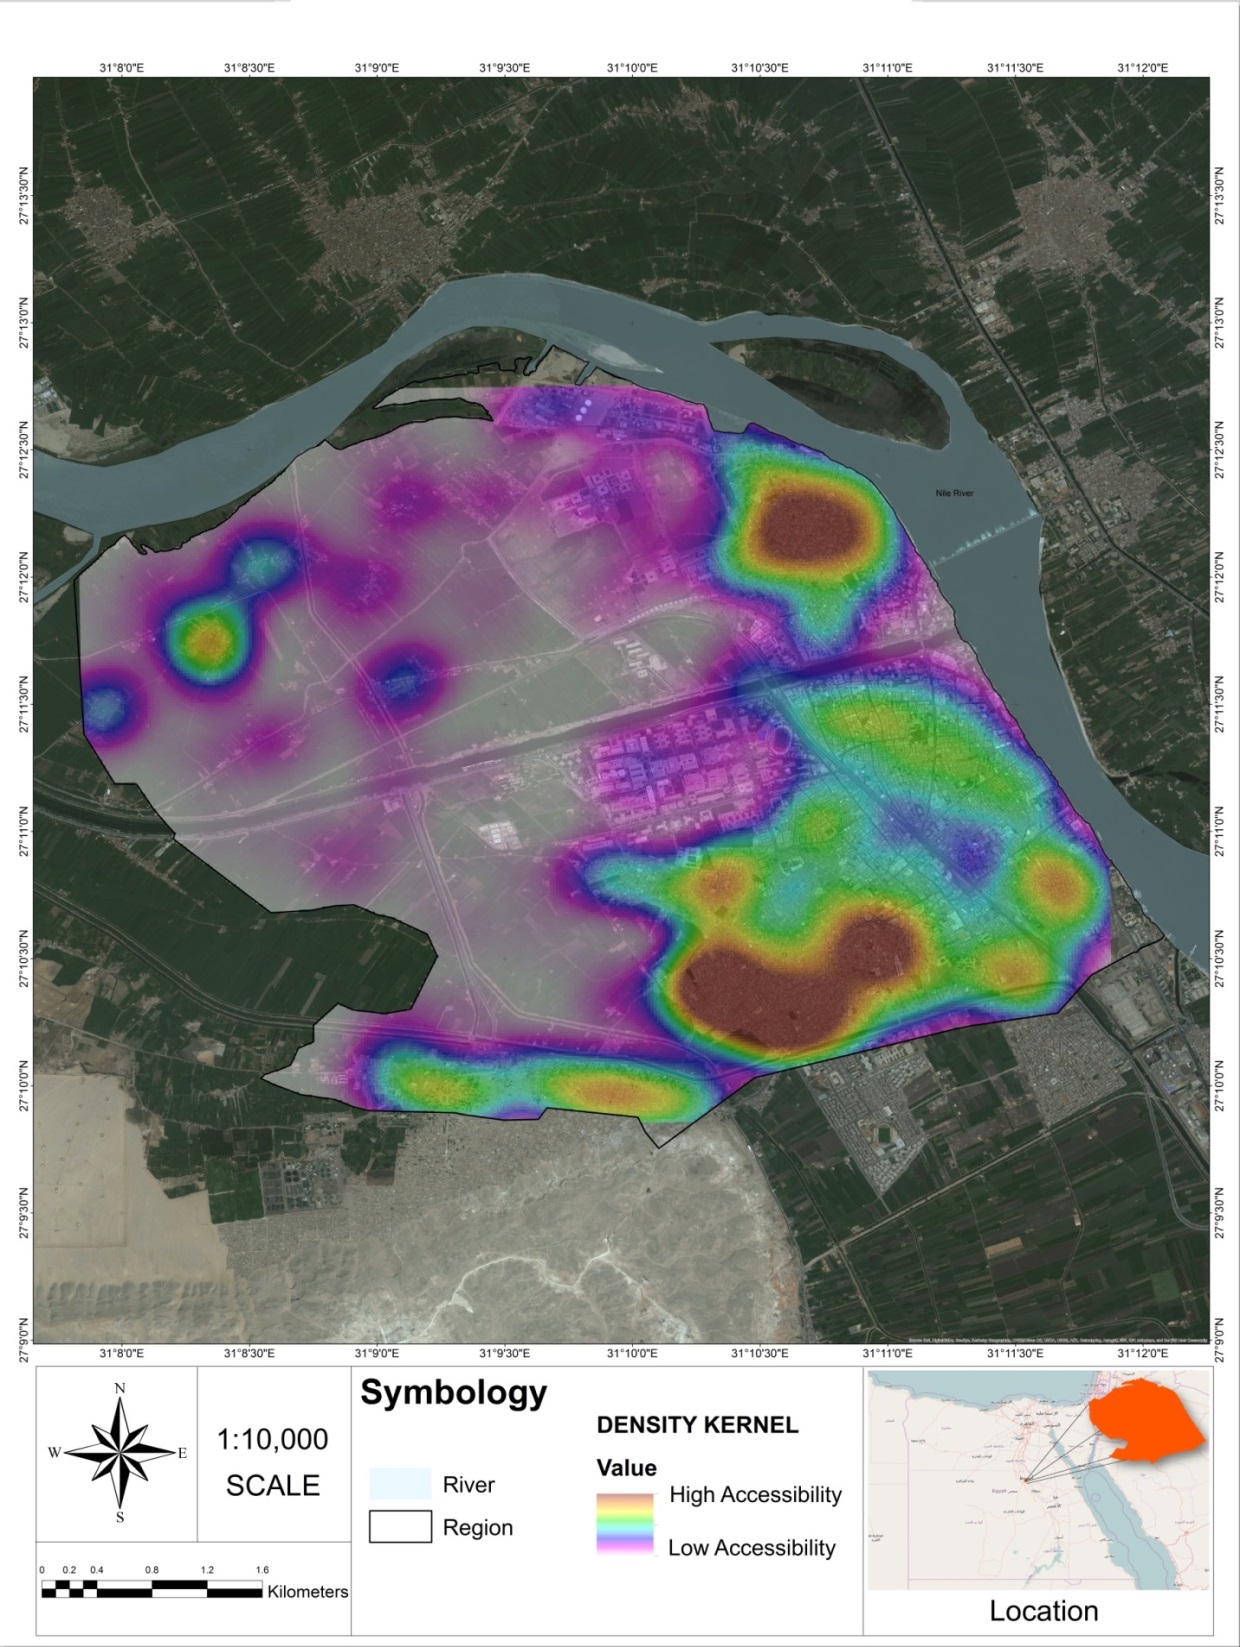 | Figure 2. Hot spot of road network accessibility and spatial interactions (Source: US Dept of Stat Geographer, 2016 Google, Image Landsat, 2016 ORION-ME.) |
3.4. Calculation of Ideals and Real Time
- The ideal and real times were calculated by considering the average travel time of a vehicle traveling at 60 km/h in the transport network of the study area. To create the matrix for an ideal time trajectory (ITT), ideal distances between nine exemplified samples for a real time trajectory matrix (RTT) were considered. The actual distances between each point were assessed and recorded using ArcGIS network analyst routing tool.Noting the results of the IT and RT in Appendix 5 and Appendix 6, a total path for each match is calculated. It is possible to show in the matrix that point B is the one with a shorter path, with a total value of 12.94 minutes and 14.93 minutes (IT and RT respectively); the maximum value of path that is recorded in the network belongs to the H point, with a total value of 32.75 minutes and 39.78 minutes (IT and RT respectively).
3.5. Indices
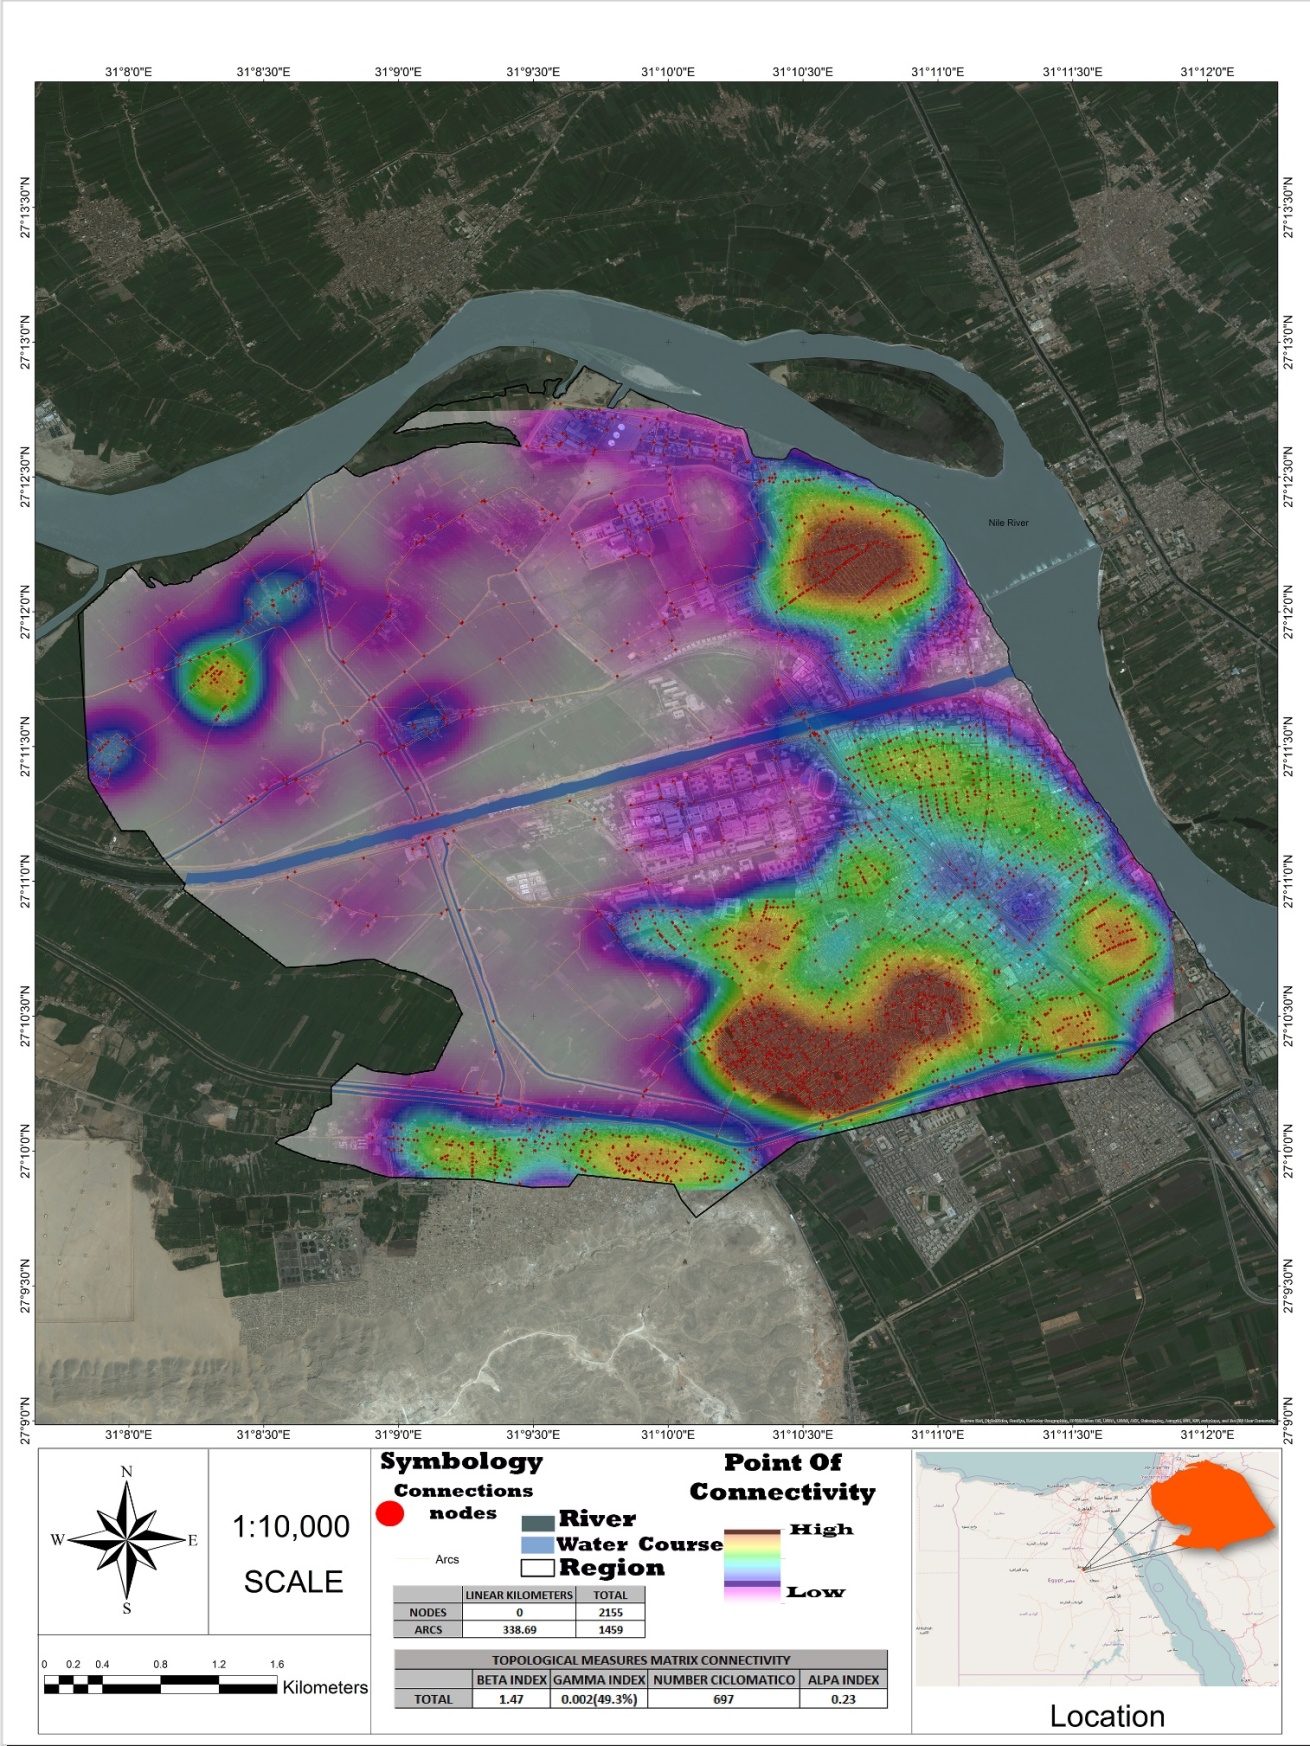
- By applying the formulas to our example we have:1. Beta Index (β) = 2155/1459 = 1.472. Gamma Index (g) = 2*2155/1459(1459-1) = 4310/2127222 = 0.0023. Gamma Index (g) % = (2155/3(1459-2) x 100) = 2155/4371 x 100 = 0.493 X 100 = 49.3%4. Number of cycles = (2155-(1459-1)) = 697 cycles5. Alfa Index (a) = 697/ 2(1459-5) = 697/2908 = 0.23The Beta Index (β) establishes the relationship between the number of arcs and number of nodes in a network. For the study area, the β reaches a value of 1.47. This indicates a badly connected network, since the number of arcs is noticeably fewer than the number of nodes. This is also checked and confirmed visually. (See Appendix 3 and 4.)The Gamma Index (g), equivalent to 0.002, indicates that the number of existing arcs is very small in relation to an “ideal” number of existing arcs. This index is confirmed by its application as a percentage, indicating that each node could introduce 49.3% of arcs for a more complete graph.The number of existing circuits in this network is 697, which coincides with a count from the map. The Alpha Index (a), equivalent to 0.23, indicates that the current number of network circuits is very low in relation to the “ideal” number of circuits, 2,908.Structural analysis of networks allows an overview of the existing framework. However, some indices allow an “ideal” analysis under the assumption of a greater number of nodes and edges that are probably not applicable to the spatial reality. These indices are highly important when it comes to comparing two networks, and even more so when the evolution of the same network is analyzed, and succeeds in identifying their transformations. Similarly, it is possible to discover the changes that could be introduced to a network by adding nodes and edges by way of simulation. The spatial interactions between some suggested points show that the lowest ideal and real accessibility represented by points B, A, E and F, is located in the Central Business District at El Gomhorya Street, where there is the lowest number of points of connectivity (see Figure 3 and Appendix 3:7).
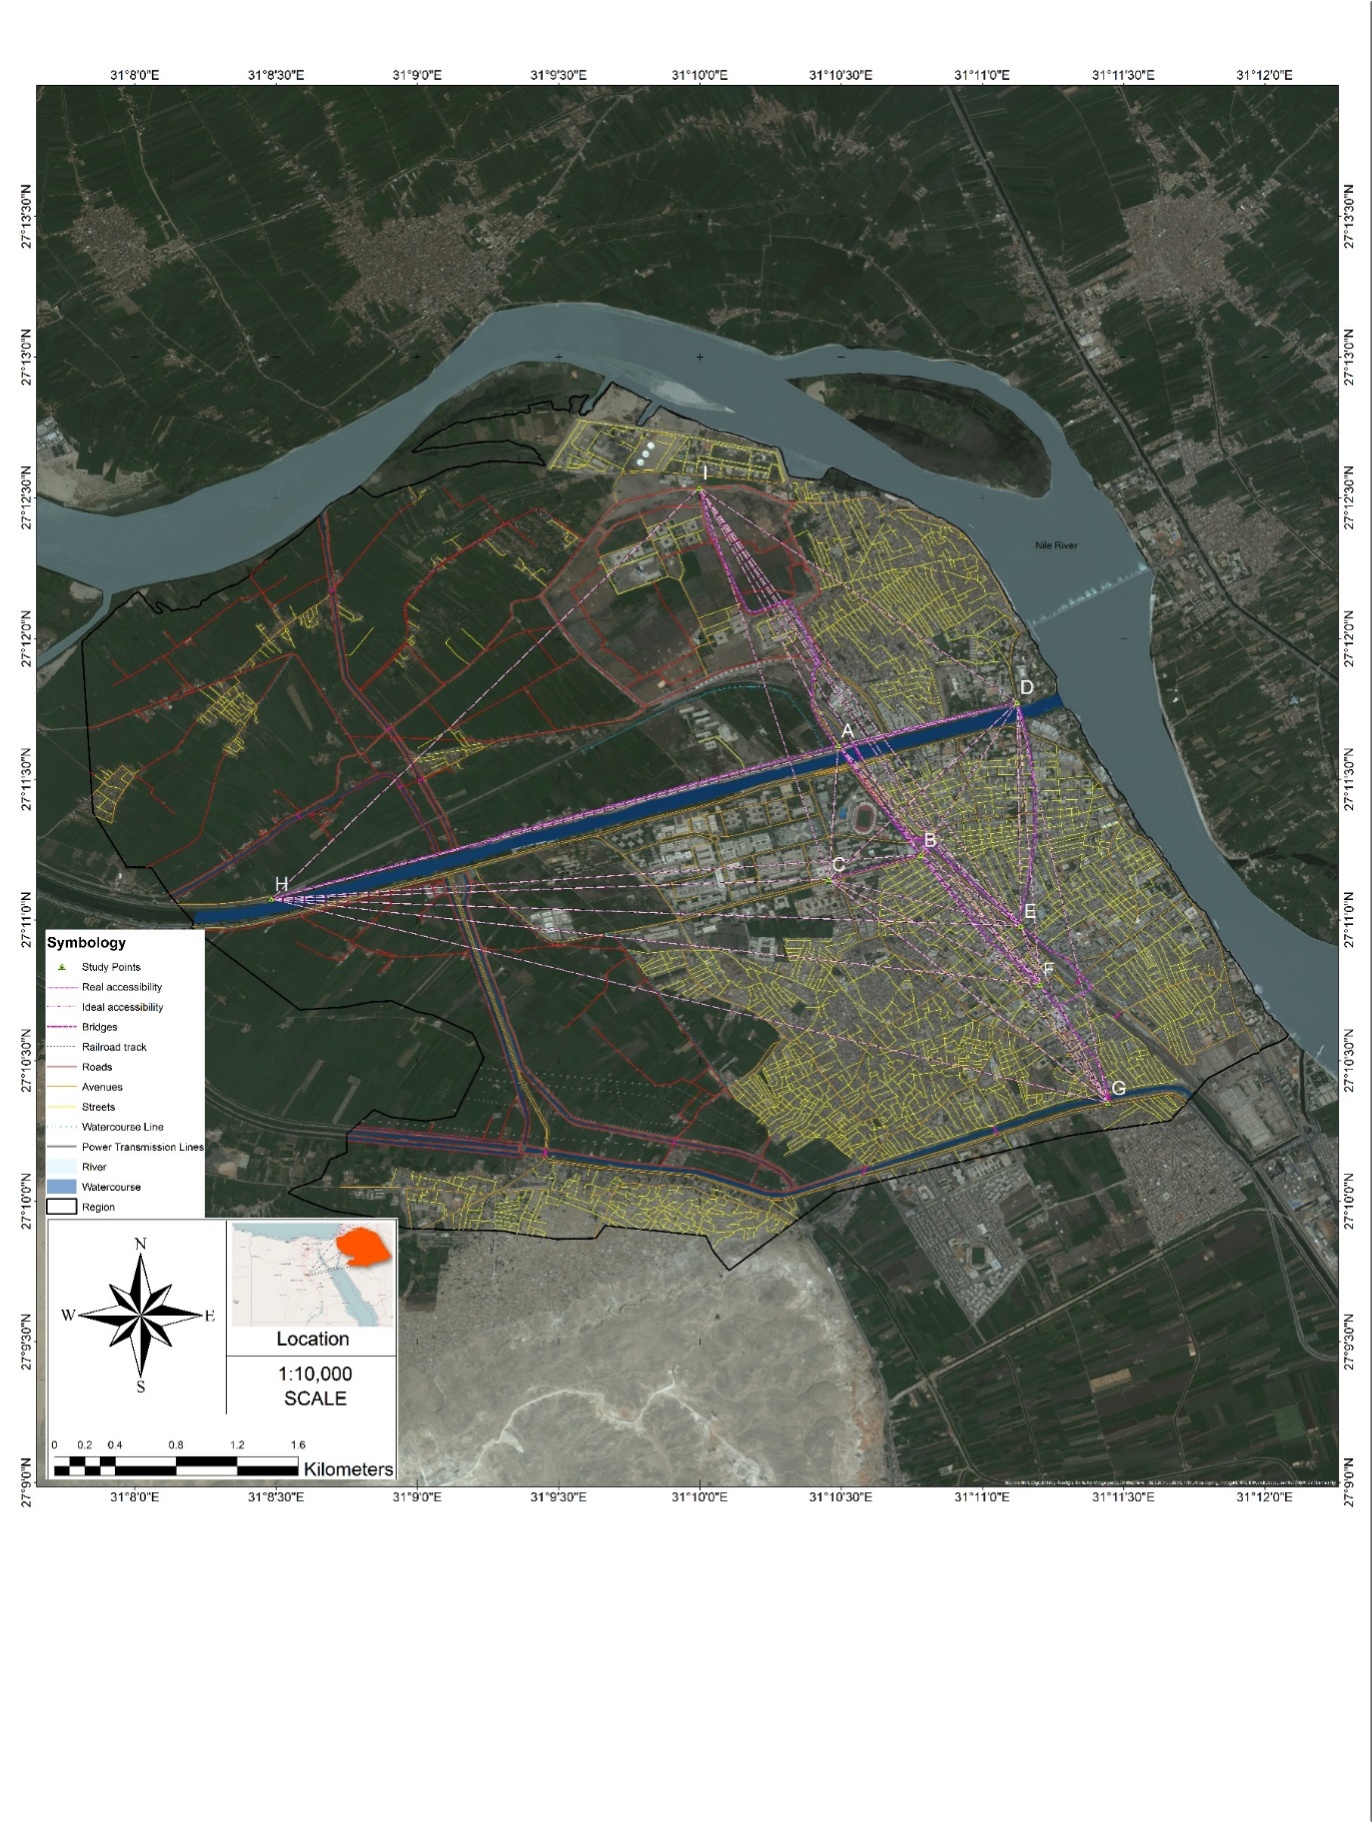 | Figure 3. Assiut City accessibility and spatial interaction. (Source: US Dept of Stat Geographer, 2016 Google, Image Landsat, 2016 ORION-ME.) |
3.6. Cumulative Opportunity
- The analysis of cumulative opportunity was performed by preparing a density model based on the service layer identified within the study area. This helped to establish a measurement range of the number of services available within a certain distance or travel time to the inner city, identifying the main areas of interest.
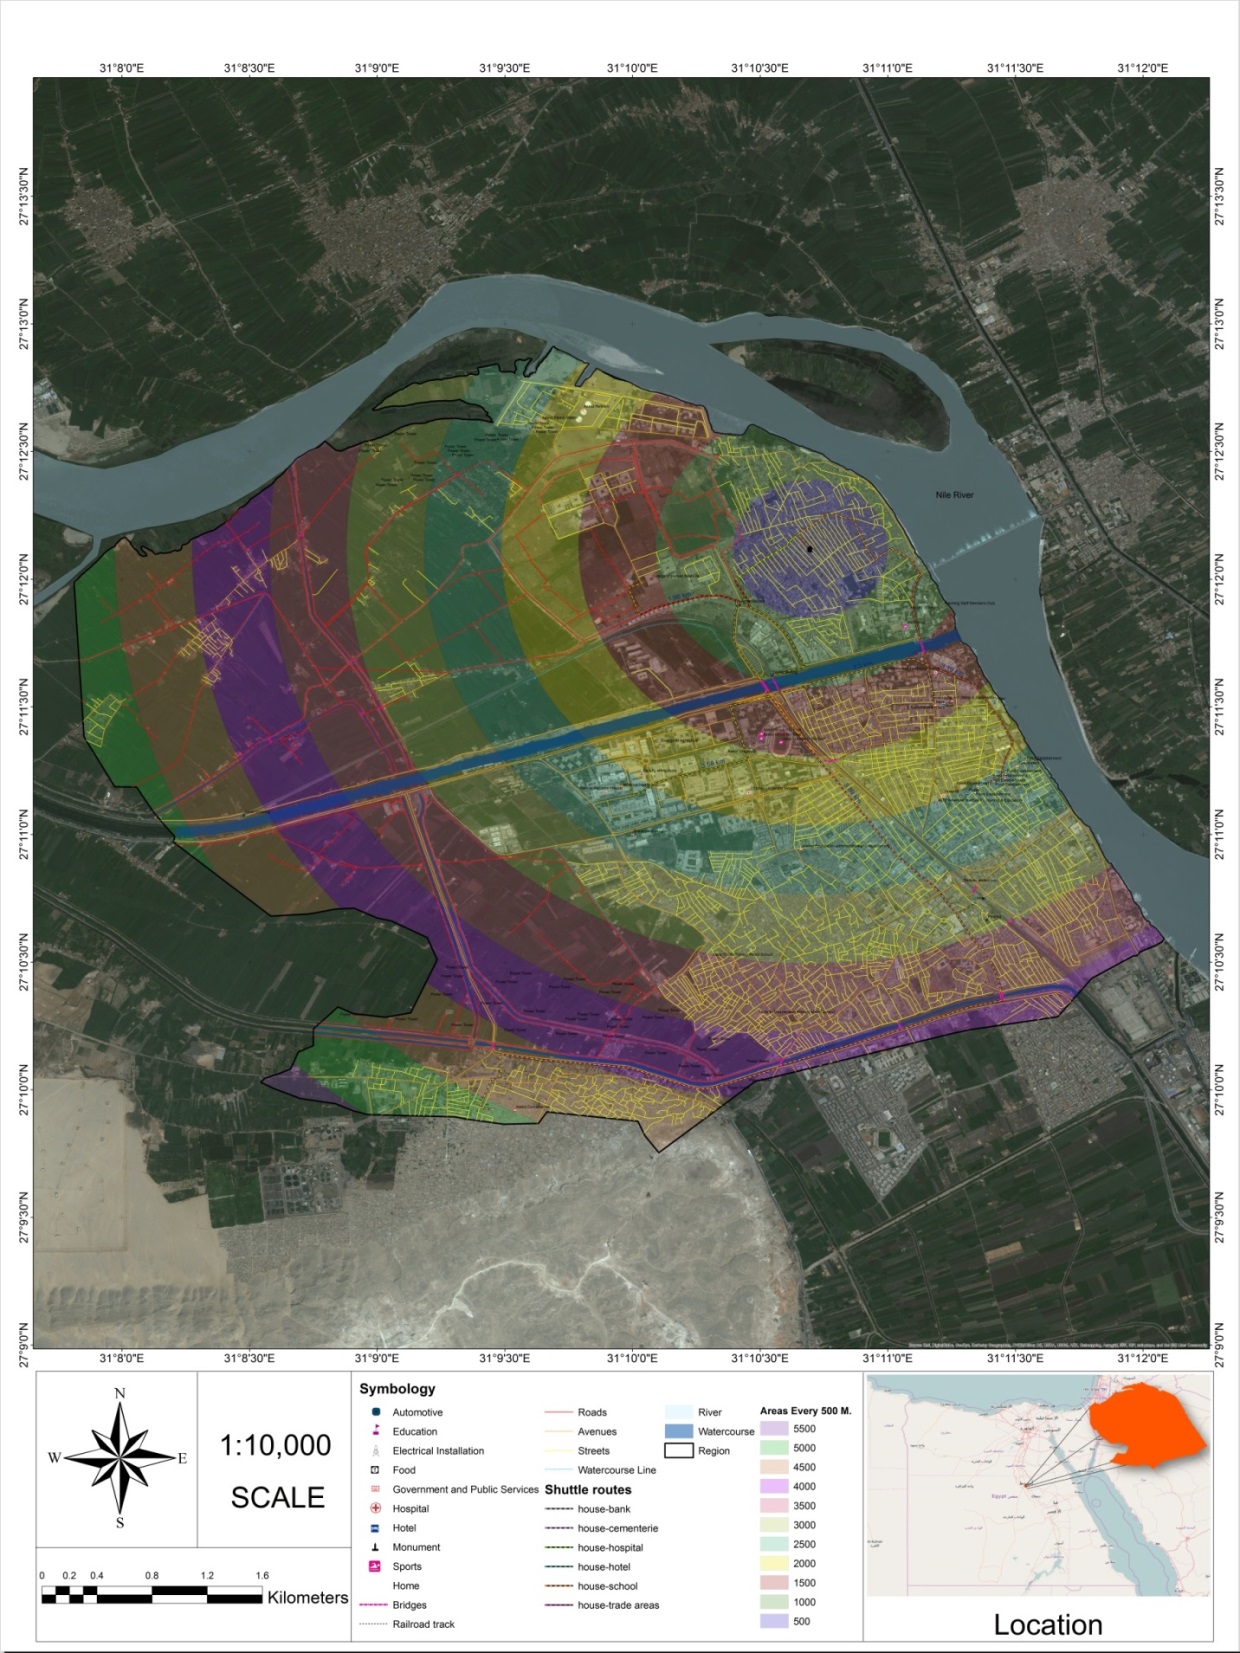 | Figure 4. Cumulative opportunity and analysis of services area |
3.7. Analysis of Route in the Event of a Disaster Scenario
- The location of risk areas was conducted, taking the Nile and the Assiut refinery as the main reference for a buffer of 300m. Streams and canals within the city were considered secondary, with a buffer of 100m. Buffer Analysis in ArcGIS was performed in order to determine the risk zone in the city. Then a random point was integrated within the city, called home, as a starting point for the margin which starts to find the optimal evacuation route in case of a disaster. The first default zone is located in the center of Al Walyydiah District. In the event of disasters, the evacuation process would be through the northwest of Al Walyydiah district through Takssim Alrai, then the Al Mashtal and Adel Salam Metwally route. The second suggested point is located nearest to the Al Tagneid zone, and the evacuation process would be through Goda Al Asadai Street, then the rail tunnel and Yousry Raghib Street and the ring road towards the west (See Figure 5).Thus, finding a number of routes for disaster management is based on the following three principles:1. Shorter route2. Quicker route3. Safest route.
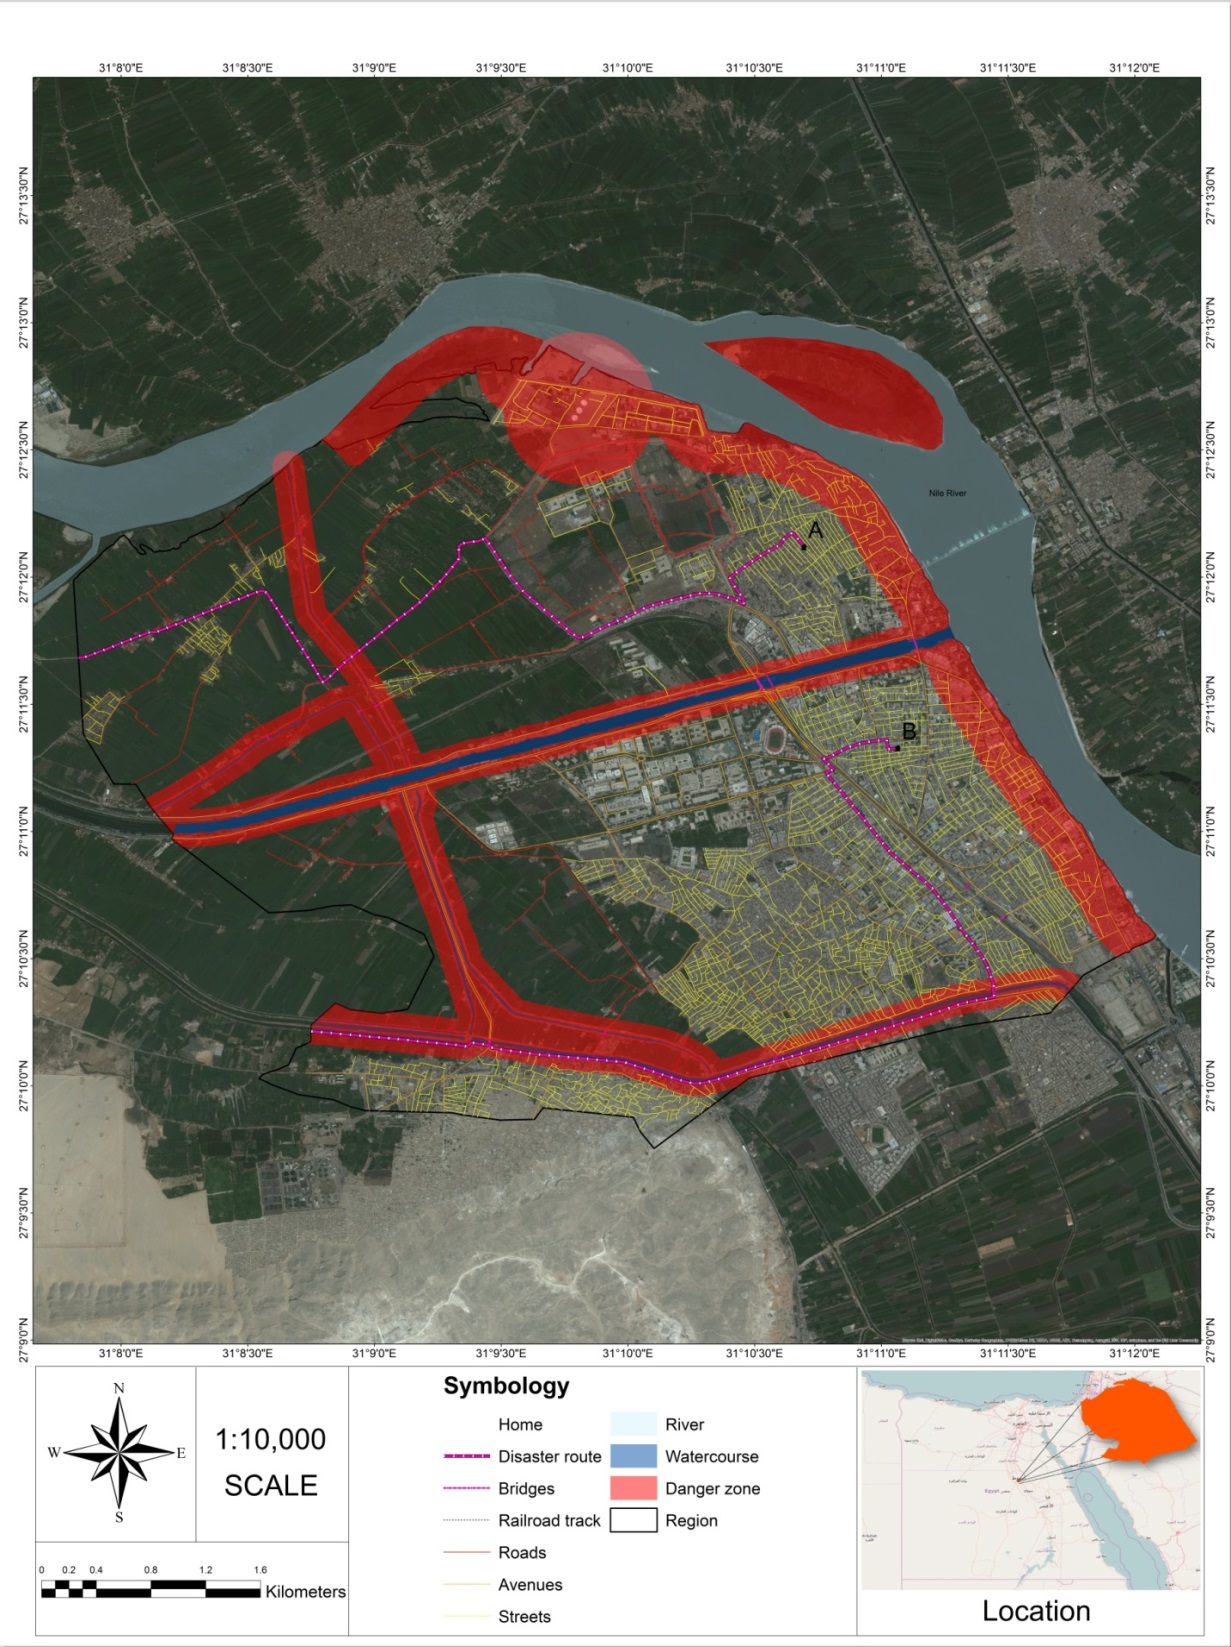 | Figure 5. Route analysis with a barrier in case of a disaster |
3.8. Service Areas Analysis
- Areas of influence were generated by creating multiple ring zones around a point called home with a specific distance of 500m using ArcGIS multiple ring buffer tool. This creates a new layer, which is useful for solving issues such as defining points of interest that are within or outside a specified area of influence.Once service areas were located, some routes to destinations were created by measuring the actual distance across nodes and arcs. This type of analysis enables the design and drawing of transport routes and communication through GIS analysis.
3.9. Degree of Connectivity of Streets in the City
- A node density model was developed using ArcGIS Spatial Analyst extension, Point density tool, which shows the connection level of streets with the main avenues. The number of kilometers of each type of road, as well as their percentage within the study area, was determined. Of the total communication routes, streets represent 190km (about 53%), while avenues represent 80.7km (about 23%), roads about 67.5km (20%), and railroads 7.5km (about 2%) (see Figure 6).
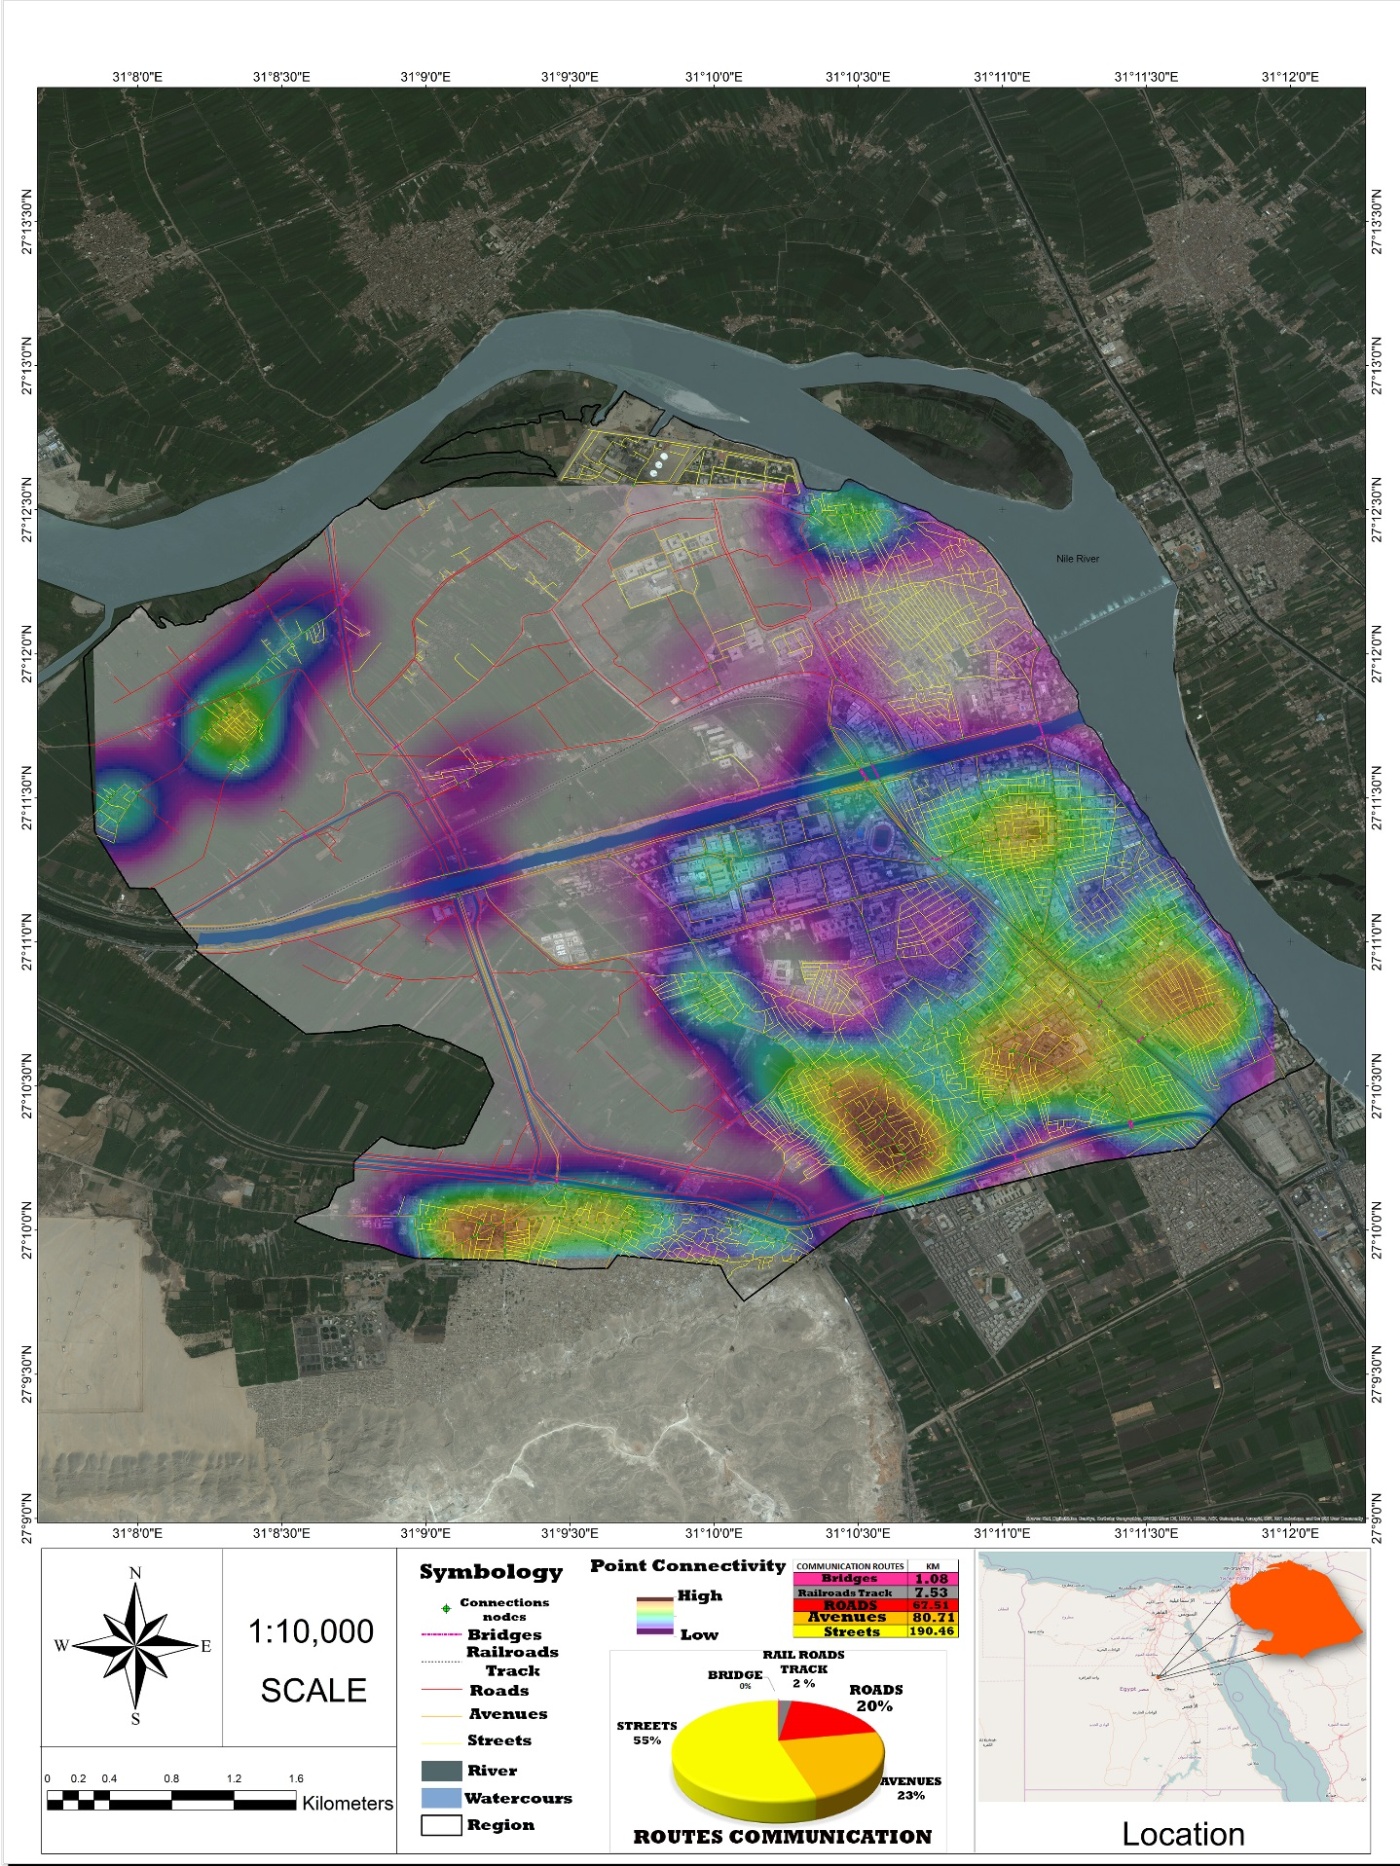 | Figure 6. Degrees of connectivity inside the city |
4. Conclusions
- In order to build a sustainable strategic plan to establish a transport framework for Assiut City, we studied the various matrices between real-time data and ideal data. Comparisons were also made on the basis of topography and the evaluation of road networks, and the results indicated which locations were most accessible and were connected to other parts of the city, and which were not. This knowledge will help make decisions in setting up a transit plan across the city. The GIS approach provides us with accurate mean results, while the graph theory easily translates complicated data into simple numbers with very little variance across data sets. The use of these two approaches in conjunction with real-time synchronization has given us empirical values that can be stored for posterity. Transport networks need to be accessible, affordable and well maintained. Therefore, all regions which are found to be distant from nodes existing currently on the transportation network need to be connected well with them. In fact, the setting up of new nodes in remote areas will make it easy for decision makers to improve connectivity between networks. Furthermore, the arcs used in this study tell us how well connected various networks are, and probable routes that need to be set up or exist as an alternative in cases of emergencies. Disaster management efforts can be escalated easily using this data. Public transport services can be optimized by the cutting down of loads, increasing fleets, using efficient stoppage and transition times and improving employee performance through a coherent approach in strategic planning. To begin with, the decision-making body can focus on the least connected areas. After they have a first-hand approximation of the needs of the place, and the data-based suggestions of how to fill transportation network gaps in these areas, they can undertake setting up of better transportation channels. Seamless integration of walkways with roadways will help ensure that people flow from remote areas of the city, especially those in the slums, remains uninterrupted. A thorough and sustainable transportation network established through strategic planning, as portrayed in this study, is sure to improve the city’s chances of becoming a sustainable, environment-friendly, futuristic and well-planned city. Our study has provided the basis on which decision making regarding any aspect of transportation strategic planning can be undertaken.
5. Recommendations
- Additional analysis is recommended incorporating multiple modes of transport to effectively evaluate the best transport network model for Assiut city, Egypt. Higher connectivity often results in additional vehicle traffic. Car sharing or ride sourcing (Uber) is limited for improving the efficiency of a transportation network, as this still adds to traffic congestion, and vehicles such as cars have a maximum capacity of 4-5 passengers. Other modes of transport including cycling and public transportation such as light rail are environmentally friendly and aim to reduce traffic congestion and pollution, plus have additional health benefits through exercise. Combing cycling and light rail would provide benefits such as shorter travel times during periods of traffic congestion and increased service areas.
Appendixes
|
 | Appendix 2. Location of Assiut City built-up area, northern ring road |
|
|
|
|

 | Appendix 7. Assiut City connection nodes, northern ring road |