-
Paper Information
- Paper Submission
-
Journal Information
- About This Journal
- Editorial Board
- Current Issue
- Archive
- Author Guidelines
- Contact Us
American Journal of Geographic Information System
p-ISSN: 2163-1131 e-ISSN: 2163-114X
2016; 5(2): 33-39
doi:10.5923/j.ajgis.20160502.01

Remote Sensing Based Water Surface Extraction and Change Detection in the Central Rift Valley Region of Ethiopia
 Abstract
 Reference
 Full-Text PDF
 Full-text HTML
Amare Sisay
School of Natural Resource and Environmental Studies, Wondo Genet College of Forestry and Natural Resources, Hawassa University, Hawassa, Ethiopia
Correspondence to: Amare Sisay, School of Natural Resource and Environmental Studies, Wondo Genet College of Forestry and Natural Resources, Hawassa University, Hawassa, Ethiopia.
| Email: |  |
Copyright © 2016 Scientific & Academic Publishing. All Rights Reserved.
This work is licensed under the Creative Commons Attribution International License (CC BY).
http://creativecommons.org/licenses/by/4.0/

Multi-temporal remote sensing image data based change detection is one of the most acceptable and ever growing water surface change detection mechanisms in recent years. Because of the recent advancements in water indices techniques and availability of multi-temporal and multi-spectral imageries, detection of surface water changes has become a lot easier. This study has, therefore, implemented NDWI and AWEI among others to extract and quantify the water surface area changes of Lake Shala, Abjata and Langano in the Central Rift Valley Region of Ethiopia. In doing so, landsat images of 1973 (MSS), 1986 (TM), 2000 (ETM+), 2005 (ETM+), 2011 (TM) and 2014 (OLI_TRIS) has been used. The results show that Lake Shala and Lake Langano has shown very small changes (-3.68 sqkm & -10.2 sqkms respectively) as compared to the surface area change of Lake Abjata (-68 sqkm) between 1973 and 2014, hence making Lake Abjata the most abruptly changing lake in four decades.
Keywords: Change Detection, Remote Sensing, Surface Water Extraction, Water Indices, Lake Abjata, Lake Shala, Lake Langano
Cite this paper: Amare Sisay, Remote Sensing Based Water Surface Extraction and Change Detection in the Central Rift Valley Region of Ethiopia, American Journal of Geographic Information System, Vol. 5 No. 2, 2016, pp. 33-39. doi: 10.5923/j.ajgis.20160502.01.
Article Outline
1. Background and Justification
- Remote sensing imageries has widely been used in environmental studies to detect changes caused either due to natural factors or anthropic factors [5, 9]. Change detection, defined by [14] as “the process of identifying differences in the state of an object or phenomenon by observing it at different times”, essentially comprises the quantification of temporal phenomena from multi-date imagery acquired by satellite based multi-spectral sensors [11]. It is more elaborated by [8] as the process involving the application of multi-temporal datasets to quantitatively analyze the temporal change of the phenomenon. Hence, change detection can be generalized as a means of identification, recognition and quantification of temporal differences of the same features or phenomenon occupying a well-defined spatial extent. Several multi-temporal remote sensing data based change detection approaches have been developed so far [15] making the area of change detection an ongoing research agenda [9]. Despite their varieties, however, most of the change detection approaches are commonly structured in two major steps. Feature extraction being the first step, it refers to the processing of remotely sensed imageries in order to extract pertinent information thereby preparing the input required for the decision step. The next step, decision step, involves the applications of operations on the extracted features in order to produce ‘change’ versus ‘no-change’ models that are considered as the final outputs [5]. Mapping of ‘change’ versus ‘no-change’ can be achieved using techniques including image differencing, image ratioing, or principal component analysis (PCA) and tasseled cap transformations [15].Water being a very crucial environmental resource, several techniques have been introduced in recent decades for its extraction as a feature from satellite data. One of which is a single-band method which utilizes a selected threshold value to extract water features. Classification techniques adopted to extract surface water are normally more accurate compared with single-band methods [1]. A recently developed approach for change detection of water bodies is water indices. Water indices refers to mathematical models that enhance the water signals for a given pixel at images obtained from visible/near-infrared scanning sensors. These models are usually calculated from two to four bands; the Green, near-infrared, mid-infrared and shortwave infrared portions of the spectrum. From among the water indices developed for the extraction of water features from Landsat imageries the Normalized Difference Water Index (NDWI) [10], Modified Normalized Difference Water Index (MNDWI) [18], Normalized Difference Moisture Index (NDMI) [17], Water Ratio Index (WRI) [13], Normalized Difference Vegetation Index (NDVI) [12] and Automated Water Extraction Index (AWEI) [3] are the most common ones. In Ethiopia there are plenty of places which can benefit from these multi-temporal imagery based water extraction techniques that has been developed. Among the plenty of places, the Central Rift Valley Region, part of the Great Rift Valley that runs through Ethiopia, is one potential geographic area that can make use of the water indices techniques in tracking some of its changing water bodies. This region is known for being a home to four major lakes (Lake Abjata, Lake Langano and Lake Ziway) including the neighboring Lake Shala. Lake Shala, the deepest lake (256 meter deep), is a closed highly alkaline lake which is separated from Lake Abjata by a volcanic caldera rim [2].According to [2] the neighboring Lake Langano, known in Ethiopia for being the home to recreational resorts, is fed by rivers from the highlands on eastern side of the Rift Valley and flows towards Lake Abjata through the Horakela River. Unlike the almost constant levels of Lake Langano or Shala, however, Lake Abjata has got a different story in relation to its area cover changes. Different researches show that Lake Abjata has been showing a constant decline in its water level and areal extent since 1980 for reasons mostly unknown. [2] explains that water abstractions as the main cause of the decline. He further stated that Lake Abjata is sensitive to any reduction of flow in the Bulbula River, either through lake level dropping in Lake Ziway or through direct pumping of water along the course of the Bulbula River to supply Ziway and Bulbula town water supplies, or diverted for small irrigation plots. The direct pumping of water from the Lake Abjata for commercial exploitation of soda ash by evaporation of saltwater also impacts on lake levels.Since Lake Abjata is fed principally by spills of the upstream lakes of Ziway and Langano, and because of its terminal position in the drainage area, and its shallow depth, Lake Abjata has a more pronounced sensitivity to changes in its basin and is especially susceptible to any diversion of feeder rivers for irrigation projects along the Meki and Katar Rivers and to water abstracted directly from Lake Ziway for irrigation and domestic consumption [6].This shows that Lake Abjata is in a very acute situation, either due to the water drained for developmental activities including the soda factory, floricultures or irrigation schemes near and around the central rift valley or due to environmental factors such as decline in rainfall, higher temperature thus higher evapo-transpiration. However, the extent to which the areal coverage of Lake Abjata and the nearby Shala and Langano lakes are changing is not yet clearly quantified. The aim of this research, thus, is to extract and quantify the level of surface area changes that Lakes Shala, Abjata and Langano had undergone over the past four decades (i.e. 1973 – 2014) using remotely sensed Landsat imageries. By achieving this objective, the research aspires to create awareness on what has been happening to the central rift valley lakes over the years and bring the need for further studies and interventions in to environmentalists’, policy makers’ and the general public’s attention.
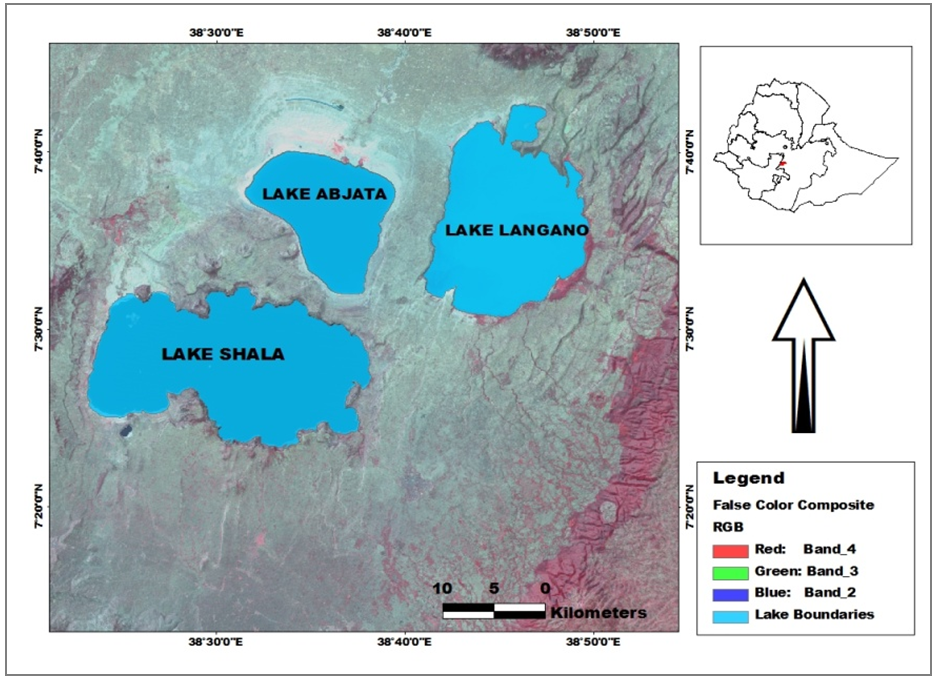 | Figure 1. Location of Lakes Shala, Abjata, and Langano in the Central Rift Valley region of Ethiopia |
2. Methodology
2.1. Data Collection
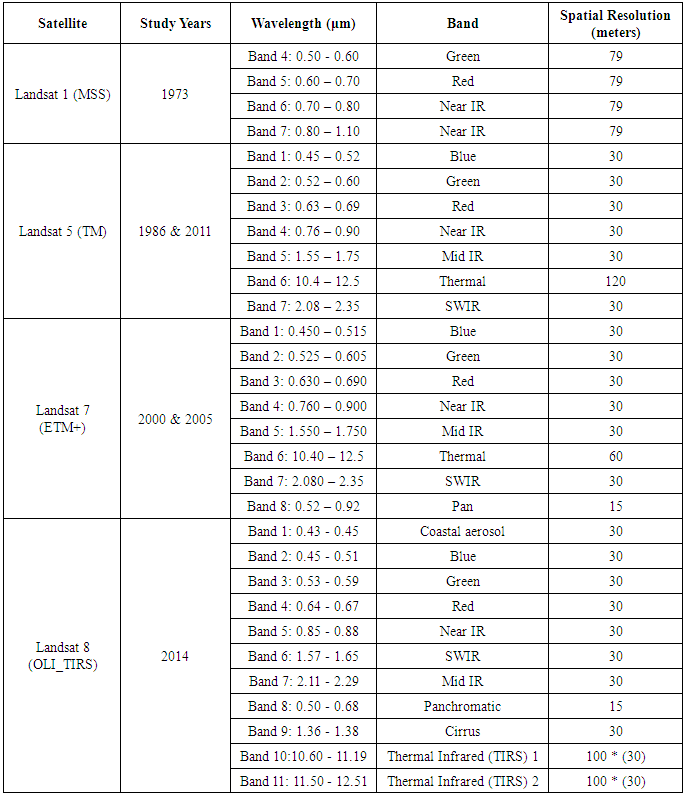
- In order to reach at the final aim of the study, Landsat image data types of MSS, TM 5, ETM+ 7 and OLI_TRIS of Landsat 8 were first collected from different sources. The MSS, TM and ETM+ imageries were obtained from GLCF online image download service while the OLI was obtained from US Geological Survey (USGS) Global Visualization Viewer. The acquisition date for the MSS image data was on January 31, 1973; TM image on January 21, 1986 and January 10, 2011; ETM+ image on February 05, 2000 and December 03, 2005, and OLI_TIRS on February 06, 2014.
2.2. Preprocessing
- The collected image data were then geometrically corrected and referenced to UTM 37N coordinate system (WGS 84 datum and Spheroid). Furthermore, since all of the individual bands were originally obtained as a Digital Number (DN) values, the original DN values had to be converted in to radiance, and then in to reflectance. This was important step in extracting the water surface with better accuracy. Thus, the geo-corrected, reflectance value converted bands were finally used in calculating the NDWI and AWEIs of each year.
2.3. Water Surface Extraction
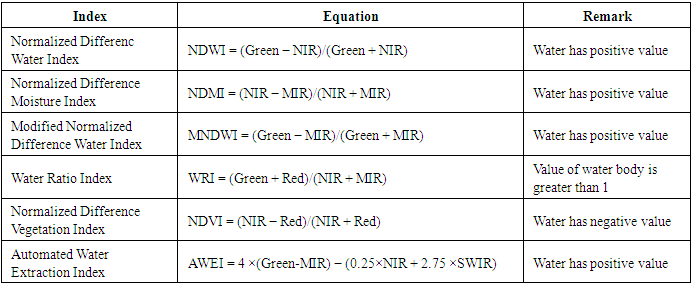
- In trying to identify the surface water area, NDWI was calculated for the MSS image data of 1973 and AWEI for TM, ETM+ and OLI_TIRS of 1986, 2000, 2005, 2011 and 2014. NDWI was selected for the MSS band of 1973 because the MSS image data lacks mid infrared band (MIR) making it suitable only with NDWI. For the remaining study years, AWEI was selected because it gave better result in representing the available surface water of all the three lakes. Calculating the water indices for each year was carried out on raster calculator. The calculated water indices were then further reclassified in to two different classes where by positive values were identified as water bodies and negative values as land surfaces. The data type specifications and water indices algorisms considered are indicated in tables 1 and 2 below.
|
3. Result and Discussion
- Surface water area for each of the three lakes was calculated by using Normalized Difference Water Index (NDWI) for 1973 (MSS) and Automated Water Extraction Index (AWEI) for years 1986 (5 TM), 2000 (7 ETM+), 2005 (7 ETM+), 2011 (7 ETM+) and 2014 (OLI_TIRS). Figure 2 shows that both Lakes Shala and Langano (Left bottom and Right top) has shown very little change in their shape & spatial coverage for all years. Unlike both lakes, however, Lake Abjata (middle top) has shown a very significant and discernible change in its surface area cover for each study year.
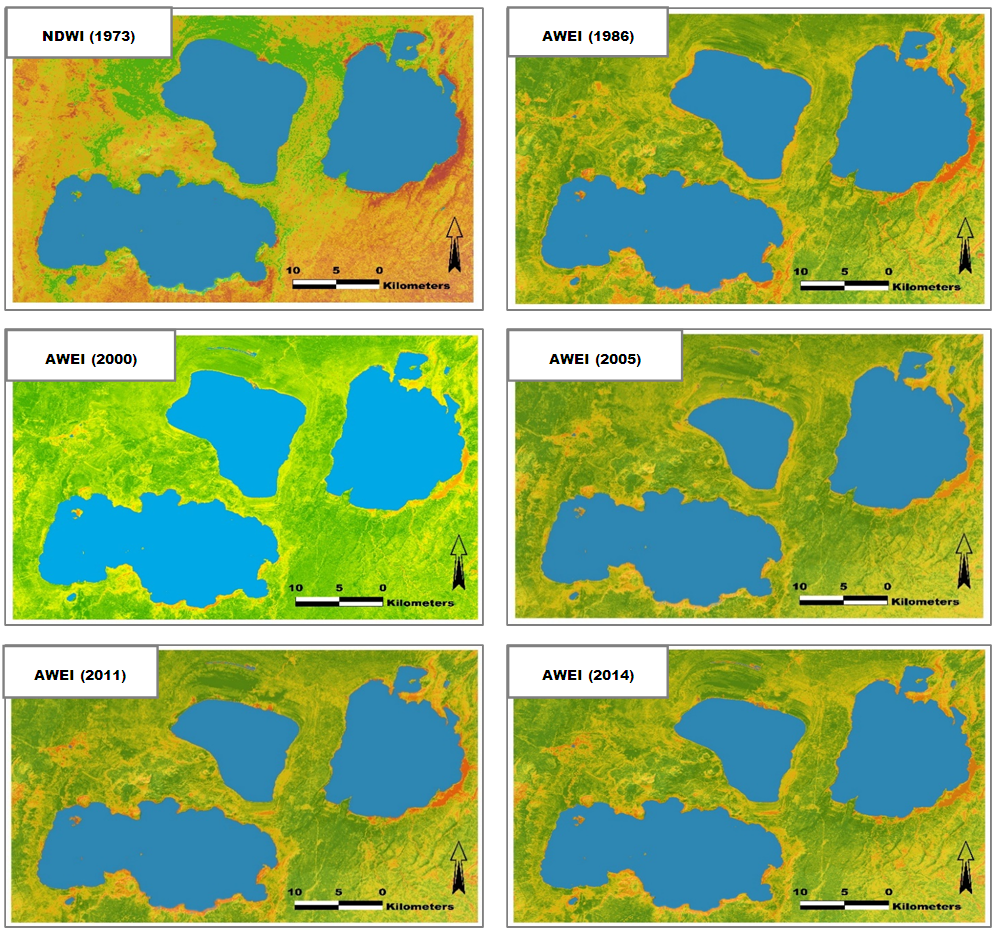 | Figure 2. Water Index maps developed using NDWI for 1973 and AWEI for years 1986, 2000, 2005, 2011 and 2014 |
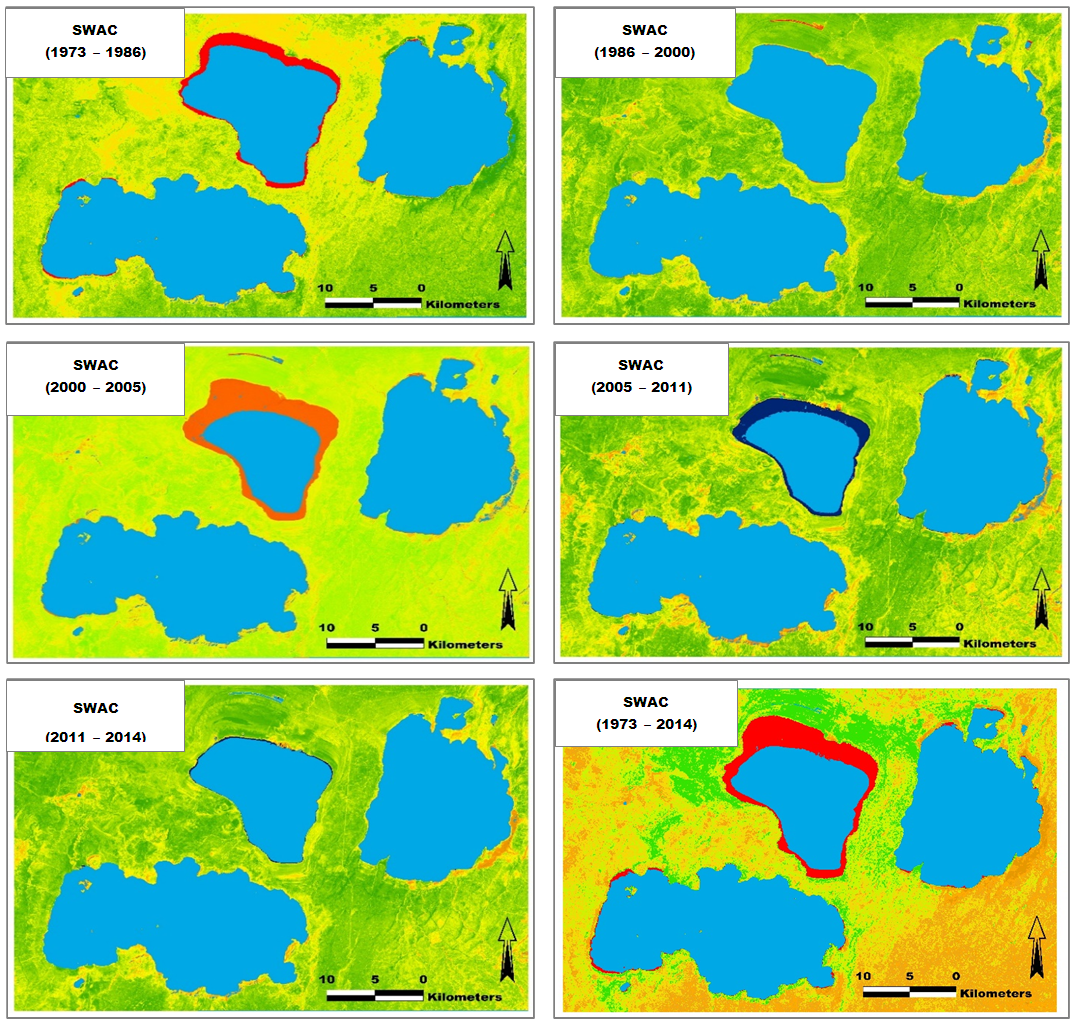 | Figure 3. Surface Water Area Change (SWAC) maps showing the area changes between study years and over fourdecades |
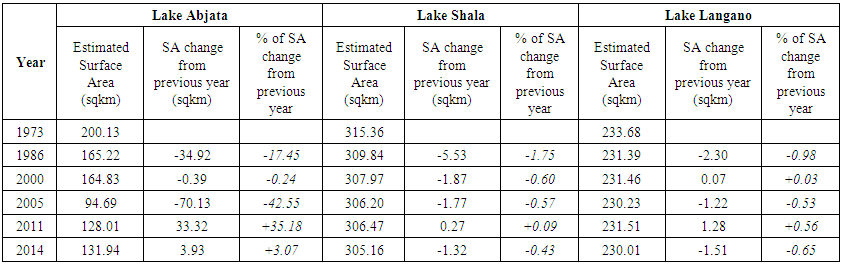 | Table 3. Surface area changes for Lakes Abjata, Shala and Langano both in percent and square kilometers (sqkm) |
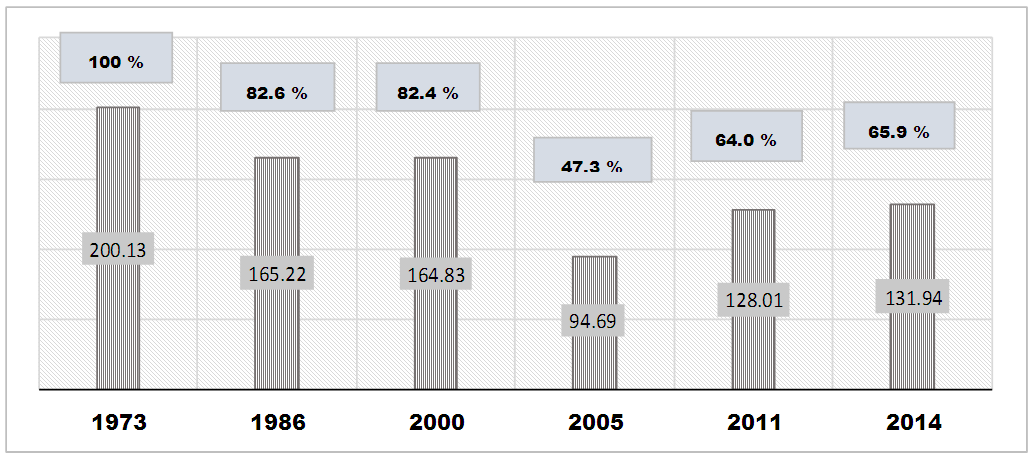 | Figure 4. Lake Abjata’s surface water area changes in percent and square kilometers |
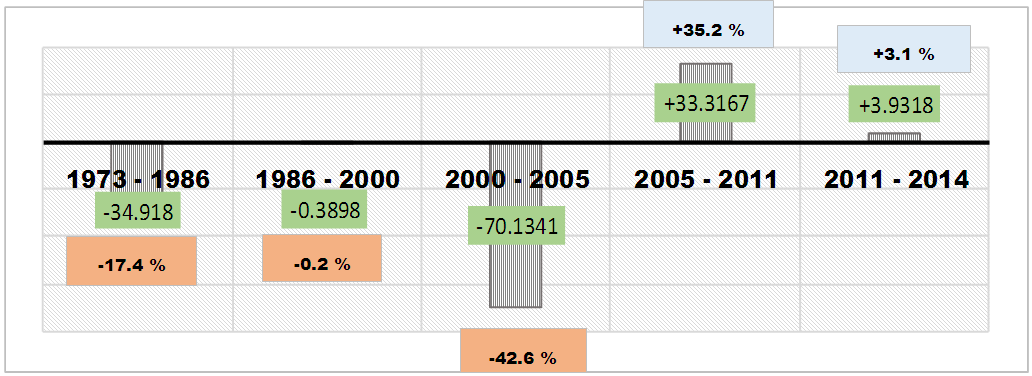 | Figure 5. Lake Abjata’s surface water area (SWA) changes between 1973 and 2014 both in percent and Squared Kilometers (sqkm). (N.B: negative values represent a decreasing trend and positive values an increasing trend) |
4. Conclusions
- The results of the analysis reveal that both lake Langano and lake Shala has shown very little changes (-3.68 sqkm & -10.2 sqkms respectively) in their surface area coverage over the past decades. Unlike the two lakes, however, Lake Abjata has shown a very significant decline (-68.19 sqkm) between 1973 and 2014. This lake has shown very erratic changes in its area coverage by losing almost 105 sqkm between 1973 and 2005 and then climbing back up by 37.25 sqkms in 2014. This, thus, makes Lake Abjata a central rift valley lake with a very dramatic decline and rise history in about forty years period.
ACKNOWLEDGEMENTS
- I am greatly indebted to WGCF&NR Research Office and Hawassa University for every support provided during the research period. The author also would like to thank anonymous reviewers for their valuable comments.
References
| [1] | Du, Z.; Linghu, B.; Ling, F.; Li, W.; Tian, W.; Wang, H.; Gui, Y.; Sun, B.; Zhang, X. (2012). Estimating surface water area changes using time-series Landsat data in the qingjiang river basin, China. J. Appl. RemoteSens. |
| [2] | Ester Raventós Vilalta. (2010). Water Resources Management in the Central Rift Valley of Ethiopia. MSc Thesis. Universitate Politecncia De Catalunya, Barcelona, Spain. |
| [3] | Feyisa, G.L.; Meilby, H.; Fensholt, R.; Proud, S.R. (2014). Automated water extraction index: A new technique for surface water mapping using Landsat imagery. Remote Sens. Environ., 140, 23–35. |
| [4] | Global Land Cover Facility (GLCF). (2004). Landsat Technical Guide. University of Maryland Institute for Advanced Computer Studies, Department of Geography. |
| [5] | Gregoire M., Stephane D., Emmanuel T., Lionel B., (2010). Change detection in remote sensing observations. ISTE Ltd and John Wiley & Sons Inc, pp. 95-142, Digital Signal and Image Processing Series. |
| [6] | Halcrow Group Limited and Generation Integrated Rural Development Consultants (GIRDC) and Ministry of Water Resources (MoWR). (2009). Rift Valley Lakes Basin Integrated Resources Development Master Plan Study Project. |
| [7] | Komeil R., Anuar A., Ali S., Sharifeh H. (2014). Water Feature Extraction and Change Detection Using Multitemporal Landsat Imagery. Remote Sensing., 6, 4173-4189; doi:10.3390/rs6054173. |
| [8] | Lu D, Mausel P, Brondizio E, Moran E. (2004). Change detection techniques. Int J Remote Sens 25:2365–2404 |
| [9] | Masroor Hussain, Dongmei Chen, Angela Cheng, Hui Wei, David Stanley. (2013). Change detection from remotely sensed images: From pixel-based to object-based approaches. ISPRS Journal of Photogrammetry and Remote Sensing 80, 91–106. |
| [10] | McFeeters, S.K. (1996). The use of the normalized difference water index (NDWI) in the delineation of open water features. Int. J. Remote Sens., 17, 1425–1432. |
| [11] | Pol R. Coppin and Marvin E. Bauer. (1996). Change Detection in Forest Ecosystems with Remote Sensing Digital Imagery. Remote Sensing Reviews 13:207-234. |
| [12] | Rouse, J.W.; Haas, R.H.; Schell, J.A.; Deering, D.W. (1973) Monitoring Vegetation Systems in the Great Plains with ERTS (Earth Resources Technology Satellite). In Proceedings of Third Earth Resources Technology Satellite Symposium, Greenbelt, ON, Canada, 10–14 December; Volume SP-351, pp. 309–317. |
| [13] | Shen, L.; Li, C. (2010). Water Body Extraction from Landsat ETM+ Imagery Using Adaboost Algorithm. In Proceedings of 18th International Conference on Geoinformatics, 18–20 June, Beijing, China; pp. 1–4. |
| [14] | Singh, A. (1989). Digital change detection techniques using remotely-sensed data. Int. J. Remote Sens., 10:989-1003. |
| [15] | T. F. Ng, D. H. Jiang, X. Jiag, D. J. Paull and X. H. Wang. (2013). Change detection for sustainability monitoring using satellite remote sensing data. The University of New South Wales at Canberra, Northcott Dr. Campbell, ACT 2600, Australia. |
| [16] | US Geological Survey. Using the USGS Spectral Viewer. Available on http://landsat.usgs.gov/instructions.php [accesses date: August 4, 2015]. |
| [17] | Wilson, E.H.; Sader, S.A. (2002). Detection of forest harvest type using multiple dates of Landsat TM imagery. Remote Sens. Environment. 80, 385–396. |
| [18] | Xu, H. (2006). Modification of normalized difference water index (NDWI) to enhance open water features in remotely sensed imagery. Int. J. Remote Sens., 27, 3025–3033. |