-
Paper Information
- Paper Submission
-
Journal Information
- About This Journal
- Editorial Board
- Current Issue
- Archive
- Author Guidelines
- Contact Us
American Journal of Geographic Information System
p-ISSN: 2163-1131 e-ISSN: 2163-114X
2015; 4(3): 105-120
doi:10.5923/j.ajgis.20150403.03

The Effects of Population Characteristics on Fertility Preferences in Eastern Delta Governorates, Egypt: A GIS Based of Spatial Local Modelling
 Abstract
 Reference
 Full-Text PDF
 Full-text HTML
Shawky Mansour
Department of Geography and GIS, Faculty of Arts, Alexandria University, Alexandria, Al Shatby, Egypt
Correspondence to: Shawky Mansour, Department of Geography and GIS, Faculty of Arts, Alexandria University, Alexandria, Al Shatby, Egypt.
| Email: |  |
Copyright © 2015 Scientific & Academic Publishing. All Rights Reserved.
This work is licensed under the Creative Commons Attribution International License (CC BY).
http://creativecommons.org/licenses/by/4.0/

Socioeconomic characteristics of population such as household wealth status and woman educational levels play a crucial role in fertility preferences. Nevertheless, there is limited research on addressing spatial patterns of fertility preferences in Egypt. Therefore, this paper aimed at modelling spatially the influences of population characteristics on fertility preferences and examining how the relationships between a set of socioeconomic factors and fertility intentions vary across the Eastern Delta Governorates in Egypt (Damietta, Al Dakahlia and Al Sharkia). Using data on fertility and women socioeconomic characteristics from the 2008 Egyptian Demographic and Health Survey (DHS), spatial linkage to census administrative boundary was conducted. Specifically, a Geographically Weighted Regression (GWR) technique was used to identify the variables that are associated with the proportion of women who prefer to have another child. This technique is valuable in investigating local variations of spatial relationships when the response and predictors variables are non-stationary. The results revealed that the effect of population characteristics on fertility preferences is plausibly heterogeneous across the study area. Furthermore, most coefficients covariates on fertility preferences (e.g., wealth classes, education level, number of living children and husband attitudes) had statistically significant spatial variations. The proportion of women with higher education was negatively correlated with fertility desire to childbearing. In contrast, husband attitudes was positively associated with the desire to have more children. The findings of this research provide several noteworthy contributions to understanding local variations of fertility preferences in Egypt specifically on family planning issues and population growth.
Keywords: GIS, Fertility Preferences, Population Characteristics, DHS, GWR, Local Modelling
Cite this paper: Shawky Mansour, The Effects of Population Characteristics on Fertility Preferences in Eastern Delta Governorates, Egypt: A GIS Based of Spatial Local Modelling, American Journal of Geographic Information System, Vol. 4 No. 3, 2015, pp. 105-120. doi: 10.5923/j.ajgis.20150403.03.
Article Outline
1. Introduction
- Family planning programmes have been widely considered as sources of information for population growth particularly in fertility indicators. However, little attention has been given to the attitudes of marriage men for the contraceptive use and fertility preferences (Tuloro et al., 2009). Over the past decade, most research in fertility changes have focused on investigating variations in fertility transition, decline and determination in the developing countries (Shapiro & Gebreselassie, 2013; Bongaarts, 2006; Bongaarts, 2008). Spatial patterns of fertility decline at regional scale have been examined in Eastern African countries (Ezeh et al., 2009). It was found that fertility decline has stalled at the national level in Kenya and Tanzania and the decline trend was strongly associated with woman educational levels. Little research also has been conducted on the factors associated with changes in fertility preferences over time. The changes in fertility timing preferences usually take place because of the shifts in life circumstances especially socioeconomic and demographic variables (Sennott & Yeatman, 2012).To our knowledge, previous research on evaluating and investigating spatial patterns of the impacts of population characteristics on fertility preferences in Egypt is very rare. Yet little attention has been paid to spatial variations of fertility preferences and its determinants at subnational scale. Although several studies have reported various reasons for fertility preferences, the influences of socioeconomic characteristics on fertility preferences could be identified as the strongest explanatory variables at both national and subnational levels. Within subnational administrative boundaries the impacts of socioeconomic factors on reproductive preferences tend to be more consistently inverse in better developed areas (e.g. urban districts) than less developed zones such as rural places. It is more realistic to assume that the impacts of certain variables varies by geographical zone due to spatial reasons. The main objective of this paper is to study the influences of population characteristics on fertility preferences employing global ordinary least squares (OLS) and local Geographically Weighted Regression (GWR) models. Substantive questions raised by this research are whether the woman socioeconomic status influence the decision making for reproductive behaviour? Is the relationship between the desire to childbearing and socioeconomic variables meaningful and significant? Are the associations mentioned above constant or nonstationary across various districts of Eastern Delta Governorates in Egypt? An explicit spatial modelling was adopted to address the effects of population characteristics on fertility preferences in the districts of three governorates of Egypt. Using data on fertility and socioeconomic factors from the Egyptian Demographic and Health Survey (DHS), spatial linkage to census administrative units was conducted. Specifically, the GWR technique was used to identify the variables that are associated with the proportion of women who prefer to have another child. Additionally, examining how the relationships between a set of socioeconomic factors and fertility preferences vary across the study area. That is, while a global regression model (OLS) can identify the associations between explanatory variables and dependent variable, this technique generate a single equation and regression coefficient to all parts of the study area. GWR, however is a local model that can identify whether or not the associations between fertility preferences as a dependent variable and socioeconomic factors as predictors vary locally across different districts of Eastern Delta governorates
2. Related Work
- The debate on the determinants of fertility decline has been clearly addressed by (Hakim, 2003). He argues that in the absence of any guidance theory on childbearing in woman life, there are different perspectives work as the norms of the fertility decline theories. Firstly, demographers justify the changes in fertility rates essentially as a result of changes happened in the nuclear family structures. On the other hand, economists claim that industrialization, urbanization and economic status of women have recently influenced woman desire on large family size. Another theory introduced by sociologist suggests that the ideological and cultural factors are considered strong predictors of fertility decline. An important contribution to the debate of Fertility preferences was introduced by (Hener, 2010). He argues that couple heterogeneity or homogeneity about the number of children they want and child benefit allowance both affect the demand for children. Thus, child poverty and household wealth are ultimately associated with fertility preferences. Several studies have addressed spatial variations of fertility decline using mapping techniques (e.g. Bocquet-Appel et al., 2002; Lesthaeghe & Neels, 2002; Lesthaeghe & Neidert, 2006). However, these previously efforts to map fertility transitions have not conducted the analysis due to smaller spatial units (Potter et al., 2010). Schmertmann et al., (2008) found that spatial patterns in Brazilian fertility change are strongly associated to measurable local sociodemographic conditions such as electrification, child mortality, and female education. Various indicators have been used to investigate fertility preferences in particular the effectiveness of ideal family size and desire for an additional children (Roy et al., 2008). Although evolutional theory indicates a positive relationship between wealth and fertility, household wealth classes and fertility declines are reported as they are negatively correlated (Gurmu & Mace, 2008).The stopping rules of producing children have been discussed by Yamaguchi, (1989). These rules assume that couples continue childbearing until they reach their desired number of sons. Consequently, there is no any limit on the maximum number of wanted children in the attempt to attain the target number of sons. However, this model fails to avoid the simplification when the wanted number of children can increase without bounds (Basu & Jong, 2010). In spite of the reported achievement recently of fertility declines in East Asian countries, demographers argued that son preference in Asian countries is a major barrier to reducing fertility (Park & Cho, 1995). Chowdhury et al., (1993) pointed out that gender composition of living children was strongly correlated with fertility preferences. For instances, the higher number of sons is associated with a higher percentage of women wanting no more children. Son preference remains a guiding characteristic of reproductive behaviour in many developing countries. Such this attitude leads to higher fertility since the parents of daughters tried to produce one or more sons (Brunson, 2010). An empirical analysis on son targeting fertility behaviour (Basu & Jong, 2010) revealed that couples who target sons are more likely to have larger number of children. In addition, spatial location and income of households strongly influence son targeting.In most Arab countries, the fertility preference is influenced by number of living children and more strongly the number of living sons. Previous research that published on the effects of son preference on fertility proposed that higher levels of female educations do not necessarily lead to decline in son preference (Murthi et al., 1995). The issue of gender bias in most developing countries has a significant impact on preferring male births. It is hypothesized that woman desire for sons often influences fertility preference where sons are considered more valuable than daughters. Thus, women with a small number or low proportion of sons are more likely than other women to continue childbearing (Chaudhuri, 2012). This norm of son preference appears to be supported by the fact that the proportion of living sons in a family influences the probability that the woman will continue childbearing (Clark, 2000). Gadalla et al., (1985) examined the impacts of number of living sons on contraceptive use in rural of Menoufia governorate in Northern Egypt. The findings of this research indicated that women with higher number of living sons were more likely to be using contraceptive methods. On contrast, women with no sons or have only one son are expected to be less receptive to family planning programmes. The effects of gender preference on contraceptive use in rural of Menoufia governorate were also examined and the results indicated that the attitudes towards son preference in 1979 remained constant in 1991 (Yount et al., 2000).
3. Data and Materials
3.1. Study Area
- The study area includes three governorates: Al Dakahlia, Damietta and Al Sharkia and they are located in eastern Nile Delta (Figure 1). Al Dakahlia governorate is divided into 18 districts and has population about 6 million inhabitants in 2015 (5.949 million). The area size of the governorate is 3906 km². Al Sharkia governorate is divided into 22 districts and has the largest population number which is almost 6.5 million and its total area is 5331.5 km². Damietta is considered the smallest governorate in area and population. The governorate is divided into 9 districts and has 1.33 million and its total area size is 862.7 km².
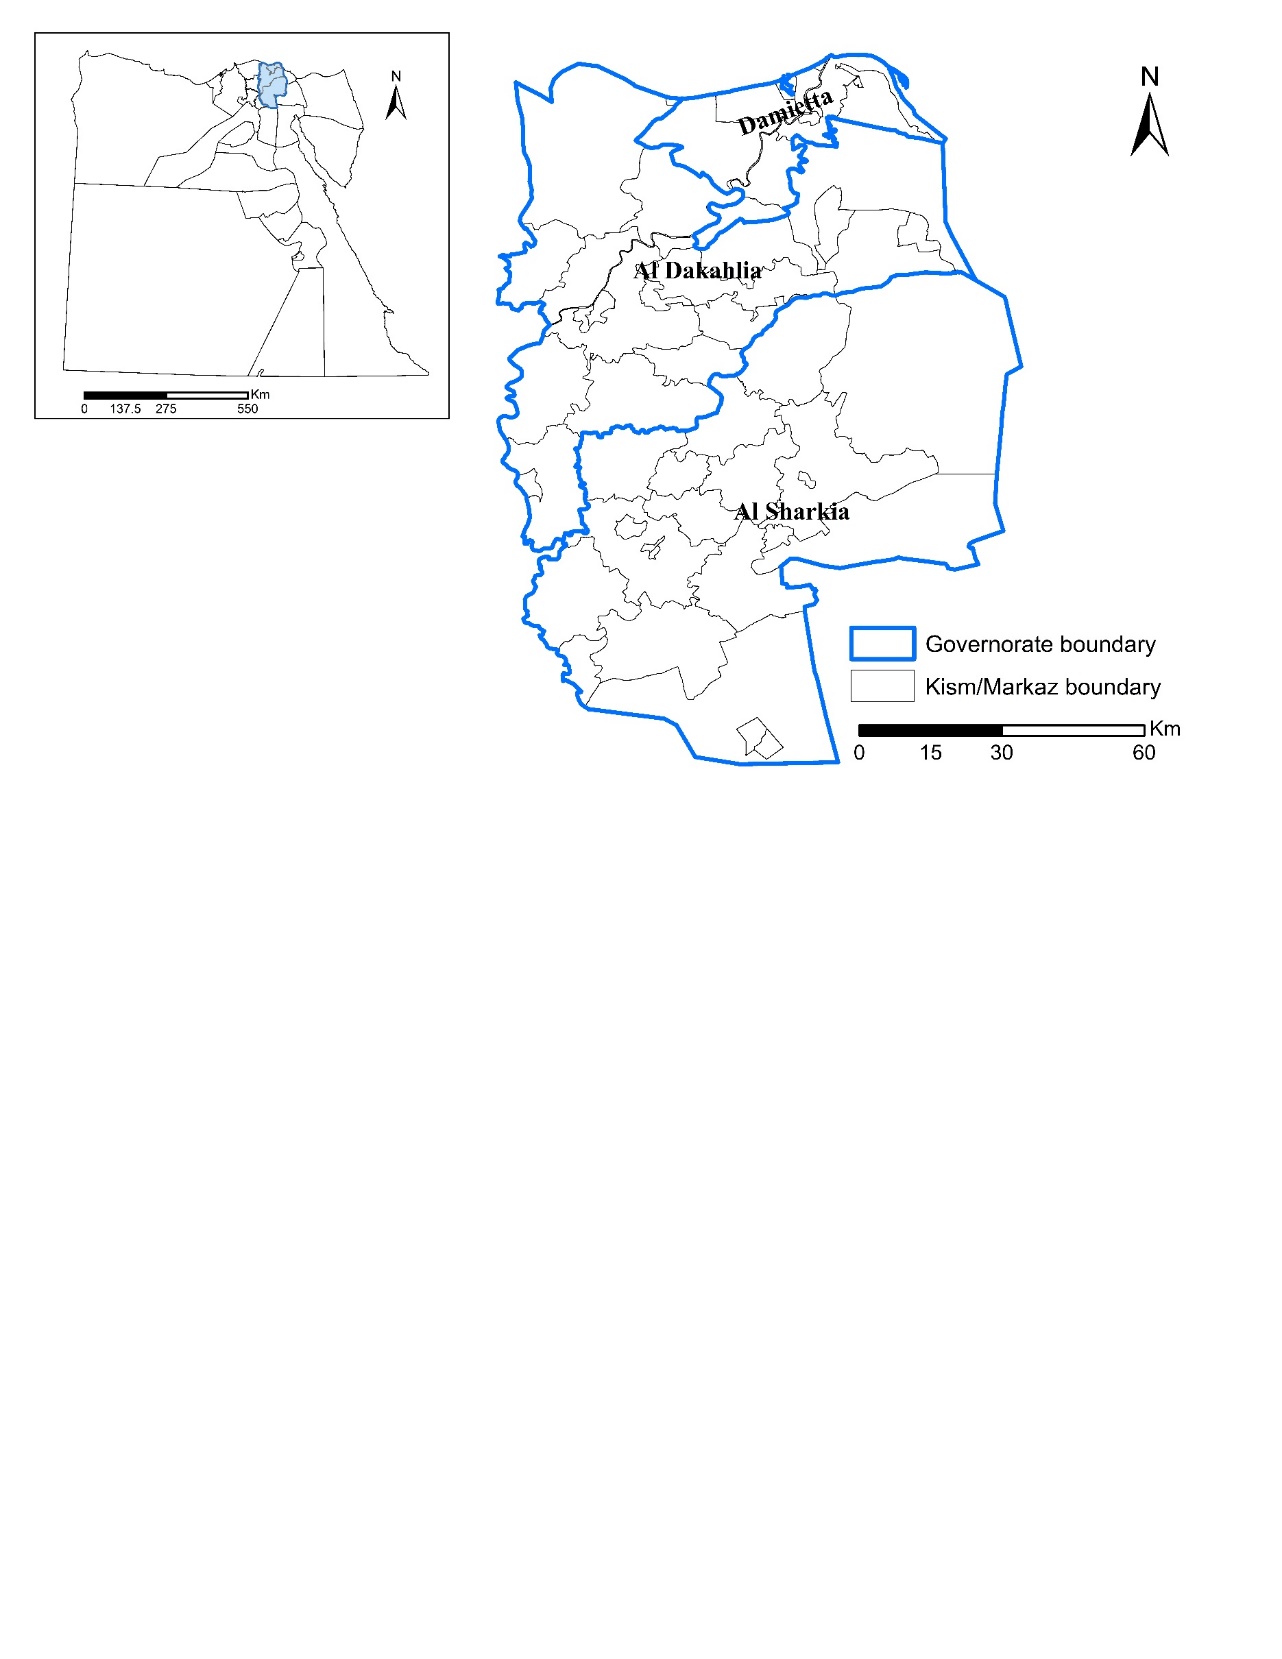 | Figure 1. Map of study area location |
3.2. Datasets
- The Demographic and Health Survey (DHS) is a geo-referencing population survey and is conducted in almost 84 developing countries. One of the most important benefits of the DHS is that researchers can analysis the socioeconomic and demographic datasets spatially to investigate and examine geographic patterns of various phenomena. The DHS survey collects geographical coordinates of the survey clusters using Global Positioning System (GPS). The GPS location is not taken for individual household but it is an estimation of the centroid of the whole cluster. The cluster size varies greatly and ranges from one single apartment in an urban area to five kilometres in rural areas. In order to protect the respondent’s confidentiality, the survey applies geographic displacement procedures as follows:• The data from the same enumeration area (governorate) are aggregated to a single coordinate point. • Carrying out a displacement process for the GPS clusters where urban cluster is displaced randomly a distance up to 2 kilometres. Rural cluster is displaced up to five kilometres. A further 1% of rural GPS clusters is selected and then displaced up to 10 kilometres (DHS, a2015).Within GIS environment, conducting a spatial linkage between GPS clusters and national administrative boundaries is possible. However, choosing the appropriate geographic level for the GIS linkage is a matter because of the resultant displacement of the mentioned process. Consequently and considering spatial uncertainties of GPS points being in another geographic zone, linking the GPS clusters to Kism/markaz geographic boundary (district) is suitable (Mansour et al., 2011). The attribute data used in this study are extracted from the 2008 Egyptian (DHS) file. The DHS obtained information on fertility preferences and reproductive intentions by asking non-sterilized currently married women many questions. Household wealth index was also obtained from the survey where each household belongs to one class out of five wealth quantiles. The DHS survey calculates the index using principle components analysis and variables of household ownerships and housing construction (DHS, b2015). The selected variables of fertility preference and socioeconomic characteristics were aggregated to the GPS clusters and linked to Kism and Markaz (sub-provincial unit) administrative boundaries. Both layers the GPS clusters and the administrative boundary were projected to the same coordinate system (WGS 1984 UTM Zone 36).
3.2.1. The Dependent Variable
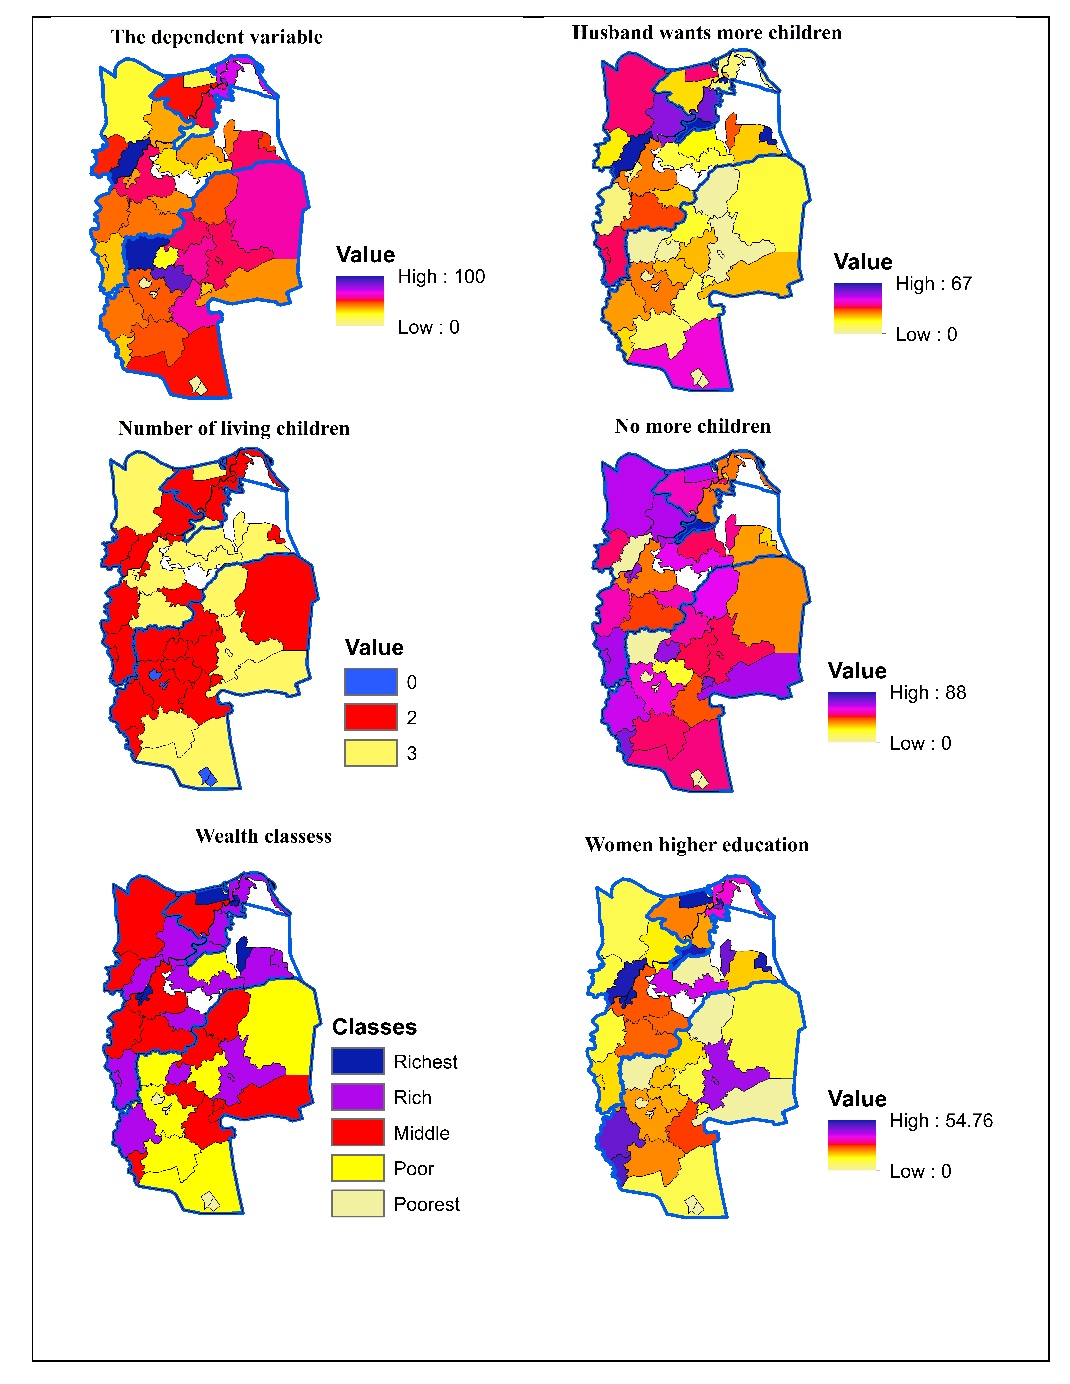
- The data used in this analysis is a secondary data computed from the 2008 Egyptian DHS. In the DHS survey, women were asked a question about their desire to have another child. The percentage of interviewed women who desire to have another child is used as a dependent variable. Figure 2 shows the geographic distribution of the dependent variable across the three governorates. Higher percentages is depicted in Al Sharkia governorate in particular eastern and southern parts and mainly in rural districts. On the other hand, lower percentage of desire fertility can be seen in Damietta governorate and the northern part of Al Dakahlia governorate. The administrative units with small area size often are urban areas and these illustrate a spatial pattern of lower percentage of wanted fertility.
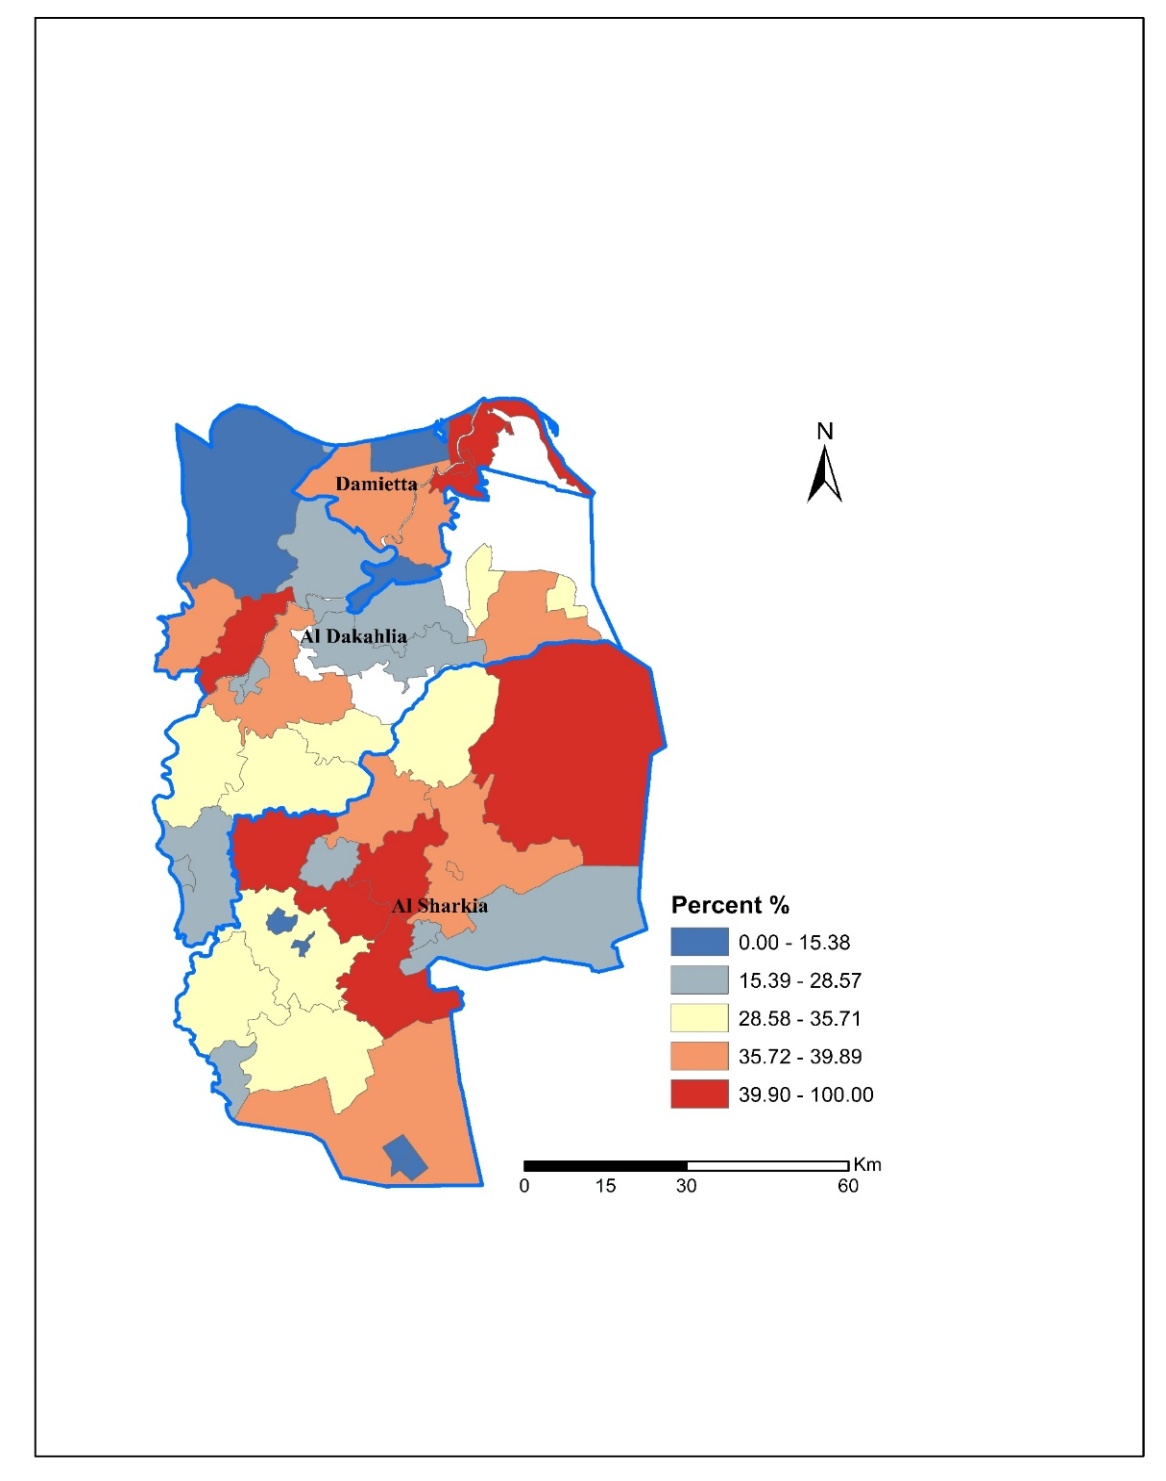 | Figure 2. The spatial distribution of the dependent variable across Eastern Delta governorates |
3.2.2. The Independent Variables
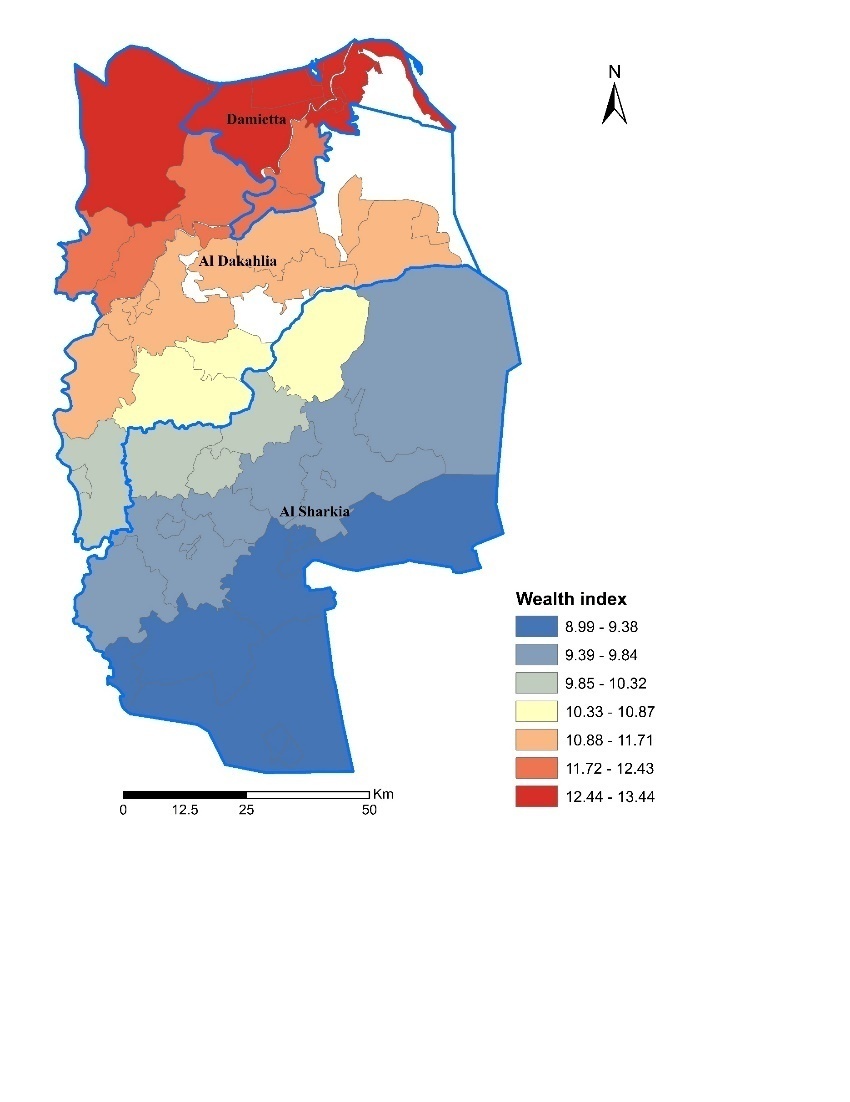
- Husband desire to fertility productive Reporting husband desire to have more children is one measure of fertility productive. This variable was computed as a continuous variable and expressed as the proportion of women whose husband wants more children. Looking at the spatial distribution of this variable, it clearly seems that higher proportion in Al Dakahlia governorate particularly in the northern parts. Similarly, the northern parts of Damietta and Al Sharkia governorates. In contrast, the proportion of husband desire to more children tend to be lower in most of Al Sharkia governorate and districts of Al Dakahlia that are located in the east.Number of living childrenThe number of living children is one of the most important variables impacting women fertility preference. For instance, using contraceptive methods by married women is strongly associated with the number of living children they have. Thus, measuring the desire for more children according to number of living children is considered a robust predictor for women fertility preferences. This variable was computed and included in the analysis as a discrete variable. The spatial distribution of this variable varies among districts of the three governorates. Most districts show women with two or three children and most of them living in rural areas. Unlike, small number of districts illustrate married women with one child or no living children and those district are most often urban areas. No more children This variable expresses woman desire to stop childbearing and it was computed as a continuous variable in the form of the proportion of currently married women who want no more children. The geographic distribution of this variable across the three governorates demonstrates that districts of higher proportion of women who wants to stop childbearing are located in the southern parts of Al Sharkia governorate. Likely, districts that are located in the northern part of Al Dakahlia and Damietta governorates. Lower proportion of women who want stop childbearing can be seen in some districts in western parts of Al Sharkia and Al Dakahlia governorates. Wealth indexWealth index variable was selected from the DHS as a measure of household living standard and it is considered an important indicator in predicting various household variables especially public health, wellbeing, and other population characteristics. In addition, the wealth index could be a valuable measure in the most of developing countries where there is a lack of attribute and spatial data on household socioeconomic status (DHS, b2015). The wealth index statistically classifies all households into five wealth quintiles ranging from richest to poorest. The spatial distribution of wealth index across districts of the three governorates shows that the richest households are located in urban areas (small size polygons) in Al Dakahlia and Damietta governorates while the poorest household fundamentally are located in rural districts of Al Sharkia governorate. Household who belong to middle class tend to be distributed among the three governorate and in both urban and rural districts.Level of higher education Woman education has been recognized as a crucial variable influencing childbearing and fertility desire. No doubt that there is a strong evidence that higher level of woman schooling is associated with fertility decline (Martin, 1995; Duflo et al., 2010). This variable was computed as a continuous variable since it express the proportion of women who finished higher level of education. Looking at the distribution of women with higher education across districts of the three governorates, the districts with high proportion tend to be located in Damietta governorate, western part of Al Dakahlia and middle part of Al Sharkia. Rural districts tend to show lower proportion of women with higher education in most of Al Sharkia districts and districts of Al Dakahlia governorate that are located in western and northern parts.
4. Methods of Analysis
4.1. Spatial Linkage
- In the absence of attribute data on fertility preferences in the Egyptian census, data from the 2008 Egyptian DHS were used for this research analysis. GIS linkage process was conducted using both Statistical Package for Social Science (SPSS) and ArcGIS 10.2 software. The process involves linking statistical variables of DHS to GPS clusters followed by applying spatial join, within GIS overlay process, to link the GPS coordinates to the Egyptian sub-administrative boundaries of Eastern Delta governorates (Kism/Markaz level). The resultant of this process is one database file where each cluster number falls within a specific administrative unit. SPSS was used to link this file to the attribute DHS variable and aggregation tool based on Kism/Markaz names was applied to obtain the database file which contains household clusters in each administrative unit for modelling analysis.
4.2. Ordinary Least Squares (OLS) Model
- Ordinary least squares OLS regression is a statistical technique that uses sample data to estimate the true population relationship between one dependent variable and one or more independent variables. In this technique, the main focus is the explanation of the dependent variable y as a function of one or multiple of independent variables (x1, x2…). OLS technique is a global model used specifically to examine the relationship between the dependent variable and different set of explanatory variables based upon a single equation. Moreover, the model spatially assumes a stationary relationship over the study area. Thus, a single coefficient is estimated and implying over all parts of the study area (Fox, 1997; Ryan, 2008). In this research, the relationship between a dependent variable (fertility preference of having another children) as a response variable y is predicted by various explanatory variables (x1, x2, x3…….). Therefore, the OLS global model can be written as:

 Where:
 = the response variable
  = set of independent variables
  = the intercept
 = the parameter estimate of independent variable one
 = the standard error Based on this equation, the intercept
  indicates y value when it equals zero while
  indicates the slope of the line and represents the regression coefficient which describes the changes in the dependent variable y when x changes in one unit.
 4.3. Geographically Weighted Regression (GWR)
- Geographically Weighted Regression (GWR) technique is a nonparametric spatial model and nonstationary regression which assumes non-static relationship between a response variable and one or more independent variables. The GWR takes the coordinates of geographic locations to a normal regression model and applies a spatial weighting of each regression coefficient to express the spatial variability over the study area. (Brunsdon et al.1998; Charlton et al., 2009; Fotheringham et al., 2003). Therefore, GWR allows regression coefficients to vary and generates a single equation for each spatial unit within the study area. The model calibrates each spatial unit using the target one i and its nearest neighbours. The calibration follows Tobler’s (1970) first law of geography where higher weight assigns to the nearby locations based on their proximity to the target location i. this weighting indicates the fact that closer locations have more influences on the calibration than location that are further away. The GWR equation is written as follows:

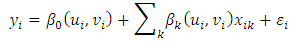 Where:β (ui,vi) depicts the vector of the location-specific parameter estimates.(ui,vi) denotes the coordinates of geographic location i in space.βk (ui,vi) indicate a realization of the continuous surface at point i which is a continuous surface of parameter values. GWR is a powerful technique in explaining spatial heterogeneity. The geographically weighted regression extension in the spatial statistics toolbox of ArcGIS 10.2 was used to perform the modelling process. The same dependent variable and explanatory variables of the global OLS model were used as data input of the model.
5. Results
5.1. The Global OLS Modelling
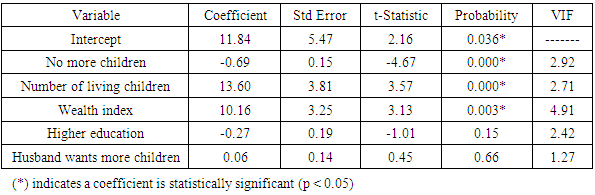
- Determining the most effective variables to be included in a model is essential and a critical step in fitting the model. Accordingly, the first step was to select the appropriate combination of independent variables as predictors for fertility preferences. To achieve this target, the exploratory regression tool in ArcGIS 10.2 was used to evaluate all possible combination of candidate independent variables. The finding of this process revealed that five explanatory variables out of ten were the best combination to construct a regression model (Figure 3).
 | Figure 3. The selected five independent variables as the best combination of model predictors |
|
|
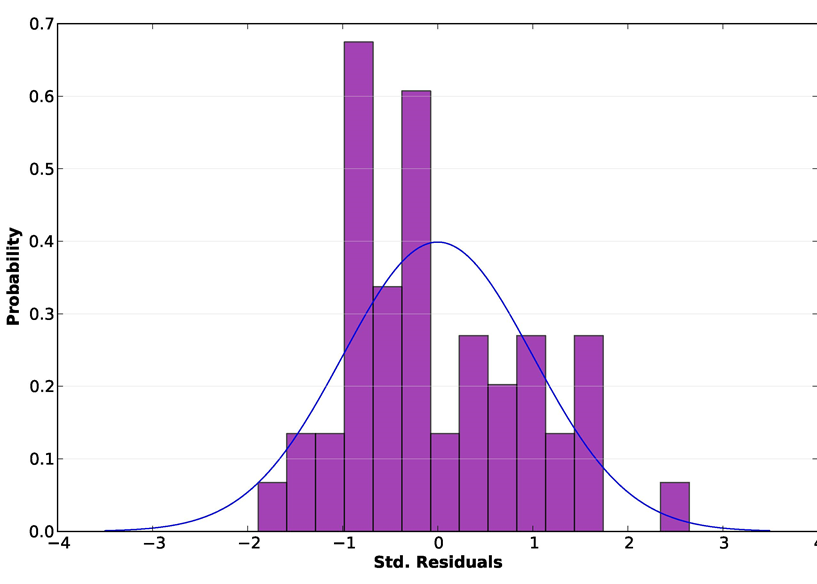 | Figure 4. The distribution of the OLS model residuals |
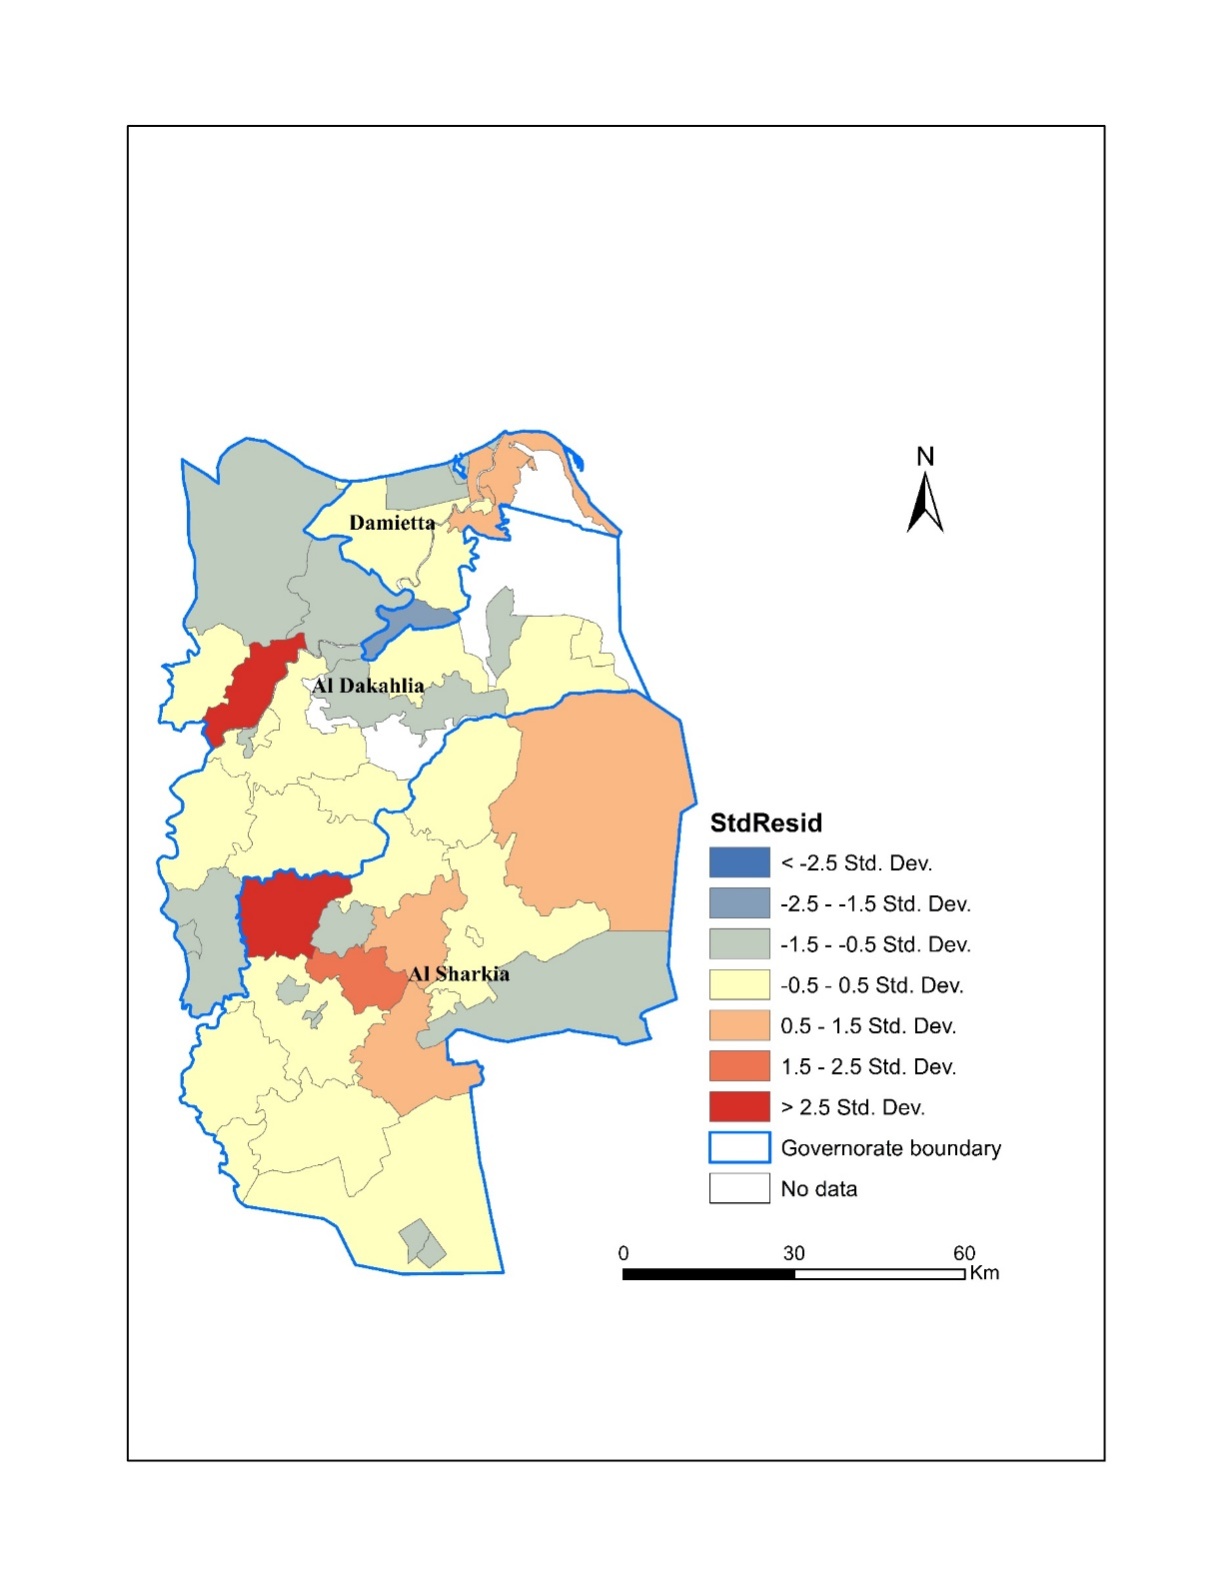 | Figure 5. The spatial distribution of the OLS model residuals across Eastern Delta governorates |
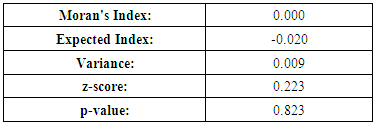
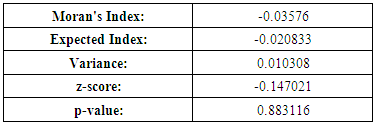
 | Figure 6. The spatial autocorrelation pattern of the OLS residuals |
|
5.2. The Local GWR Modelling
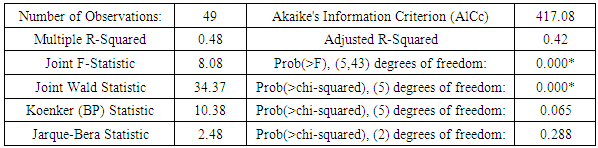
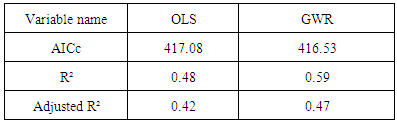
- Table 4 illustrates a comparison between the outputs of both OLS and GWR models. The AIC value declined from 417 in the OLS to 416.5 in the GWR and this indicates an improvement in the local modelling. Moreover, the value of adjusted R² improved as well and increased from 0.42 in the OLS to 0.47 in the GWR model. Therefore, the GWR model accounts for 47 percent of the variations in location of fertility desire in districts of the three governorates. These outputs revealed that the model significant and performance notably is better using local modeling instead of global one.
|
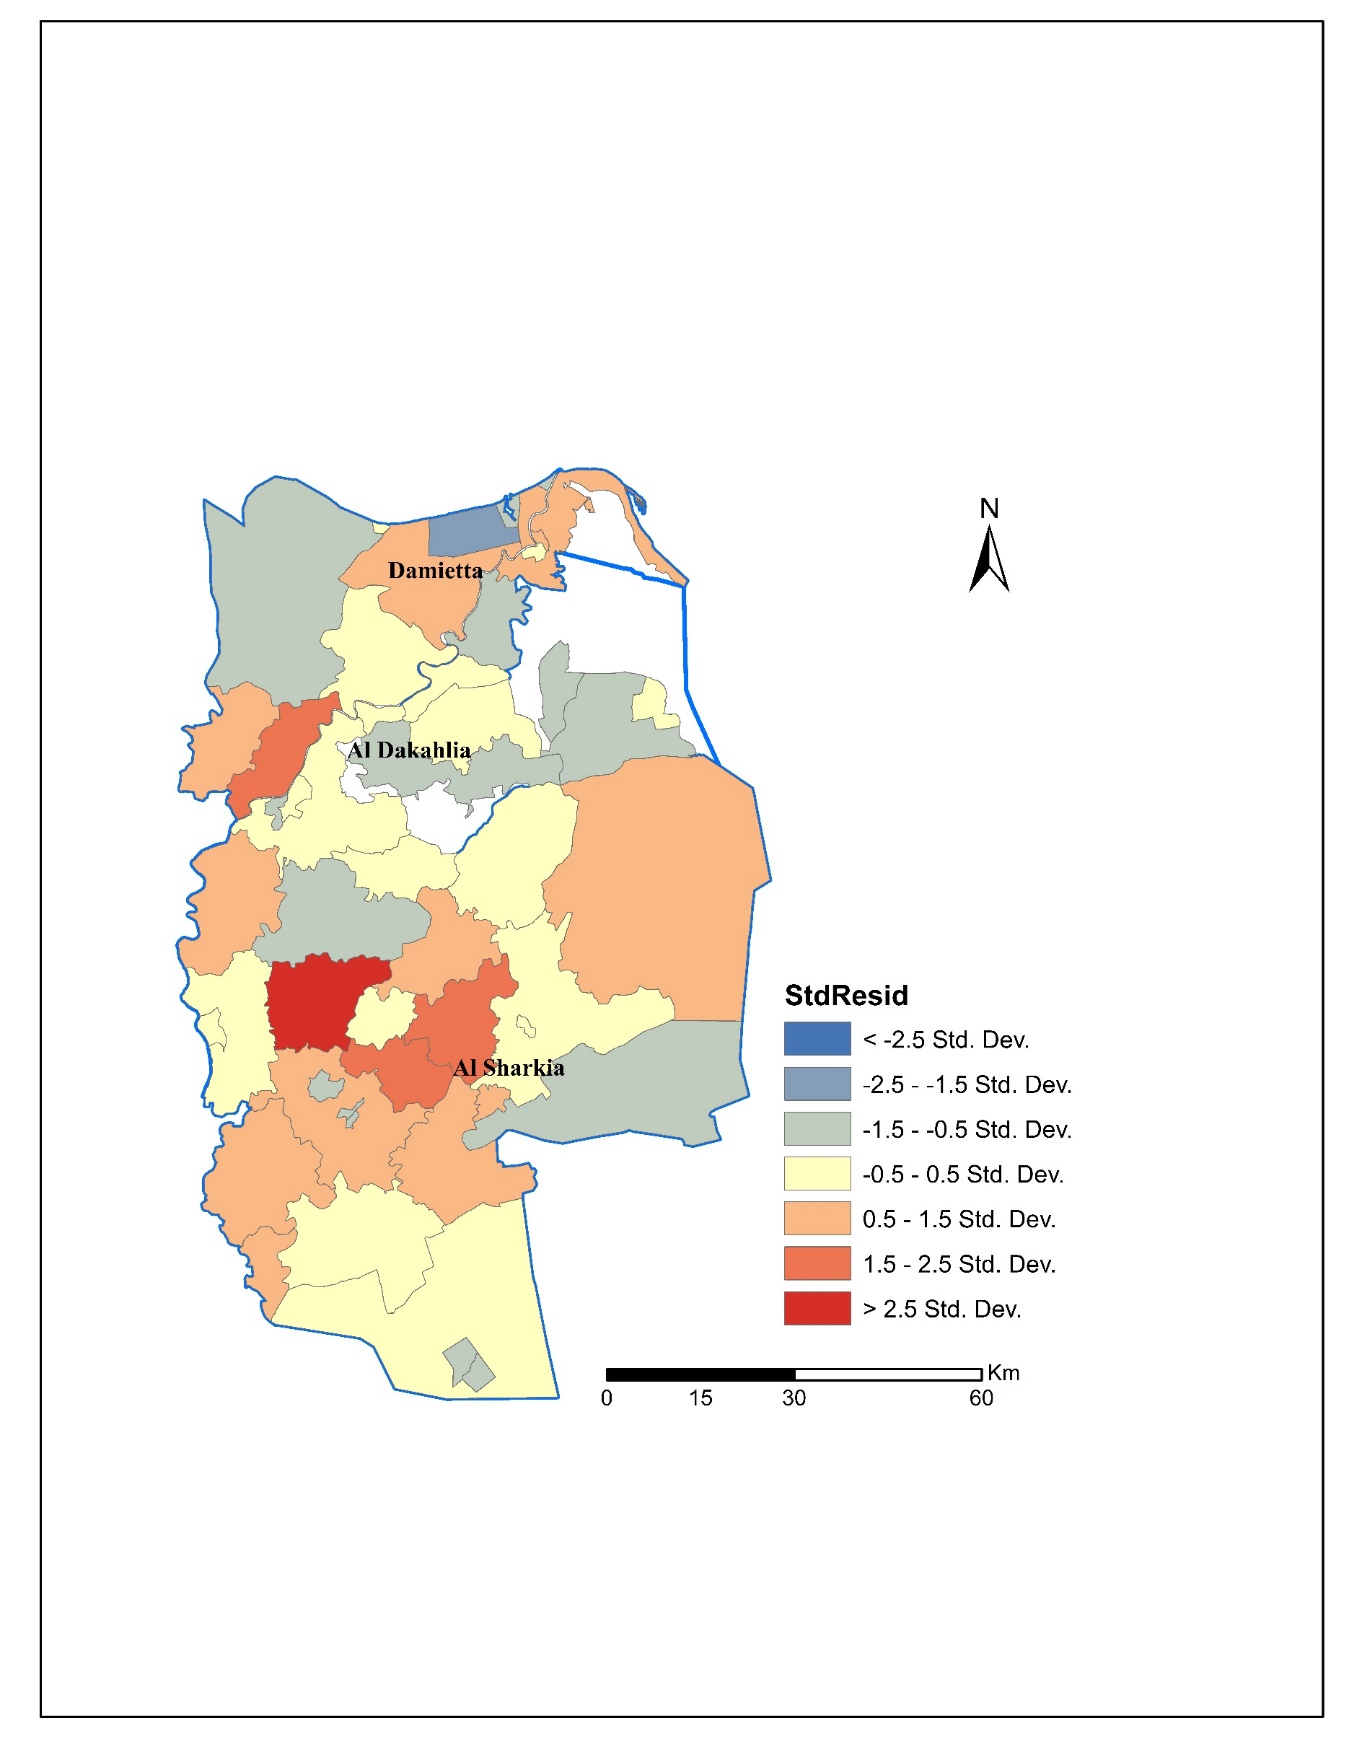 | Figure 7. The spatial distribution of the GWR model residuals across Eastern Delta governorates |
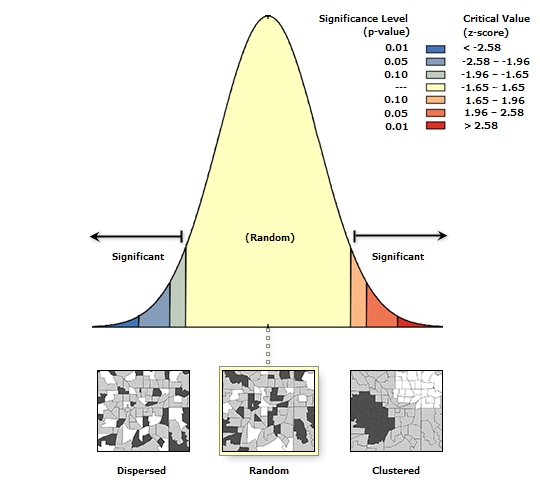 | Figure 8. The spatial autocorrelation pattern of the GWR residuals |
|
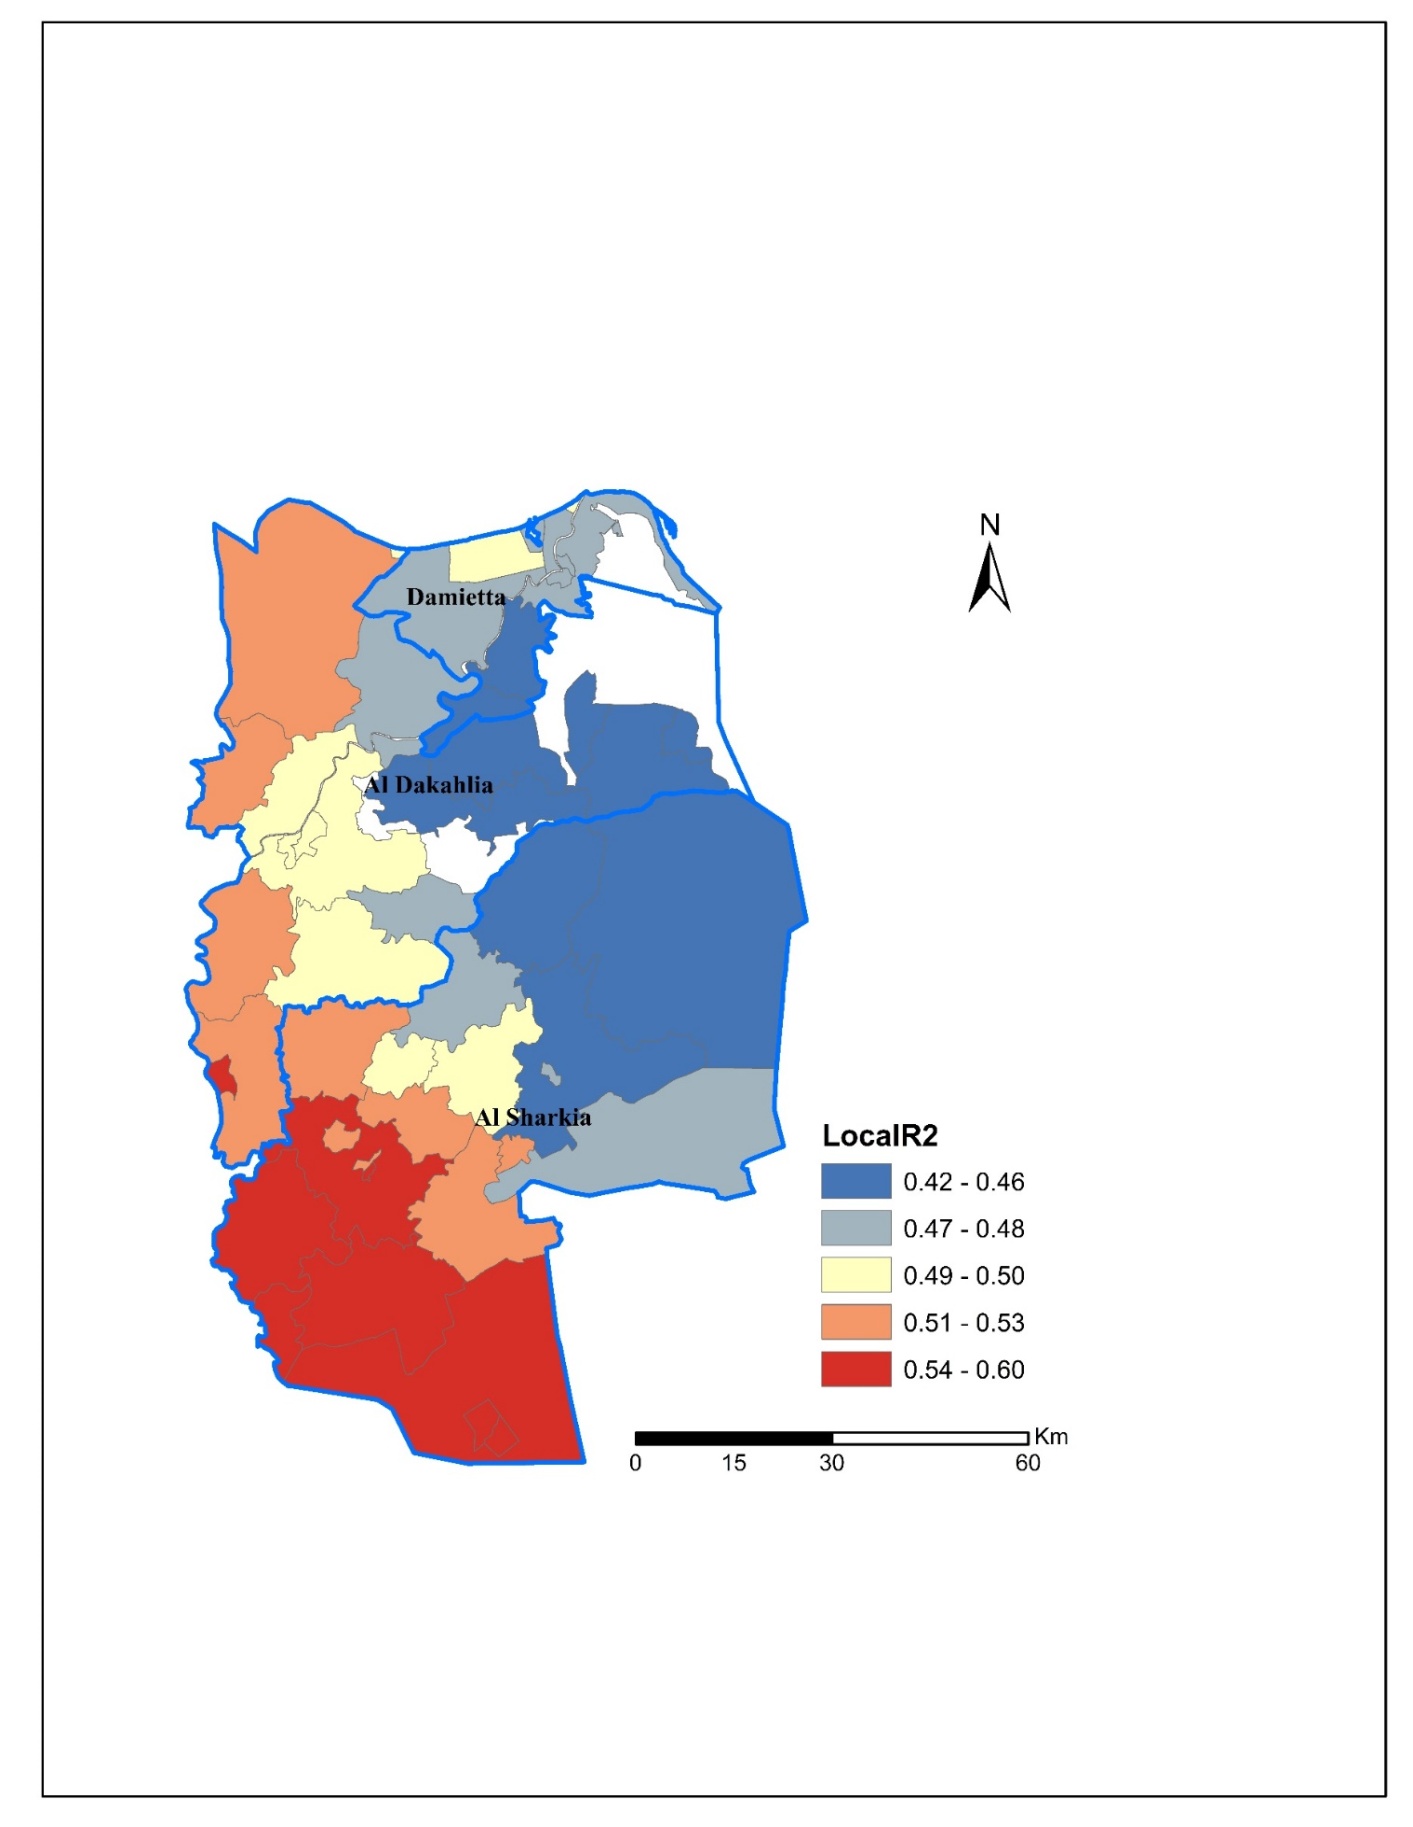 | Figure 9. The distribution of spatial smoothing of the GWR local R² |
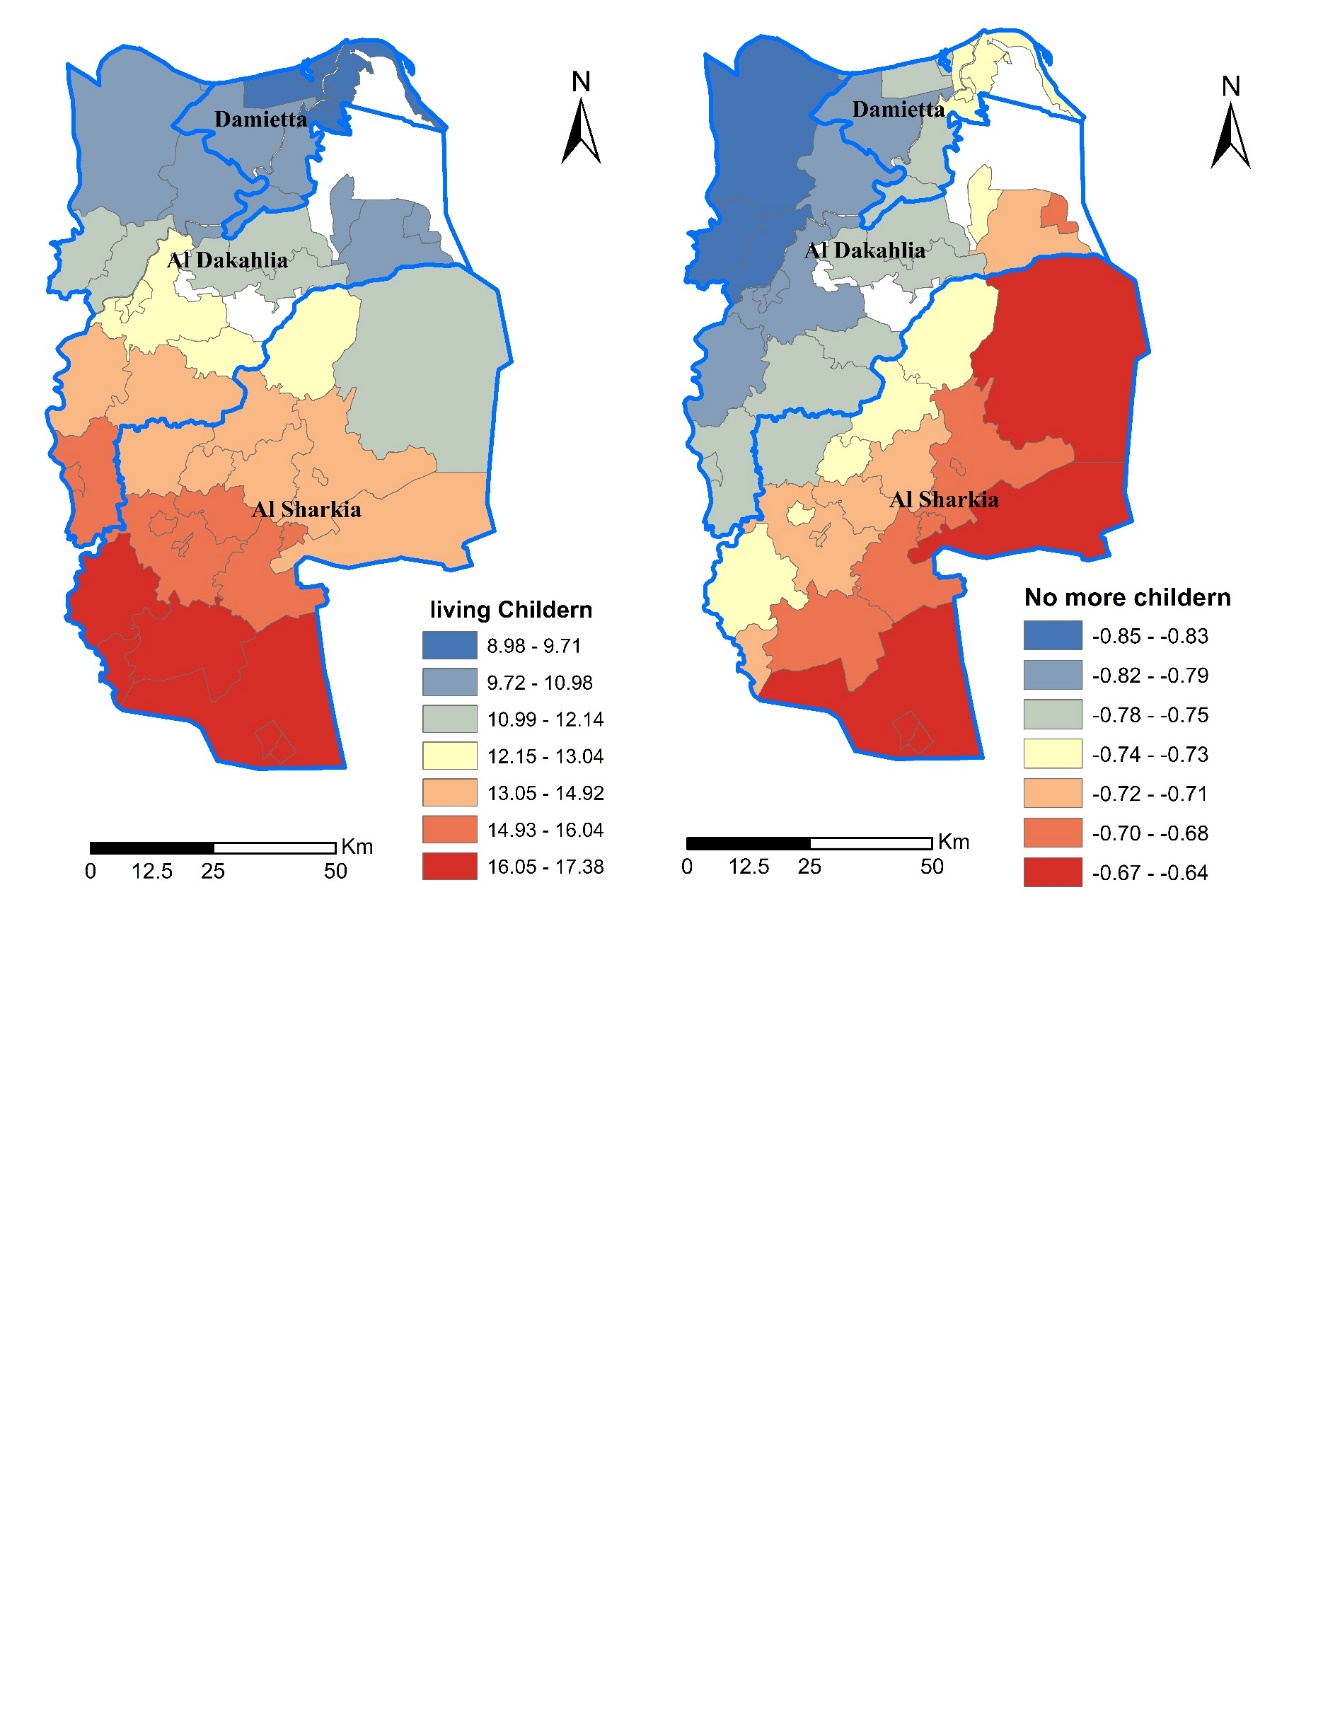 | Figure 10. The local coefficient estimates from the GWR model of number of living children and desire to stop childbearing variables |
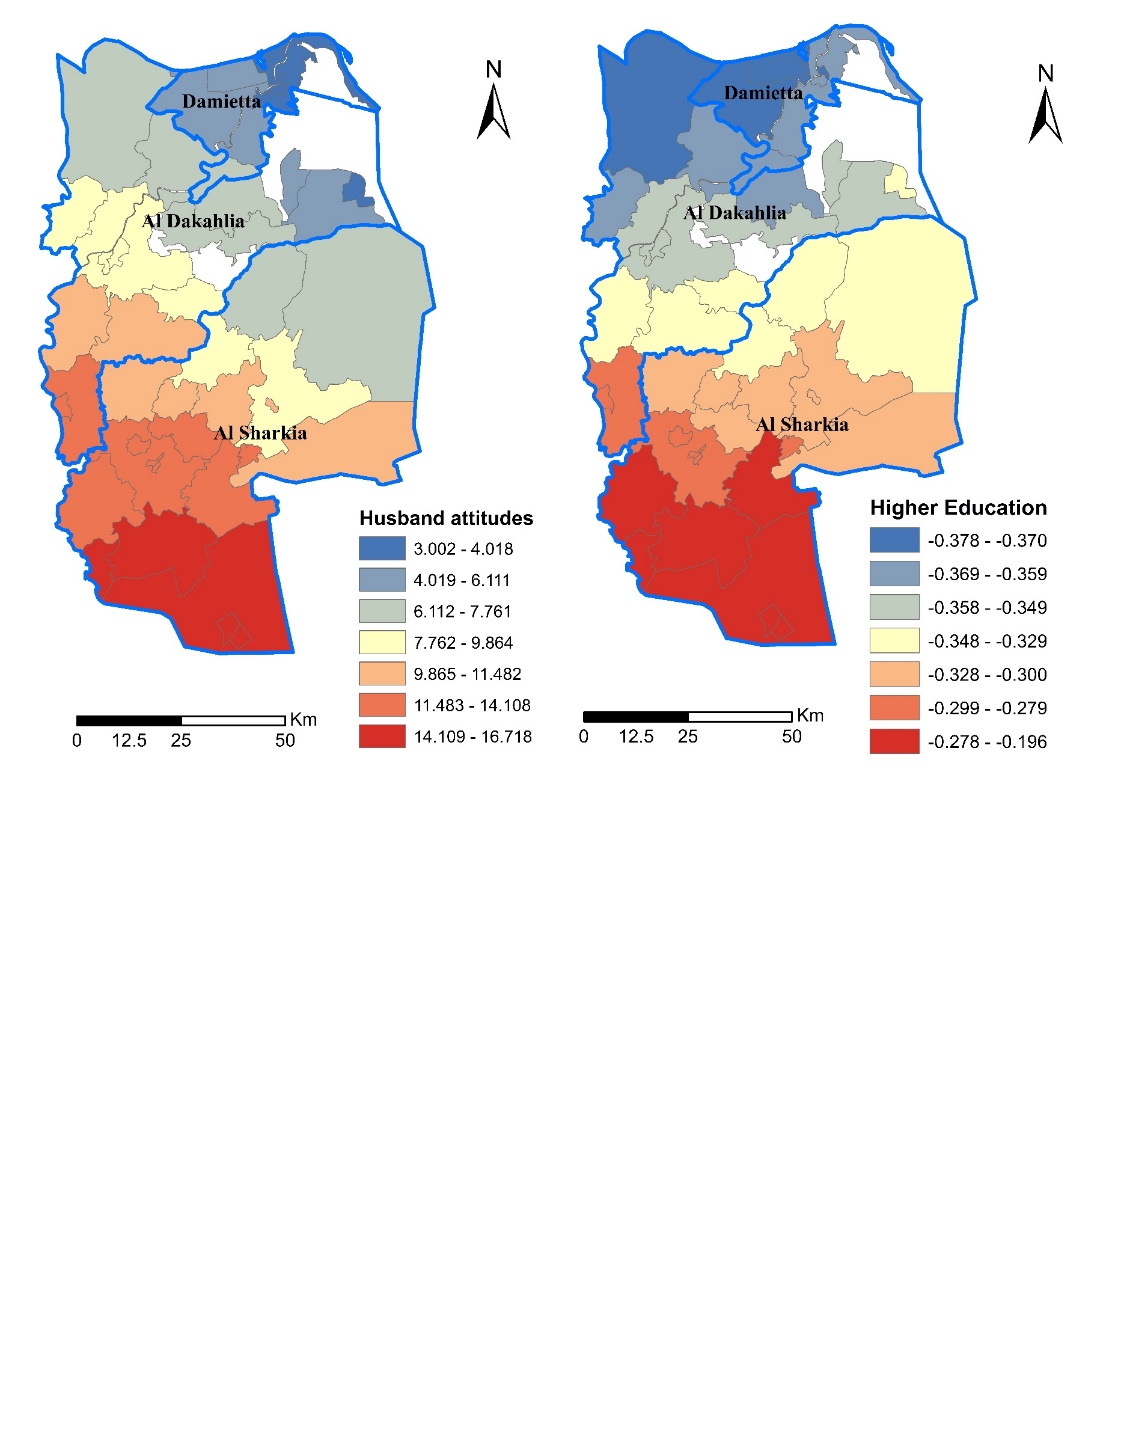 | Figure 11. The local coefficient estimates from the GWR model of husband desire for more children and woman education |
 | Figure 12. The local coefficient estimates from the GWR model of wealth index |
6. Discussion
- This research focuses on geographic patterns of fertility preferences and women reproductive behaviors across Eastern Delta governorates in Egypt. The analysis investigated not only spatial variations of fertility desire but also the subnational differences of the relationships between influential variables and women fertility desire to childbearing. The effects of population characteristics on fertility preferences is plausibly heterogeneous across the study area for several reasons: (i) social characteristics, such as woman education; (ii) wealth classes, such as poor household versus rich; (iii) the husband role on reproductive decision making by which the desire to more children is affected (iv) the number of living children particularly sons versus daughters and (v) the spatial effects, such as urban versus rural or spatial autocorrelation.According to the comparison between the outputs of the global (OLS) and local (GWR) models, the estimation by the GWR that allows for spatial non-stationary was better in explaining the influences of socioeconomic characteristics of population on fertility preferences. The geographic distribution of the R² values of the local model indicated that the districts that are located on southern and western parts of the governorates illustrated higher values. This suggests that the selected independent variables contribute significantly to understanding the spatial variations of fertility desire across that region. In addition, the spatial direction of the independent variables influence is south-north direction except for the wealth index variable which takes an opposite direction. The findings of this research are generally consistent with previous studies in some relevant questions about fertility preferences in the developing countries. Substantially, there is an agreement in terms of the increasing desire among women for more children. For instance, although there has been an increasing rate of using contraceptive methods among women, there is a shift towards large family desire particularly among Muslim communities (Westoff & Cross, 2006). Another important finding was that the proportion of women with higher education was negatively correlated with fertility desire to childbearing. This result further contributes to the crucial assumption that household socioeconomic characteristics especially education is widely held to be a key determinant of fertility preferences. This finding has also important implications for developing national policies on human development as a key factor for family planning programmes and fertility declines.Contrary to expectations, however, the wealth index variable has a significant positive influence on fertility desire for childbearing particularly in the districts of Damietta and Al Dakahlia governorates. These findings seem to be inconsistent with other studies that examined the relationship between wealth and fertility. For example, lower fertility rate was significantly associated with women in richest wealth index quantile (Weerasinghe & Parr, 2002). Higher fertility rate was observed among women in the poorest quantile of the wealth index. This higher rate also was correlated with lower use of contraceptive methods among women in the same quantile while the proportion of women using contraceptive methods was higher in the richest quantile (Adebowale et al., 2014). A possible explanation of this inconsistently of the wealth index influence on fertility desire might be the impacts of household economic-cultural and religion factors on the desire for large family. It has been assumed that, due to traditional values of religion, higher household income encourages having more children since the cost of child is not a barrier. In most Muslim communities, higher level of couple economic prosperity leads to higher demand for more children among women and often polygamy among men (Izugbara & Ezeh, 2010).In this analysis, the impacts of socioeconomic characteristics of population on fertility preferences has been identified as strong explanatory variables of woman reproductive intentions. Overall, this study strengthens the idea that geographic differences of population characteristics play a potential role on examining spatial variations of fertility. However, further research, which take additional factors either from census or surveys or combination between both into account, will need to be undertaken. Ideally, such these studies need to be focused on investigating the complex relationships between fertility preferences and other predictors based on subnational geographic zones.
7. Conclusions
- The main goal of this paper was to determine the impacts of population characteristics on fertility preferences and examining whether these effects vary across the districts of Eastern Delta governorates because of their spatial settings. The total variance explained by the GWR model ranges from 0.42 to 0.60 percent while the variance explained by the OLS model was only 48 percent. One of the valuable output of GWR model is the ability to mapping local R² values. This map offers a great benefit to know the areas where the model could be improved using additional covariates. Overall, the local model fit the data well particularly in the districts that are located in southern and western parts of study area. Not surprisingly, in most of these areas the associations between woman desire to childbearing and various socioeconomic factors were significant. The analytical method presented in this paper offers a generic avenue for addressing the effects of population socioeconomic characteristics on fertility preferences. Applying a local modeling to examine the spatial variations of fertility indicators provides a potential opportunity to explore the association between fertility and various covariates at subnational geographic level and small areas. The findings of this research have principal implications for understanding local variations of fertility preferences in Egypt. They are important for population policies specifically for family planning programmes. Health and population policymakers can use the spatial distribution of fertility preferences to identify clustered areas above or below expectations. Fundamentally, districts with higher than expected proportion of fertility preferences could be targeted for future interventions. This is can be achieved through highlighting determinants of decreasing son preference particularly cultural and custom beliefs.