-
Paper Information
- Paper Submission
-
Journal Information
- About This Journal
- Editorial Board
- Current Issue
- Archive
- Author Guidelines
- Contact Us
American Journal of Geographic Information System
p-ISSN: 2163-1131 e-ISSN: 2163-114X
2015; 4(3): 95-104
doi:10.5923/j.ajgis.20150403.02
Land Suitability Analysis for Rice Production: A GIS Based Multi-Criteria Decision Approach
 Abstract
 Reference
 Full-Text PDF
 Full-text HTML
Getachew T. Ayehu1, 2, 3, Solomon A. Besufekad4
1Earth Observation Research Group, Entoto Observatory & Research Center, Addis Ababa, Ethiopia
2Geosptial Data and Technology Center, Bahir Dar University, Bahir Dar, Ethiopia
3Institute of Land Administration, Bahir Dar University, Bahir Dar, Ethiopia
4Department of Computer Science, Addis Ababa University, Addis Ababa, Ethiopia
Correspondence to: Getachew T. Ayehu, Earth Observation Research Group, Entoto Observatory & Research Center, Addis Ababa, Ethiopia.
| Email: |  |
Copyright © 2015 Scientific & Academic Publishing. All Rights Reserved.
This study focused on land suitability analysis to identify permissible areas suitable for rice crop production in west central highlands of Amhara Region, Ethiopia. The research applied GIS-based Multi-Criteria Decision Approach. Soil, climatic conditions, and topography were a criteria identified as necessary for the intended application. An Analytical Hierarchical Process (AHP) was used to rank the various suitability factors and the resulting weights were used to construct the suitability map layers using weighted sum overlay tool in ArcGIS 10.1 platforms. Then, the suitability map for rice crop production in the study area was formed. Accordingly, more than 70% of the total study area were found to be highly and modereately suitable for rice crop production. The relationship between suitability map and current vegetation cover of the study area has also been computed and the result predicts the inverse relationship between the density of vegetation cover and rice land suitability. Overall, the results indicate that the study area has a huge potential for rice production. Therefore, economic levels of agricultural production can be achieved by cultivating rice crop in highly and moderately suitable areas, and practicing diversification of marginally suitable areas to crops other than rice.
Keywords: Rain fed rice, Land suitability, AHP, MCDM, GIS
Cite this paper: Getachew T. Ayehu, Solomon A. Besufekad, Land Suitability Analysis for Rice Production: A GIS Based Multi-Criteria Decision Approach, American Journal of Geographic Information System, Vol. 4 No. 3, 2015, pp. 95-104. doi: 10.5923/j.ajgis.20150403.02.
Article Outline
1. Introduction
- Rice is a staple food for more than half of the world’s population. Formerly, it was known as Asian crop. But currently rice is growing in many other parts of the world. It is also the most rapidly rising source of food in Africa, and is of significant importance to food security and food self-sufficiency in an increasing number of low-income food deficit countries. Therefore, improving the productivity of rice systems would contribute to hunger eradication, poverty alleviation, national food security and economic development [6].Ethiopia is one of the developing African countries with high population and food insecurity. Agriculture is the mainstay and backbone of the country’s economy employing the largest proportions of its population. The country has got immense potential for agricultural crop production due to its vast arable land, water resource and wide range of climate that can support varieties of crops. However, the sector is still in its primal stage despite considerable improvements recorded in recent times. Understanding this problem, the government has been formulating and implementing a number of strategies that gives due emphasis to commercialization as the next step of agricultural development. The strategies include diversification and specialization of crop production by farmers to improve productivity. Rice is among the target commodities that have received due emphasis in promotion of agricultural production in this regard. It is considered as the “Millennium Crop” expected to contribute in ensuring food security in the country. Even though, introduced recently, rice has proven to be a crop that can assure food security in Ethiopia [13]. Considering the agriculture potential of the country Shahi [22] said that the time may not be too far for Ethiopia to be one of the major producers of rice in the world. Corresponding to this the Ethiopian investment agency has identified the predominant rice potential areas in Amhara, Benshangul, Gambella, SNNPR, Oromia and Somali regions. Nonetheless, the suitability of those areas has not been studied much. Therefore, in order to ensure the optimum production of rice crops one has to grow the crops, where they suit best and for which first and the foremost requirement is to carry out land suitability analysis [1]. Suitability is a function of crop requirements and land characteristics [12]. Matching the land characteristics with the crop requirements gives the suitability. So, Suitability is a measure of how well the qualities of a land unit match the requirements of a particular form of land use [8]. Land suitability analysis has to be carried out in such a way that local needs and conditions are reflected well in the final decisions [15]. Hence, this study aimed to study the suitability of the study areas for rice production with a view to determining physical land suitability for rain fed rice crop cultivation using a multi-criteria decision with Analytical Hierarchical Process (AHP) and GIS approach and compare the results with the current vegetation cover to see the relationship between suitability map and vegetation covers of the study area. The research was carried out in Fogera, Libo kemkem, Gondar Zuria, Dembia, Alefa and Achefer Woredas in west central highlands of Amhara Region, Ethiopia (Figure 1).
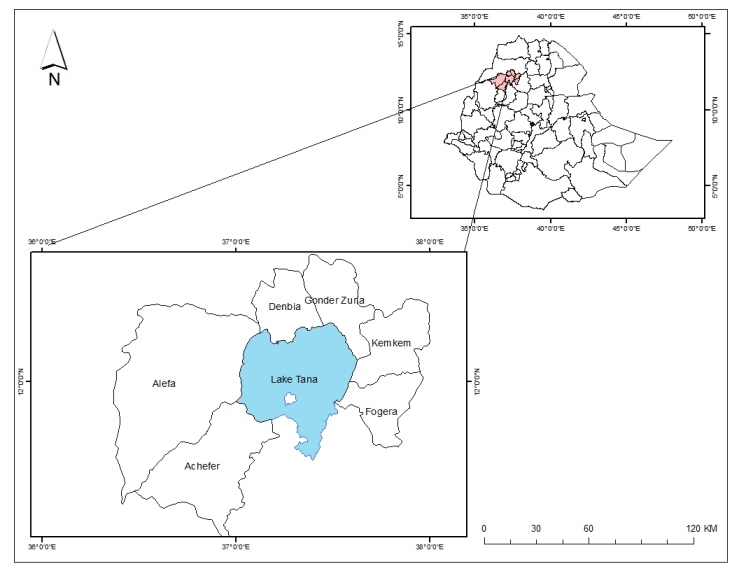 | Figure 1. Map of Ethiopia Showing the location of the study area |
2. Methodology
2.1. Multi-criteria Decision Making
- Multi-criteria decision making can be thought of as a process that combines and transforms a number of geographical data inputs into a resultant decision output [5]. The type of decision problems that has geographic natures needs to consider a large set of feasible alternatives and multiple conflicting and disproportionate evaluation criteria. As a result, many real world spatial problems give rise to multi-criteria decision making (MCDM) based on geographical information system (GIS). In MCDM, each and every criterion is given a weight to represent its genuine importance in the phenomenon [3]. These are dependent on the nature of the alternatives under consideration, the criteria used to compare alternatives, and the weights derived for criteria [2]. MCDM involves input data, the decision maker’s preference and manipulation of both information using specified decision rules. In this spatial multi-criteria decision-making approach, the input data is geographical data. In this study topography, physical and chemical properties of soil and climate were selected for land suitability analysis of rain fed rice cultivation based on local expert knowledge. Then, six causal factors, including slope, soil depth, soil PH, soil texture, temperature and rainfall were selected based on expert’s knowledge and consideration of literature inputs and data availability.
2.2. Data Collection and GIS Layer Preparation
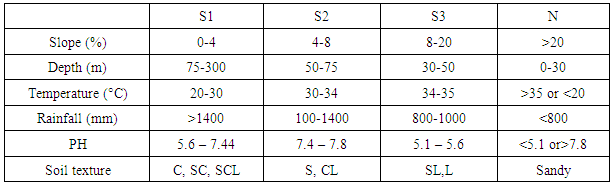
- Topographic factor: Slope is one of the basic topographic elements for crop land suitability mapping. When used with other variables, slope can assist in suitability and site analysis [24]. Slope was generated from digital elevation model (DEM). Most widely used DEM data sources is the elevation information provided by the shuttle radar topography mission (SRTM) [4]. In this study, the 30m spatial resolution DEM data of SRTM was acquired from USGS http://earthexplorer.usgs.gov. Then, the Slope function of Spatial Analyst Toolbox of ArcGIS 10.1 was used to generate the slope layer. The slopes were calculated in percentage of slopes. Every cell in the output raster has a slope value. The lower slope value indicates a flatter terrain and higher the slope value steeper is the terrain. Flat fields having smooth surface are better for rice cultivation as it facilitates even and equal distribution of water.Soil: Soil is an important component of our ecosystem. It provides an anchorage and nutrients to the plants. Thus soil is a fundamental raw material for the growth of any agricultural crops including rice. Hence, the knowledge of soil physical and chemical properties is essential for crop land suitability analysis and mapping. The soil texture, soil depth and soil pH were the selected parameters in this study. Soil information was obtained from the digital soil and terrain database of East Africa (SEA) [7]. It provides vector polygon layers of soil physical and chemical properties. The thematic layer for each of the parameters has been extracted from this polygon attribute table and rasterized based on their value fields in ArcGIS 10.1 platform. Climate data: Climate affects the growth, developments and yields of agricultural crops, including rice, favorably or unfavorably. Temperature and rainfall are two most important climatic factors considered in this study. Rice being a tropical and sub-tropical crop is normally grown at a fairly high temperature – high rainfall regime, ranging from 20 to 40°C and 1250mm to 2000mm of annual rainfall [20]. The raw 30 years temperature and 28 years rainfall data of the study area were obtained from Ethiopian Meteorological Agency as a point layer. The raster datasets are then generated using Inverse Distance Weighted (IDW) spatial interpolation tool in ArcGIS 10.1 platforms.All the prepared raster data layers (criteria) were set to local coordinate system of Adindan UTM 37 N and resampled to 30m spatial resolution. The suitability levels for each of the criterion layers were defined based on literatures, experts’ knowledge and author’s practical experiences (Table 1). Then, the layers were reclassified into different suitability level in ArcGIS 10.1 as a base to construct the criteria maps as shown in Figure 2 below. The suitability levels for each factor were ranked as: Highly suitable-S1, Moderately suitable-S2, Marginally suitable- S3, Not suitable-N, based on the structure of FAO land suitability classification. The overall flow of the methodology we have followed in this study is presented in Figure 3 below.
|
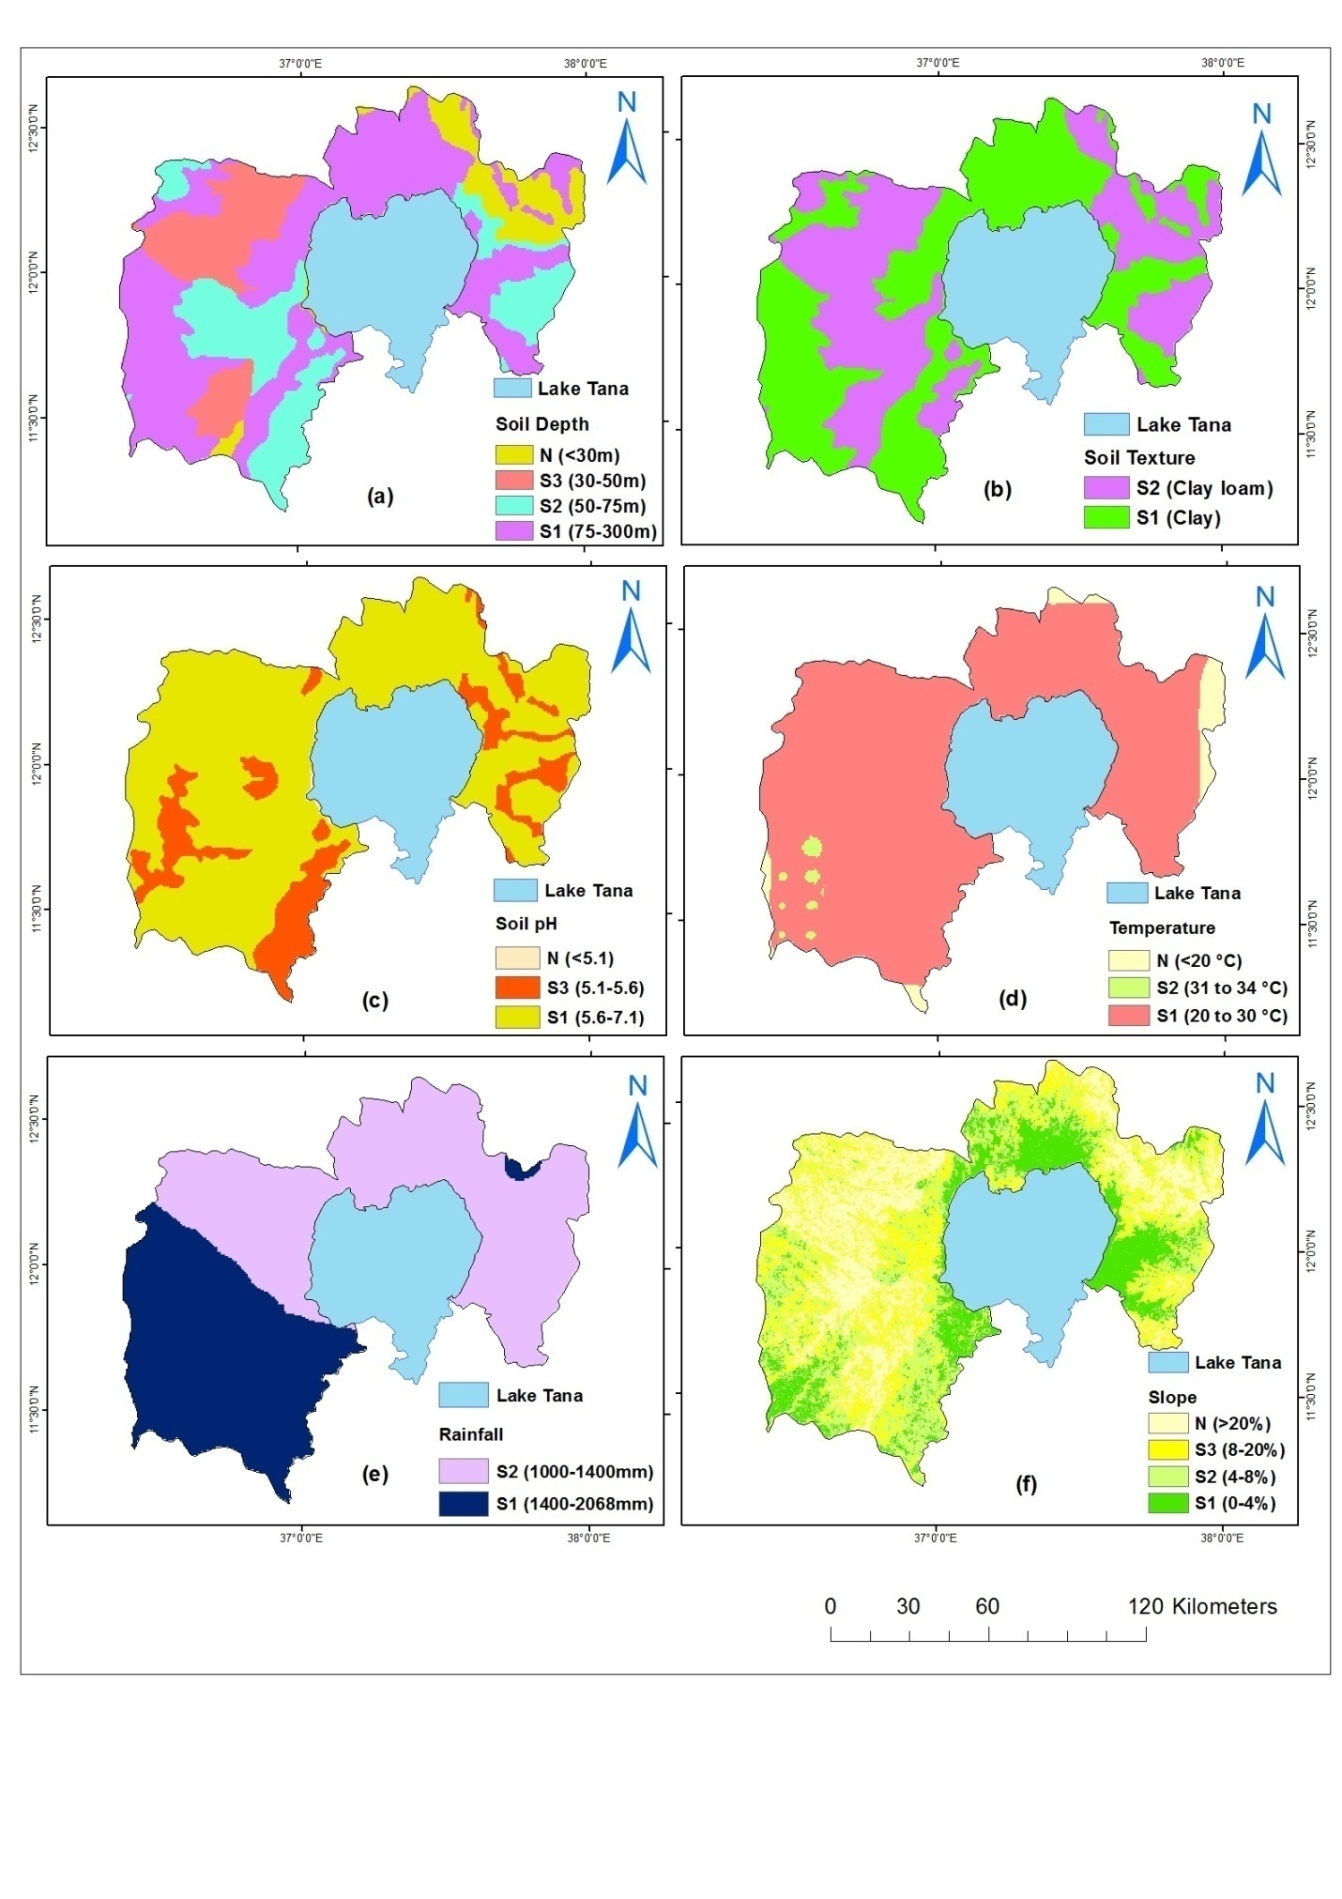 | Figure 2. Suitability level of the six factors: Soil depth (a), Soil texture (b), Soil pH (c), Temperature (d), Rainfall (e) and Slope (f) suitability classes |
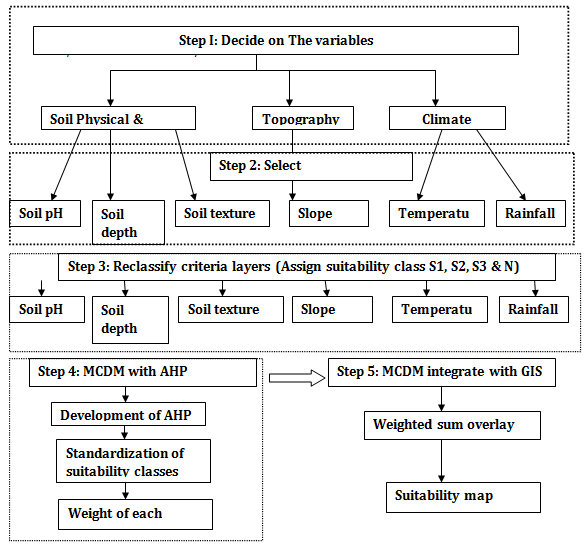 | Figure 3. Flowchart of the methodology used in the study |
2.3. The Analytic Hierarchy Process (AHP)
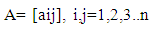
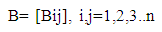
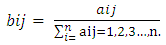
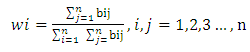
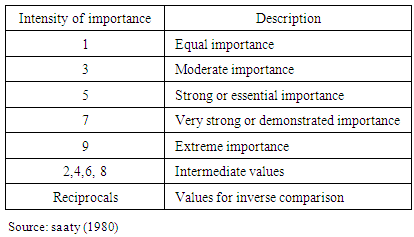
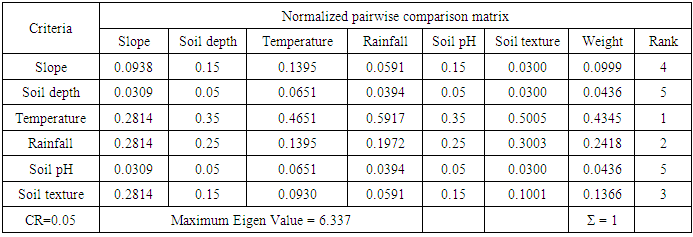
- The analytic hierarchy process (AHP) is the most widely accepted method and is considered by many as the most reliable multi-criteria decision making method. Both the original and ideal mode is currently used by many researchers [23]. One of the most decisive steps in many decision-making methods is the accurate estimation of the relevant data. Therefore, many decision-making methods attempt to determine the relative importance, or weight, of the alternatives in terms of each criterion involved in a given decision-making problem. An approach based on pairwise comparisons which was proposed by Saaty [18] has long attracted the interest of many researchers. Using Pairwise comparison matrix (PCM), factor weights were calculated by comparing two factors together at a time. The values of the pairwise comparisons in the AHP were determined according to the scale introduced by Saaty [18]. According to this scale, the available values for the pairwise comparisons are members of the set: {9, 8, 7, 6, 5, 4, 3, 2, 1, 1/2, 1/3, 1/4, 1/5, 1/6, 1/7, 1/8, 1/9} (see also Table 2). A rating of 9 indicates that in relation to the column factor, the row factor is more important. On the other hand, a rating of 1/9 indicates that relative to the column factor, the row factor is less important [12]. In cases where the column and row factors are equally important, they have a rating value of 1. Through the pairwise comparison matrix, the AHP calculates the weighting for each criterion (wi) by taking the Eigenvector corresponding to the largest Eigen value of the matrix, and then normalizing the sum of the components to unity as:
 | (1) |
 | (2) |
 | (3) |
 | (4) |
 | (5) |
 | (6) |
|
2.3.1. Standardization of Criteria (Ideal AHP)
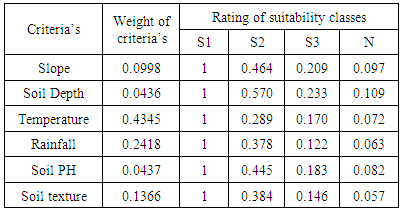
- All the criteria maps in land suitability normally presented in ordinal classes like (S1, S2, S3 and N) that show the degree of suitability of one attribute class from the other based on the requirements of the crop [21]. Hence, for further analysis each class has to be rated in order to show how important class S1 is with respect to a particular criteria to contribute for the final goal or objective. Here we are comparing the importance of one class from the other within a single criteria or factor. This process of setting the relative importance of each classes of a criterion is known as the standardization of criteria [15]. In this process scales of 0 to 1, 0 to 10 or 0 to 100 (etc.) are normally used for criteria standardization. A pairwise comparison technique is typically used for rating and standardizing the ordinal values [10]. In this particular study a pairwise comparison using ideal AHP was used (see Table 3) [15]. Original AHP may reverse the ranking of the alternatives when an alternative identical to one of the already existing alternatives is introduced [23]. Hence, this deficiency is overcome by the introduction of revised AHP called as Ideal Mode AHP.
|
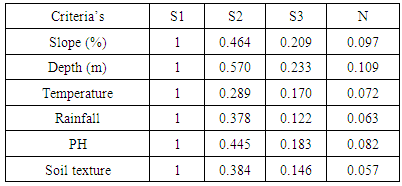
2.3.2. Assessing Weights Using AHP
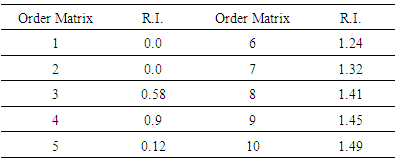
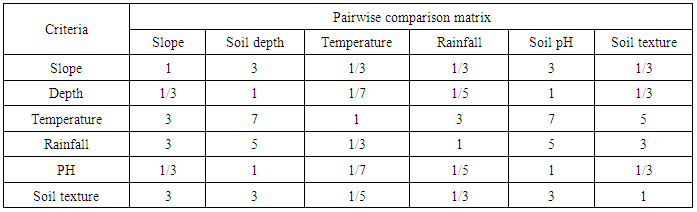
- Not all selected factors or criteria’s are equally important for rice crop suitability analysis. We need to compare the importance of each criterion with the other. For instance, how much is the effect of slope important relative to soil depth or other factors on yield and growth rate of rice? Hence, in this case the comparison is among factors or criteria’s. MCDM provides a rich collection of procedures and algorithms for structuring decisional problems and for designing, evaluating and prioritizing alternative decisions. Of the various MCDM methods, the Analytical Hierarchy Process is a well-known multi-criteria technique that has been incorporated into GIS-based suitability procedures [11]. Then each factor was compared and assigned a value. The values of the pairwise comparisons in the AHP are determined according to the scale introduced by Saaty [18]. In this study the assignments of weights were based on a local crop expert’s opinion and literatures. Table 5 shows pairwise comparison matrix of this study. In the diagonal, elements are assigned the value of unity (i.e., when a factor is compared with itself). The matrix is also symmetrical.Then, the pairwise comparison matrix presented in Table 5 was normalized and the weights of each criterion’s were determined (Table 6) using equation (5) and (6) above, respectively. As described in equation (1) above the sum of weights is 1. In the application of the AHP method it is important that the weights derived from a pairwise comparison matrix are consistent. The CR is used to indicate the likelihood that the matrix judgments were generated randomly [19] [14].
 | (7) |
|
|
|
2.4. Overlay Analysis
- In order to overlay the map layers weighted sum overlay techniques have been applied. Weighted overlay is a technique for applying a common scale of values to diverse and dissimilar input data to create an integrated analysis [9]. In this study, different map layers characterizing land suitability were weighted using the weights derived from the AHP process presented earlier. Then, the decision matrix has developed as described in Table 7 (below). Basically in weighted sum overlay the cell values of each input raster (i.e. the rating of suitability class) are multiplied by the raster's weight (i.e. criteria weights). The resulting cell values were added to produce the final output raster or suitability map. The results are displayed in (Tables 8). The maps resulting from this weighted sum overlay for rice suitability is shown in Figure 4. The final land suitability map is based on the best outcome in context of the suitability of rice crop production and the map classifies the case study area into four land suitability classes, name: highly suitable for rice production, moderately suitable for rice production, marginally suitable for rice production, and not suitable for rice production.
|
|
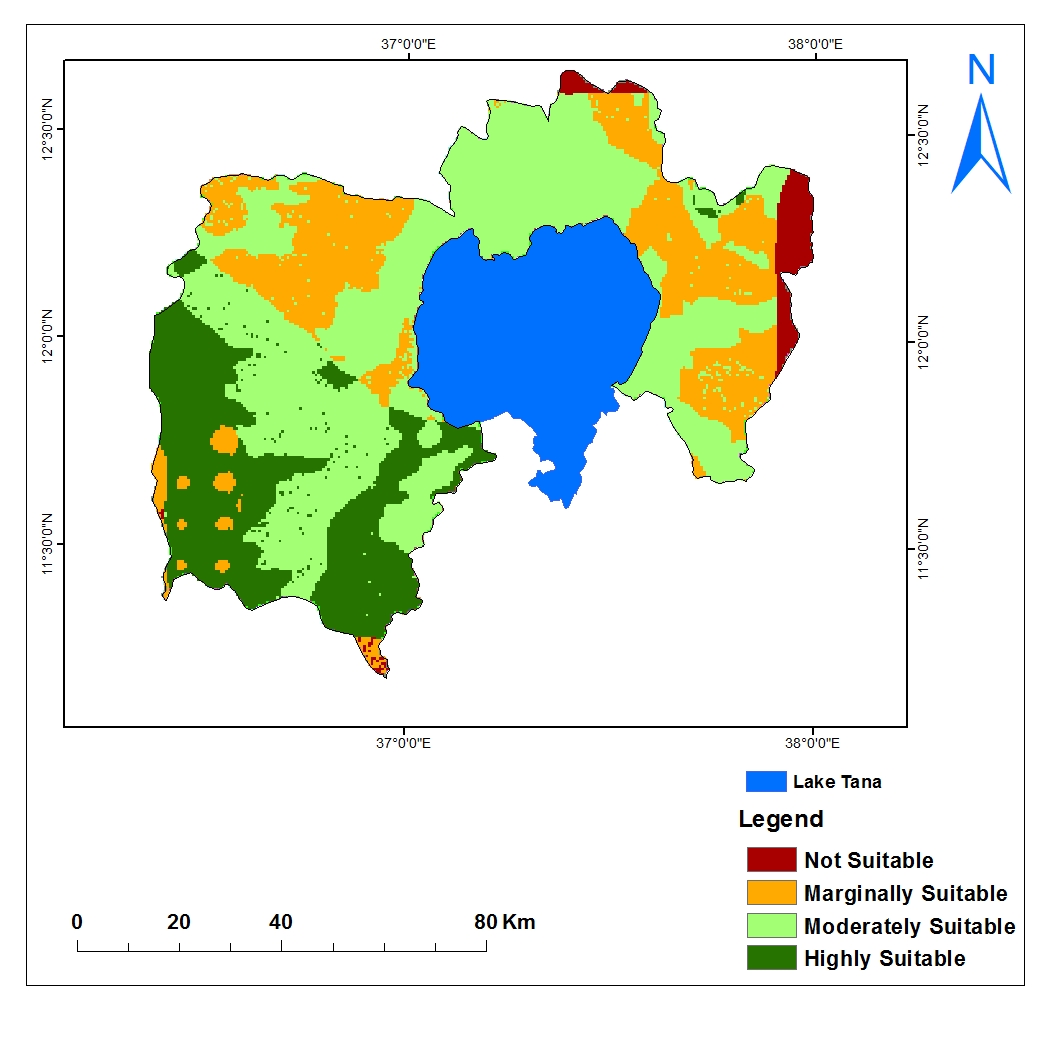 | Figure 4. Rice crop suitability map |
2.5. Vegetation Covers
- The current vegetation cover of the study area is very important here in order to modify suitability map of the study area. Some of the suitability class may lie on the economically and environmentally important dense vegetations. Therefore, we need to see the relationships between the suitability map and current vegetation coverage of the study area. The significant parts of high and moderately suitable classes are not supposed to lie on dense vegetations. The most common vegetation index in use today for monitoring vegetation status is the Normalized Difference Vegetation Index, or NDVI [16]. NDVI of the study area was generated in ERDAS IMAGIN 10 image processing software using Landsat TM satellite imagery of 2011 which was acquired from USGS Website http://earthexplorer.usgs.gov. Calculations of NDVI for a given pixel always result in a number that ranges from minus one (-1) to plus one (+1); however, no green leaves gives a value close to zero. A zero means no vegetation and close to +1 (0.8 - 0.9) indicates the highest possible density of green leaves like dense forests. Then the vegetation were classified into dense vegetation (>0.5), medium vegetation (>0.3 to 0.5), low vegetation (>0.1 to 0.3) and very low vegetation (<0.1) based on their NDVI values [20]. The class of water body was also extracted as an independent class.
3. Results and Discussion
3.1. Suitability Map
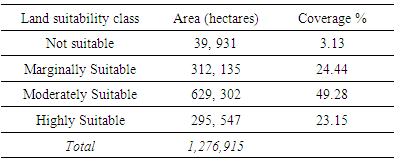
- The suitability map for rice crop, identified by weighted sum overlay using Spatial Analyst tools in ArcGIS 10.1, is shown in Figure 4. As can be seen from Table 8 (below) highly suitable (S1) land covers an area of 295, 547 ha (23.15%) of the total land. Hence, we can say that a significant part of the study area is highly suitable for rice cultivation. S1(highly suitable) areas were characterized by: slope level of 0-4%, soil depth of 75-300 m, soil pH level between 5.6 and 7.4, texture class - clay, rainfall range > 1400 mm and temperatures between 20 and 30°C; these values are in agreement with those considered in the literature. It is apparent from this table that the majority of the study area is moderately suitable (S2) for rice crop production. It covers an area of 629, 302 ha (49.28%). The result has also shown that a considerable amount of the total area is marginally suitable (S3) for the cultivation of rice with limitations nuisance mainly on rainfall, soil pH and slope. It covers an area of 312,135 ha (24.44%). This class is less used for rice production as its limitations cannot easily and profitably be corrected to take this suitability class to moderate level. Not suitable (N) area has also covered a relatively insignificant portion of the study area. It has an area of 39,931 ha (3.13%) of land area. Generally not suitable areas (N) were located in mountainous areas with a slope level of >20%, shallow soil depth with below 30m, low amount of rainfall as below as 800mm, and temperature less than 20°C. It can be seen from the result in Table 8 that the vast majority (up to 97%) of the land in the study area has shown varying degrees of suitability for rice production. In the light of the data, the highly and moderately suitable areas, taken altogether, which have, according to the analysis, covered 72% of the entire land in the study areas is commendable for rice production. Overall, these results indicate that the study area has got an enormous potential for rice production, and highly and moderately suitable areas are consistent with the current rice cultivated fields of some woredas (a small administrative area in Ethiopia)started rice cultivation a bit earlier. Therefore, economic levels of agricultural production can be achieved by cultivating rice crop in highly (S1) and moderately (S2) suitable areas, and practicing diversification of marginally (S3) suitable areas to crops other than rice.
3.2. Suitability Map and Vegetation Cover
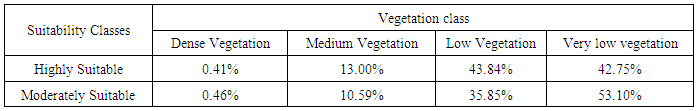
- The produced suitability classes (especially highly and moderately suitable classes put together) need to be assessed whether it is laid on the environmentally as well as economically important vegetation of the study area. The majority of the suitability class required to be outside of this zone or area for best utilization of the suitability results. Hence, we were supposed to make a comparison between the current vegetation map and suitability map of the study area. As mentioned above the vegetation map of the study area was derived from Landsat images using NDVI techniques. Subsequently the NDVI derived vegetation layer was classified into four classes as dense vegetation, medium vegetation, low vegetation and very low vegetation as shown in Figure 5 based on their NDVI values. The vegetation cover map and the suitability map for rice crop are overlaid to identify differences between the present vegetation cover and the potential suitable land for rice. A cross table between the map of suitable areas and the vegetation cover map is obtained. From the table we obtained useful information concerning the spatial distribution of different suitability levels. This phase allowed us to fine-tune our results because the resultant layer provided the information about how the rice can be cultivated across the various land suitability zones. Table 9 below illustrates the comparison between variables of suitability class and vegetation cover maps. Hence, as we can see from the table the result predicts the inverse relationship between the density of vegetation cover and rice land suitability. The majority (close to 80%) of highly and moderately suitable classes are laid on low and very low vegetation coverage’s of the study area. Taken together, these results suggest that there is an association between high suitability and low vegetation covers. This overlay analysis provides relevant information for a better understanding of the relationship between the rice suitability map and vegetation cover map of the study area.
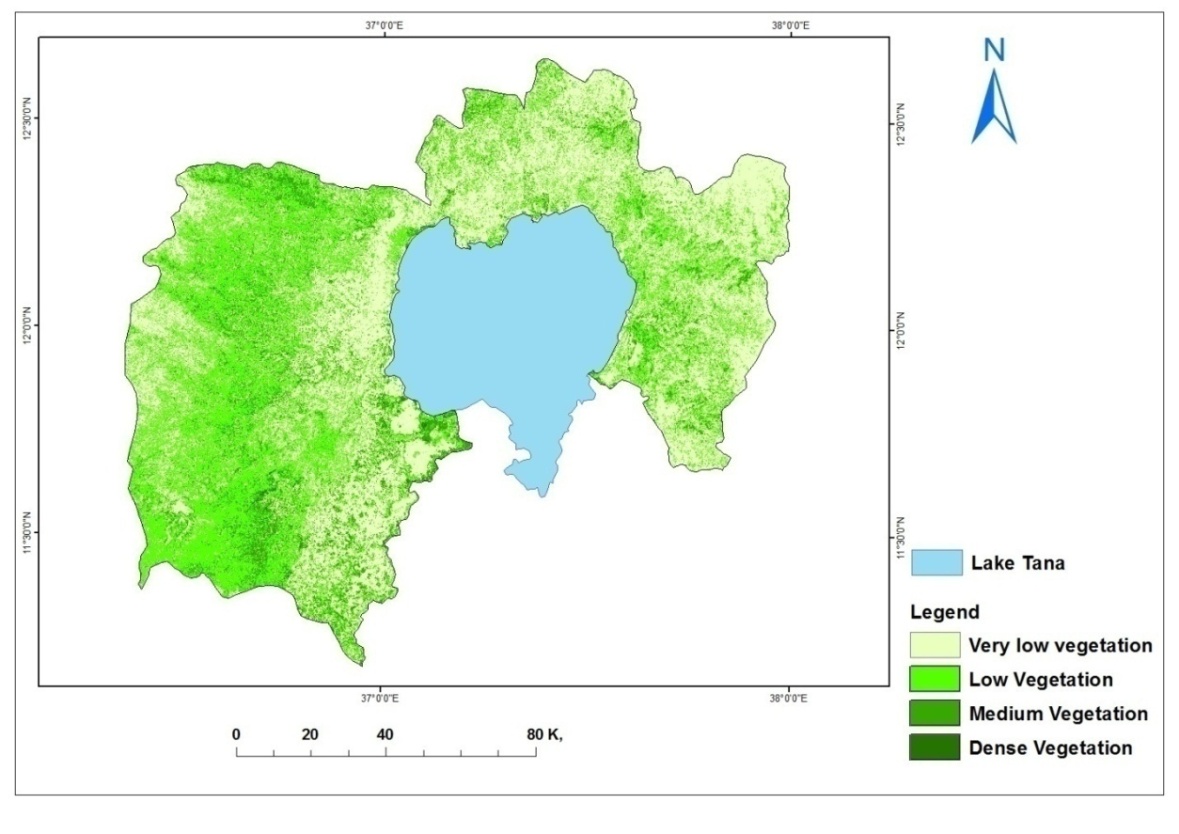 | Figure 5. Vegetation map of the study area |
|
4. Conclusions and Recommendations
- The aim of this research project was to develop a suitability map for rice crop production. The study applied weighted sum overlay of the spatial analysis techniques to adequately locate the suitable location of rain fed rice crop production in the study area. The study was carried out based on topography, climate and soil physical and chemical properties of the study area. Consideration of these key factors was believed to provide information that could be used by farmers to select their cropping pattern locally. The methodology premised that the integration of GIS with MCDM using AHP could provide a guide for decision makers considering the requirements of selected crops. Additionally, the results of this study could be useful for other investigators who could use these results for diverse studies. Research in the future should further examine the suitability analysis taking more factors such as soil fertility, land use, and socio-economic conditions into consideration. Additional investigations can also be done to examine the factors that may determine the sustainable use of the land and further compare the suitability results with the land use land cover conditions of the study area.
ACKNOWLEDGEMENTS
- The authors would like to express sincere gratitude to Dr. Dawit Amogne of Bahir Dar University for the valuable comments and proofreading of the manuscript. The authors are also grateful to Mr. Bayuhe Belay, National Rice Research Center, and Dr. Daniel Ayalew (Bahir Dar University) for guidance and provision of the data required for this study.