-
Paper Information
- Paper Submission
-
Journal Information
- About This Journal
- Editorial Board
- Current Issue
- Archive
- Author Guidelines
- Contact Us
American Journal of Geographic Information System
p-ISSN: 2163-1131 e-ISSN: 2163-114X
2015; 4(3): 87-94
doi:10.5923/j.ajgis.20150403.01
Spatial Pattern of Tuberculosis Prevalence in Nigeria: A Comparative Analysis of Spatial Autocorrelation Indices
 Abstract
 Reference
 Full-Text PDF
 Full-text HTML
Sa’ad Ibrahim1, 2, Isah Hamisu2, Usman Lawal1
1Department of Geography, Adamu Augie College of Education, Argungu, Nigeria
2Department Geography, Centre for Landscape and Climate Research, Leicester, LE2 7RH, United Kingdom
Correspondence to: Sa’ad Ibrahim, Department of Geography, Adamu Augie College of Education, Argungu, Nigeria.
| Email: |  |
Copyright © 2015 Scientific & Academic Publishing. All Rights Reserved.
This paper presents comparative analytical procedures of spatial autocorrelation indices for identifying cluster and modelling spatial pattern of tuberculosis (TB) prevalence. It compares global and Local Indicators of Spatial Association for finding cluster and hotspot locations. It also assessed three interpolation methods for disaggregating TB prevalence to enable analysis of local cluster and hotspot locations due to data limitation. Inverse Distance Weighting (IDW) was selected for its lowest variance (3.4) and Root Mean Square Error (RMSE) in comparison to other models. The global Moran’ I test was -0.09 and a p-value of 0.70 using aggregated TB prevalence for the year 2008 as the best case scenario considering all the years. Hence, global Moran’ I do not identify any significant cluster. In the case of general G, the situation is different for the clustering pattern, though quite low in some years but even unique to year 2010 with significant high z value (1.14) and very low p-value (0.25). When predicted data were used for these indices, both measures have shown interesting results with Moran’s I index of 0.86 which indicate high cluster of TB prevalence in the area. The analysis of Local Indicators of Spatial Association which were carried out based on the most accurate interpolated (IDW) values indicate high and low clustered areas, hotspot and cold spot locations. Despite data limitations, the outcome of this study is still very useful in assigning measures to minimize TB prevalence and for changing policy options in health service provision.
Keywords: TB prevalence, GIS, Interpolation, Autocorrelation
Cite this paper: Sa’ad Ibrahim, Isah Hamisu, Usman Lawal, Spatial Pattern of Tuberculosis Prevalence in Nigeria: A Comparative Analysis of Spatial Autocorrelation Indices, American Journal of Geographic Information System, Vol. 4 No. 3, 2015, pp. 87-94. doi: 10.5923/j.ajgis.20150403.01.
Article Outline
1. Introduction
- The health care system delivery in Nigeria, as in many other African countries, is indeed highly vulnerable. Due to a high level of deaths, inadequate health care facilities and the emergence of policy options, the assessment of health vulnerability has been the subject of increased research. Despite garnered attention from policy makers, private and international organisations on health issues at local and global scale, spatial information on health-related diseases is not well-documented in Nigeria [3]. Thus, very little is known about the magnitude and the devastating effects of diseases (malaria, cholera, AIDS, tuberculosis, etc.); especially as it involves wider communities. There are increasing casualties and deaths among large number of population in the country due to poor health care delivery system and lack of adequate research. Specifically, Nigeria is ranked fourth globally and first in Africa among 22 high-burden TB countries in the globe [18]. However, because of the insufficient knowledge on the disease prevalence and its spatial domain, it’s proven even more difficult for the government to identify areas of high risk, and where due attention should be focused to provide the needed policies to address the issues. To do this, evidence-based information needs to be established using analytical procedures to support this decision. Today, Geographical Information Science (GIS) is one of the most notable tools commonly used in health research to inform enabling policy. Presently, the availability of this technology along with the proliferation of disaggregated data – has led to a number of studies that are concerned with disease risk mapping, cluster analysis, spatial pattern and facility location, among others [5, 22]. The use of GIS in disease mapping attempts to understand and recognise spatial patterns to grasp its degree of prevalence, and consequently, associate factors responsible for the pattern. Depending upon what one is questioning, several attempts are usually made to identify whether the prevailing phenomena is clustered, random or sparse (spatial autocorrelation). This idea was rooted on first law of geography by the geographer Tobler (1930), which states that “Everything is related to everything else, but near things are more related than distant things.” However, the work of John Snow in 1854 which maps the outbreaks of a cholera epidemic that occurred around Broad Street and Golden Square in London in the mid-nineteenth century was one of the pioneering steps in spatial analysis of epidemiology. The map was first published in 1854 and rapidly became well-known in the fields of public health and epidemiology, history of medicine, medical geography, and medical cartography [16].The pattern of geographic data can be characterised as having spatial homogeneity or heterogeneity. Thus, spatial dependence can be explained using spatial autocorrelation to detect clusters. In point pattern analysis, cluster detection has some basic prerequisites that need to be in place to understand whether there are clusters or not. Firstly, there is the need to provide scientific mechanisms by which point pattern characteristics can be assessed to detect clusters. Secondly, there should be a basis for data manipulation which can be applied to first order inhomogeneity, if required; and thirdly, there should be a yard stick with which to assess the statistical significance of the result with particular reference to hypotheses [12]. Previous researchers put forward three general systematic approaches that can be used to detect clusters. These are based on the cell count, autocorrelative adjacencies of the cell with significant counts, and the distance between events which are quite applicable in the health research and epidemiology. Among the most notably acknowledged analytical approaches are Moran’s I, Geary’s statistic, Gestid-Ord and local Moran’s I – among others [1]. Many studies have been conducted to describe the occurrence and spatial pattern of diseases in various part of the world. Local Indicators of Spatial Association (LISA) were used to examine where cancer-related “hot spots” exist among minority and non-minority Health Street respondents within Alachua County, Florida, United States (US). The results of their study indicate that the spatial clustering of cancer varies with the minority status, suggesting that disparities may exist among minorities and non-minorities with regard to the location of cancer occurrences [13]. Similarly, the spatial anomalies in hot spot disease regions were studied using Global Moran's I and Local Getis-Ord statistics, to describe and map spatial clusters and areas in which these are situated, for the 20 leading causes of death in Taiwan. Results suggest a spatial heterogeneity of the 20 leading causes of death among different socio-economic profiles in the study area [17]. However, despite the availability of robust approaches for dealing with disease risk modelling with GIS, in Nigeria, there is poor link between the research in health sectors and the use of GIS as a tool for spatial analysis. Thus, these have affected our understanding of the disease conditions and our ability to enhance socio economic planning for changing decisions and policy making. Thus, despite increased research and opportunities to sophisticated approach in dealing with spatial data for disease risk modelling, in particular, health sector in this country has fail to recognised what GIS can do to revolutionised the sector. Consequently, even the data record management system, in most cases, does not consider socioeconomic characteristics and coordinates location of the patients’ visiting health centres. Although such actions might be as result of data confidentiality, spatial analysis with poor data quality obtained from this type of region can be technically challenging.Since an understanding of the spatial pattern and distribution of tuberculosis is crucial for the implementation of efficient strategies of the diseases risk modelling, prevention and management, it vital to develop novel approaches to identify high risk areas. This study attempted to address some of these gaps by estimating the spatial cluster of tuberculosis prevalence using both global and local spatial autocorrelation indices (Moran’s I and Gestid-Ord). The study also proposed novel method for predicting the tuberculosis prevalence to provide disaggregated data to carry out the most accurate estimates of cluster using the same indices to assess if further improvement could be observed. Basically, the objectives of this study were to: i) To identify the degree of the aggregated tuberculosis prevalence cluster using Moran’s I and Gestid-Ord global measures. ii) To predict the tuberculosis prevalence using interpolation methods so as to provide disaggregated data for further analysis.iii) To analyse the cluster with the disaggregated tuberculosis prevalence using both global and local Moran’s I and Gestid-Ord measures to identify cluster and hotspot locations.
2. Material and Methods
2.1. The Study Area
- Kebbi state is located in the north-western part of Nigeria. It was established by the federal government of Nigeria on the 27 of October 1991. The state is made of up 21 local governments and 35 districts which are divided into four major emirates as thus: Gwandu, Argungu, Zuru and Yauri. It is has a moderate population (predominantly rural) of about 3,256,541 according to 2006 official census. Climate of the area is tropical continental type, thus, agriculture is the mainstay of the people. The state is blessed with large flowing rivers such as the Niger [4].
2.2. Data
- The data used in this research involve reported tuberculosis cases acquired from the National Tuberculosis Control Program in Kebbi State, Nigeria. It is based on yearly records of the reported cases for the state aggregated as a single entity representing each of the 21 local government areas. Specifically, the data for the year 2008, 2009, 2010 and 2011 were used for spatial pattern analysis of TB prevalence.
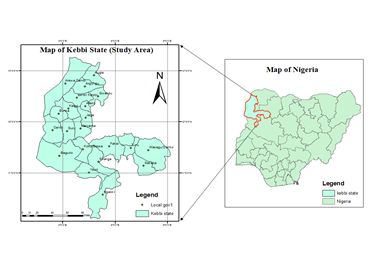 | Figure 1. The study area |
2.3. Methods
- In this study, tuberculosis cases for each unit area were used with the corresponding population data to determine the tuberculosis prevalence rate for each administrative unit. Prevalence rate is defined as the number of persons with the diseases by the total number of persons in population) at a given period [19]. Prevalence is recommended for measuring the burden of diseases like tuberculosis. This is one of the basic steps put forward in this work to avoid bias by making areas of high cases to be considered with more clustered especially where population of different regions were not accounted in assessing the prevalence. Three key spatial autocorrelation indices were used to detect cluster. The expected value of Moran's I under the null hypothesis of no spatial autocorrelation that is negative values indicate negative spatial autocorrelation and the inverse for positive values. Values range from −1 (indicating perfect dispersion) to +1 (perfect correlation). The Gi* statistic returned for each feature in the dataset is a z-score. For statistically significant positive z-scores, the larger the z-score is, the more intense the clustering of high values (hot spot). For statistically significant negative z-scores the smaller the z-score is, the more intense the clustering of low values (cold spot). To identify these parameters we used the centroid point of each polygon of the dataset to ensure adequate representation since the data has no spatial location for each reported cases. The limitation of our data set means that to understand spatial association using local indicators, there is need for us to make prediction of tuberculosis prevalence using the known prevalence points. Thus, it makes sense then to compare these models to understand which can be very useful for our dataset rather than just selecting one interpolation method with no concrete basis. Subsequent analysis therefore assessed three interpolation methods. Local polynomial and inverse distance weighting (deterministic methods) and kernel smoothing as an interpolation method with barrier were assessed so as to select the most accurate method. Previous studies indicate that deterministic and geo-statistical interpolation methods are the most commonly used interpolation methods due to their high level accuracy [20]. Areal interpolation has been used to show how mapping population and understanding disease (asthma in the Bronx) dynamics in urban areas can be made viable [10]. Although the nature of the data can also determine chosen interpolation technique, one of the limitations of areal interpolation technique assumed population is homogeneously distributed across unit area [3]. To make comparison with the previous aggregated data; we extracted point values of the significant population in each of the unit area for the year 2011. The same indices of spatial autocorrelation were applied to disaggregated data derived from interpolation methods to understand the clustering pattern. Both local and global spatial statistic measures were used to experiment if improvement could be seen with the changing techniques. However, the selection of interpolation method was based on validation criteria to identify the most accurate method. Variance of these methods and their corresponding observed TB prevalence were calculated. Additionally, root mean square error (RMSE) was also calculated so as to make the selection procedure more scientific. The interpolation method with least variance and RMSE was select for the TB prevalence dis-aggregation.
3. Result
3.1. The Reported Tuberculosis Cases 2008-2010
- The figure (2) below indicates the number of reported cases across the years for the study area. The figure further shows minimum, mean and maximum number of the reported cases at different periods. This raw data together with corresponding population data were used to obtained the tuberculosis prevalence. The pattern is showing decrease and increasing cases between years. There were few reported cases in 2010 which might due to medical treatment or campaign to raise awareness against the disease either by government or private corporations. But in 2011, the prevalence escalates to over 500 cases.
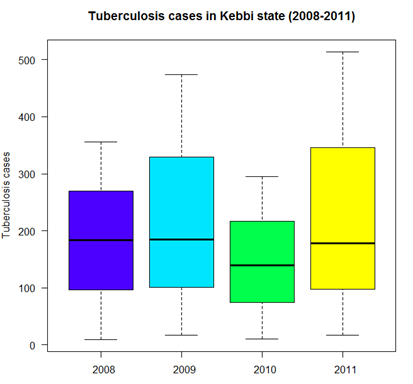 | Figure 2. Tuberculosis cases in Kebbi state (2008-2011) |
3.2. Testing Global Measures for Spatial Autocorrelation of Tuberculosis Prevalence
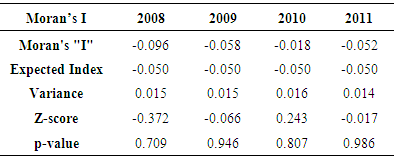
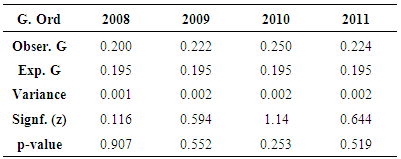
- The table (1) below shows results for global Moran’s I test across different periods. In all cases, the Moran’s I index depicted negative values which indicate negative spatial autocorrelation of the TB phenomena being investigated. A further look at the p-value index (0.70 as the lowest recorded in all categories) also reveal that the neighbouring features have dissimilar characteristics as for the cluster to be considered statistically significant; the p-value for the feature must be small enough. The table (2) below presents results from the Gestid-Ord, general G as a global measure. Considering z and p-values which are the measures of statistical significance in this context, the interpretation of these result may not be uniform as in the case of Moran’s I. The year 2008 has recorded values of 0.116 and 0.907 for the z and p-value respectively. This suggests that spatial low clustering of tuberculosis prevalence. The situation is quite different for the remaining period and is even unique to year 2010 where we have significant high z value (1.14) and very low p-value (0.253). This suggests somewhat clustering pattern of tuberculosis prevalence in the study area.
|
|
3.3. Comparing Interpolation Methods
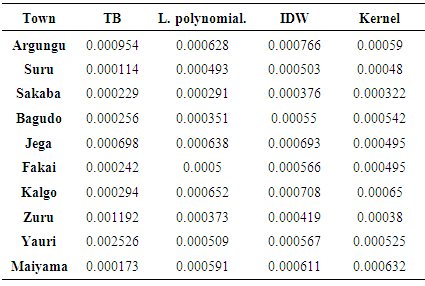
- The three interpolation methods are tested by extracting the raster surfaces (Fig. 3) created from each model to generate the estimated values for the observation data. Towns that were used for these estimates are overlay on each of the raster model. The density of the TB prevalence from the dark-red colour to the very light colours away from it indicates the prevalence density as shown by these models. Thus, these models are therefore variable in the estimate of these phenomena.
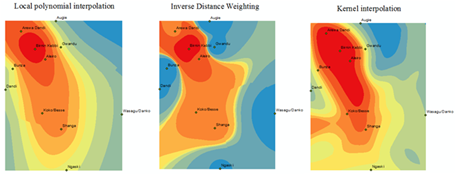 | Figure 3. Raster surfaces created from interpolation models |
|
|
3.4. Testing Global Measures for Spatial Autocorrelation of Predicted Tuberculosis Prevalence
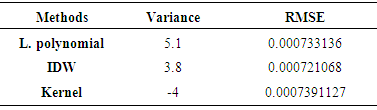
- The prediction enables us to further assess cluster using global measures. In the figures (4 & 5) global measures that is Moran’s I and Gestid-Ord were tested with the disaggregated data derived from the interpolation of tuberculosis prevalence. In this case looking at figure 4, it could be seen that the Moran’s I index has positives values (0.86). This rejects the null hypothesis of no spatial autocorrelation and accepts the inverse perfect correlation. With this disaggregated data, the situation for Gestid-Ord G is also different from the previous analysis. The result has shown significant clusters with the z score of 10.8. There is however less than 1% chance that the high clustered could the result of random chance.
 | Figure 4. Moran’s I test of spatial autocorrelation of tuberculosis prevalence |
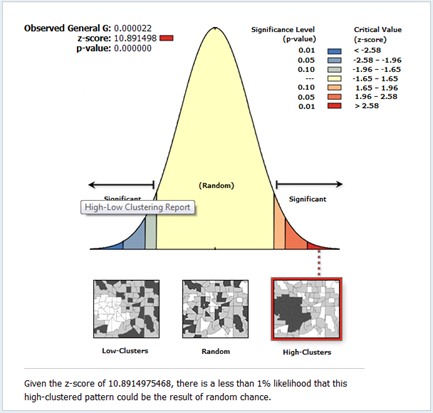 | Figure 5. Gestid-Ord (G) test of spatial autocorrelation of tuberculosis prevalence |
3.5. Cluster Detection and Hotspot Mapping Using Local Indicators of Spatial Association (LISA)
- Unlike the global measures, local measures characterize individual units as to whether cluster or non-clustering pattern occurs. In most areas there are no significant clusters as shown by the Moran’s I index below (Fig. 6). There are also very low spatial clusters. High clusters were located in the three of the four major towns of the state.
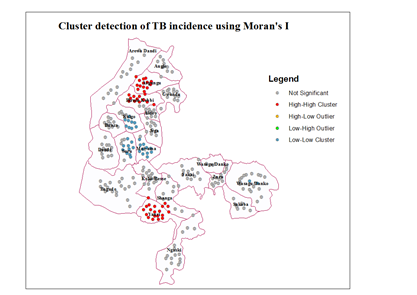 | Figure 6. Mapping cluster using Anselin local Moran’s |
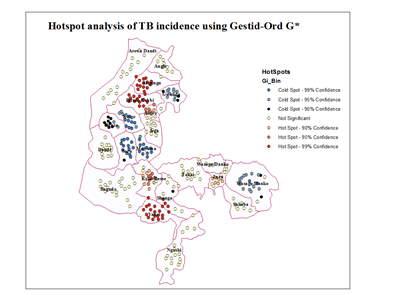 | Figure 7. Mapping Hotspots using Gestid-Ord G* |
4. Discussion
- One of the main issues that emerge from this study is the reliability of global measures to test clustering pattern using disaggregated data. The use of global measures to understand the spatial pattern through cluster detection has been widely acknowledged in health research. In this study, the applicability of such measures (Moran’s I and Gestid-Ord) was not quite successful using aggregated data as reveal by our result and in comparison to estimate data. Sometimes the conclusion based on the analysis of spatial autocorrelation index (high or low cluster) could be misleading depending upon the index in question, the viability of the dataset and modelling approach. Despite significant number of TB prevalence in some of the unit areas in the study site, our analysis for Moran’s I did not detect any clustering pattern for aggregated data. However, the situation is not completely similar with the global G statistics. Contrastingly, our result (especially for the year 2010) has depicted some level of TB clustering pattern using global G. This not an unexpected event since Moran’s global statistic measures of spatial autocorrelation do not usually accounts between patterns dominated by concentrations of high or low values especially where highly aggregated data is used which may have impounding effect in analysing spatial pattern. And more so that the global G statistics can be more advantageous than the Moran’s by allowing pattern to be expressed as either high or low clusters [12]. However, previous studies demonstrated that the effect of spatial resolution on power to detect significant space-time clusters [6]. The level of data aggregation has consequently affected the outcome of our data analysis in this context.It is obvious that the results of global measures could be misleading considering both the outcome of our analysis and the nature of our dataset on TB prevalence. However, spatial methods which used mathematical models to predict the unknown using the known points (interpolation) is one of the viable GIS techniques used to address data limitations [9]. Such a technique has been tested in this study. Although, all interpolation methods can be limited in way, IDW interpolation technique is advantageous since it assume substantially that correlations and similarities between points is proportional to distance between them. In this study result for IDW shows high-level agreement with the observation data considering variance and Root Mean Square Error (RMSE). This is seen in work involving comparison of kriging and inverse distance weighting (IDW) in lineament extraction and analysis [14].Judging from the outcome of global measures using the predicted data, it is a clear indication that there are significant clustering pattern of TB prevalence in all cases and for all the indices. This reflects prevalence that is closer to reality which significantly indicates the relevance of data prediction in analysing and understanding spatial pattern. Similar situation is observed through the analysis of local measures of spatial autocorrelation which further supported these decisions. Very close related work can be seen in some previous studies [15] where areal interpolation was used to increase the usability of the poor data quality by disaggregating the data set to neighbourhood level to identify people’s access to healthy food in the US. Of particular importance in this study, is the Local Moran’s I which indicated high and low clusters and insignificant areas and the Gestid G* that analyses hotspot locations given out high and low hotspots as well as cold spot areas. This information which cut across every single administrative entities of the study site is very valuable for decision making process. It is interesting for further studies to examine factors responsible for high density of TB prevalence in hotspot locations. If the environmental characteristics for coldspot location are not by chance, it is worthwhile to examine them so that similar condition can be considered in the hotpots locations. However, these hotspot areas (high risk) are concentrated in the three of the four most urbanized areas of the state. It is possible that inadequate access to health facilities (mostly affected by the rural dwellers) may serve as an impediment for the discovery of people affected by TB and other related diseases in the state. Study in the assessment of people access to hospital in Kebbi state [4] explained that people have very low access to medical care in the Kebbi state.Despite successful implementation of interpolation method for TB prevalence prediction, we recognized the limitation of the dataset is still something to worry about. The lack of coordinate’s locations for each case is one of the starting points. Sometimes ethical issues, confidentiality of the patient’s information and health policies limit access to certain need to come with the data. However, in Nigeria, there is poor record data management system. In many cases, even the address of the patient may not be available for the recorded cases. Even where addresses were given, there is also no comprehensive geographic database (e.g. postal address file and their GPS points) with which to relate each individual cases. The United Kingdom’s institutions with this responsibility has cited as a classical example of what can be consider in Nigeria [4]. He maintained that the Nigerian mapping agency supposed to be the equivalent of UKJ’s Ordinance Survey (Great Britain mapping agency: which provide accurate and up-to-date geographic data) and the Nigeria Postal service (NIPOST) should be the equivalence of UK’s Royal Mail. The Royal Mail usually provides the address in the database and the Ordinance Survey attaches the GPS points to the address.Moreover, one of the most critical information relating to disease data is socio-economic and demographic profile of the patient. This is not available for the TB prevalence in Kebbi state. Despite viable techniques available in GIS to overcome data limitation, lack of socio-economic data may constraint our ability to apply various modelling approaches to certain group of the population. Analysis of socioeconomic components in disease mapping can be seen in many studies. The analysis of spatial variation of HIV prevalence at regional, urban/rural, district and sub-district levels [22], hotspot and spatial pattern of tuberculosis in relation to gender (in Taiwan) using spatial autocorrelation indices [17] and spatial patterns of pulmonary tuberculosis prevalence and their relation to socio economic status in Vitoria [11]. Therefore, more information on socioeconomic characteristics (such as age, sex, pregnancy status, income level, rural or urban, death, literacy, employment, marital status, family size etc.) of the patients’ needs to be incorporated to allow for concrete research to inform better decision making.
5. Conclusions
- The spatial model for predicting the TB prevalence employed in this study for identifying spatial pattern of tuberculosis prevalence has significant advantages over previous analysis especially in the circumstances of poor data quality in which clustering pattern can be misleading or hard to reliably detect. This study has shown that despite data limitation, GIS approaches are quite viable for understanding spatial pattern. Thus, the outcome of this study is quite imperative for enhancing policy and decision making in health service provision.
ACKNOWLEDGEMENTS
- The authors wish to sincerely acknowledge the efforts of National Tuberculosis Program (Kebbi State) for providing data on reported tuberculosis cases.