Emmanuel Udo A.1, Ojinnaka O. C.2, Baywood C. N.1, Gift U. A.1
1Department of Surveying and Geo-informatics, Abia State Polytechnic Aba
2Department of Geo-informatics And Surveying University of Nigeria Enugu Campus
Correspondence to: Emmanuel Udo A., Department of Surveying and Geo-informatics, Abia State Polytechnic Aba.
| Email: |  |
Copyright © 2015 Scientific & Academic Publishing. All Rights Reserved.
Abstract
This study exploits GIS and Remote Sensing Approach in flood management with the aim of identifying and mapping areas vulnerable to flood hazard and identify the extent of damage resulting from the 2012 flood disaster in Anambra state. It identified spatial variations in flood hazard levels, spatial and economic impact of the 2012 flood disaster and the population exposed to different levels of risk in Anambra with a view of fostering the best approach for flood management. This study considered six factors as indexes of flood hazard identification and these included elevation, proximity to drainage, Land use, population density, flow accumulation and slope. These information were derived from SRTM, google earth imagery, and population data of the study area while the extent of inundation was mapped using MODIS remote sensing data captured on 20th 0ctober 2010 before the flood and 13th October 2012 during the peak of the event. To extract and map the flood-affected areas, the time series MODIS data and the google earth imagery were entered into the ArcGIS 9.3 Version and projected to UTM coordinate system for on-screen digitization. The true width of the river channel was extracted from the image captured before the flood while the extent of inundation was captured on the image acquired during the flood. This study revealed that a total landed area of 1078Sq.kms was covered by flood excluding the original extent of the river while property worth of twenty three billion naira was damaged. It further revealed that area of land of 2106.78km2(43.40%), 955.392km2(19.68%), 835.054km2(17.20%), 555.48km2(11.44%), and 402.334km2(8.29%) were occupied by very high, high, moderate, low and no hazard categories while total number of population of 1814733(43.40%), 822953(19.68%), 719298(17.20%), 478486(11.44%), and 346561(8.29%) are residing at very high, high, moderately high, low, and no hazard zones.
Keywords:
Hazard, Flood Disasters, GIS, Vulnerability, MODIS
Cite this paper: Emmanuel Udo A., Ojinnaka O. C., Baywood C. N., Gift U. A., Flood Hazard Analysis and Damage Assessment of 2012 Flood in Anambra State Using GIS and Remote Sensing Approach, American Journal of Geographic Information System, Vol. 4 No. 1, 2015, pp. 38-51. doi: 10.5923/j.ajgis.20150401.03.
1. Introduction
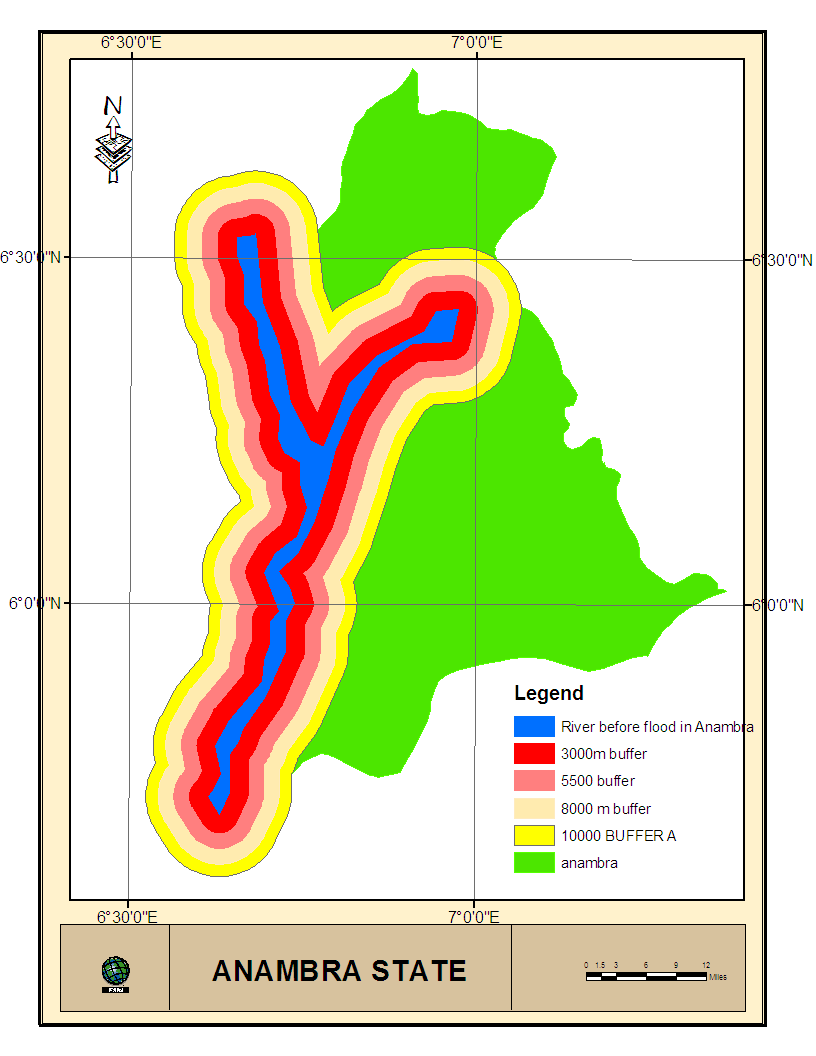
A geo-hazard is defined as an environmental condition that has the possibility of growing into a critical event (Nancy Carlin 2011). Of all geo-hazards, flooding is the most common and costly.Flooding is one of the major environmental crises one has to contend of within the century. Flooding is defined as a large amount of water covering an area that was usually dry (Olajuyigbe et al., 2012). Nwafor (2006) defined flood as a natural hazard like drought and desertification which occurs as an extreme hydrological (runoff) event. Flood can simply be defined as a flow of water above the carrying capacity of a channel.In the past decade in Nigeria, thousands of lives and properties worth millions of Naira have been lost directly or indirectly from flooding every year. It is a natural phenomenon occurring from time to time in all river and natural drainage systems. Flooding and rainstorm apart from causing destructions to lives and properties often causes significant damage to the livelihood system of the victim. The impact of floods has been increased due to a number of factors, with rising sea level and increased developments on flood plain etc. (Ologunorisa, 2004). Re-occurring flood loses have handicapped the economic development of Nigeria and other developing and developed countries. The devastating flood occurrence and its multidimensional impact on the masses have been a great concern to Nigeria and the world as a whole.The 2012 flood was believed to have resulted from the combination of Lagdo dam effect and rainfall intensity. Plates 1.1a and 1.1b show the extents of river Niger -Benue in Nigeria in October 2010 and 13th October 2012. It was excessive water due to heavy rains that forced the Cameronian government to open the spillways of Lagdo dam having sent warnings to Nigeria for the release of the water. About 14 states that border the Niger-Benue River were severely affected. The worst affected state includes Kogi, Edo, Anambra and delta states. This flood incident has been characterized as the most devastating since the last 40 years (Felix Ndidi 2013). The flood submerged houses, severed transportation routes throughout the affected areas (Figures 1.1a, b). Overall, an estimate of 1.3 million people was displaced and about 431 people lost their lives (MISNA, 2012; NASA, 2012). In addition, over 1525 square kilometers of farmland were destroyed. Konwea (2012) described the flood as the worst floods Nigeria has seen in at least half a century, which has led to the deaths of hundreds of Nigerians, displaced over a million people, and destruction of hundreds of thousands of hectares of farmland. Huge swathes of the country were affected, particularly in central, south- south and eastern regions with houses, bridges and roads devastated. Many refugee camps were overcrowded with little or no aid materials. Although, through the Flood Early Warning Centre, Nigeria’s Ministry of Environment (2012) issued a forecast of heavy rainfall in mid-September and warned of potential flooding in some parts of the country (Anambra inclusive) but spatial and synthesized information was not made available. Such information involves the detection of the areal extent along the Niger and Benue rivers that is at risk or vulnerable to flooding. It is evident that planners and policy makers lack the required platform for producing such information. This is because; report revealed that the numerous refugee camps which were setup in the presumed safe ground were equally overwhelmed by the flood. In general flood hazard mapping is a vital component for appropriate land use planning in flood-prone areas. It creates easily-read, rapidly-accessible charts and maps that can facilitate administrators and planners to identify areas at risk and prioritize their mitigation/response effort.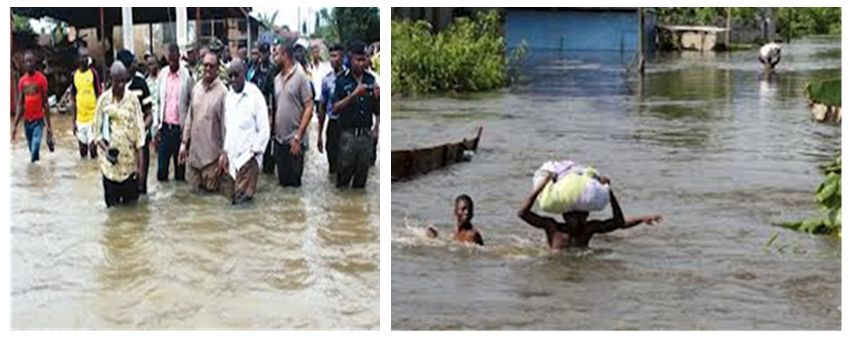 | Figure 1.1. Situations during the 2012 flood in Anambra state |
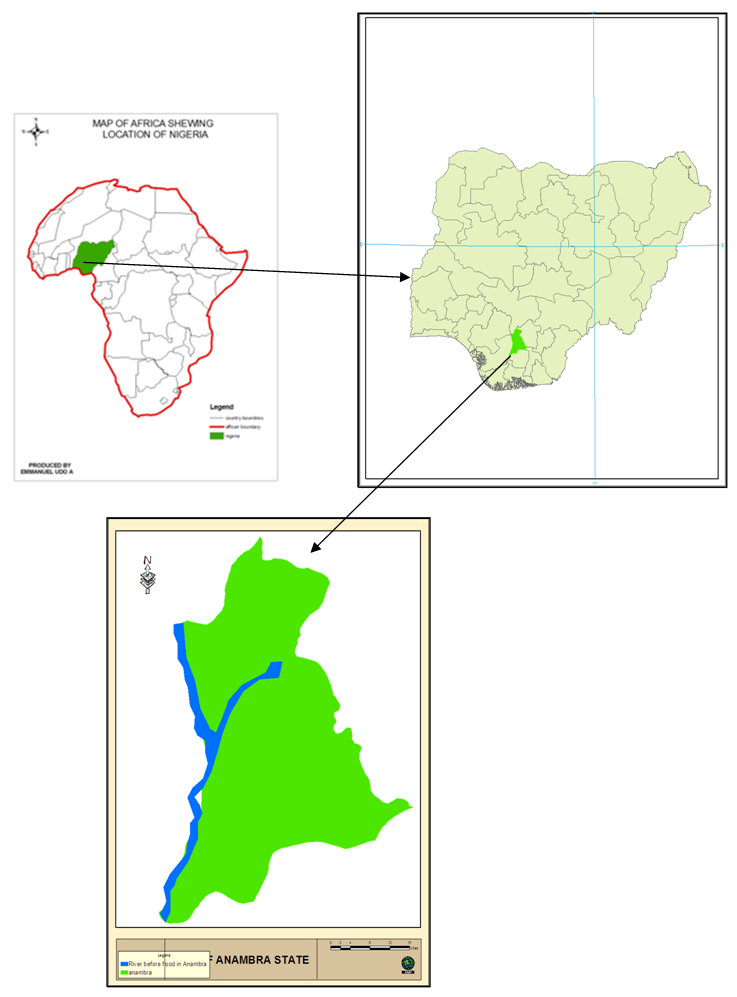 | Figure 1.2. Location of the Study Area |
1.1. Study Area
Anambra State is a state in the south eastern part of Nigeria. It is located between latitudes 5°.40`N and 6°.50`N, then longitudes 6°.35`E and 7°.25`E. It is bordered by delta in the west, Imo and rivers in the south, Enugu in the east and Kogi state in the north. 98% of the population is Igbos while the remaining 2% of the population are made up of Igala who live in the north western part of the state. 2006 population census recorded the state to have a total population of 4,182,032 with male constituting 2,174,641 and female 2007391 fractions of the population. The state has a land mass of approximately 4855.Skm. Anambra is one of the most populated state in Nigeria with a population density of approximately 900. The stretch of more than 45km between Oba and Amorka contains a numerous strictly populated villages and small towns. Anambra is rich in natural gas, crude oil, bauxite, and ceramics and has 100 percent arable soil. It is the first state in Nigeria that has private refinery, orient petroleum refinery (OPR) at Nsugbe-Umuleri. Currently, there are 21 local governments within the state.
1.2. Aim and objectives
The central aim of this study is Flood hazard zonation and damage assessment of 2012 flood in the study area using Geo-spatial techniques (remote sensing and GIS)Objectives− To determine the spatial extent of 2012 flood in Anambra state.− To determine the economic impact of the 2012 flood in the study area− Understand the general topography, in the study area.− To determine population vulnerability of the study area.− Prepare a flood hazard zone map,.− To suggest strategies for future flood disaster and risk mitigation in the study area.
2. Materials and Methods
The following materials and data were acquired for this study: Digital Elevation Dataset from Shuttle Radar Topographical Mission (SRTM) downloaded from USGS explorer, prior and during 2012 flood remote sensing satellite imageries captured by moderate resolution imaging spectroradiometer (MODIS) on NASAS terra satellite. One was captured on 20th October 2010 before the flood (figure 2.1a) and the other was captured on 13th October 2012 during the peak of the flood (figure 2.1b). The spatial locations of some flooded communities were also acquired with the use of Garmin 72 GPS, administrative map from where political boundaries and roads were digitized. Field work with GPS and notebook were also used to acquire and record the coordinates of the communities respectively. Others datasets are population data from Nigerian population commission, information gathered from NIMET, NEMA, NIWA, ASFDCC publications and through social survey.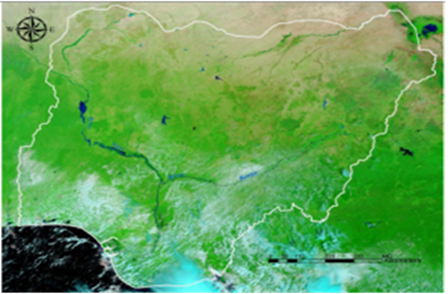 | Figure 2.1a. MODIS image before 2012 flood |
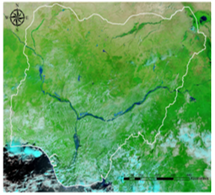 | Figure 2.1b. MODIS image during 2012 flood |
2.1. Extracting the Spatial Extent of the Flooded Areas along the Niger-Benue
To extract and map the flood-affected areas, the administrative maps of the Anambra was scanned and geo-referenced with the google earth imagery in Arc GIS9.3 platform. Likewise the time series MODIS data were entered into the same environment and the data set were projected to UTM coordinate system for on-screen digitalization. The true width of the river channel was extracted from Figure 2.1a as polygons (shape file) and in the same process, the flood extent along the river channel in Figure 2.1b study area, and the administrative elements disaggregated to local government level were also digitized as polygons within the ArcMap platform. The reason for the extraction of these features and convert to GIS format is to facilitate topological overlay of such spatial data on other spatial and non-spatial data. Accordingly, the Niger-Benue River layer and the flood extent layer were both overlaid on the administrative map layer which is disaggregated to the LGA level figure 3.2b). Field work was conducted to validate the extent of inundation as captured by the satellite imagery and to identify other flooded areas and the effects of the flood on the means of livelihood of the people. The coordinate of communities affected were collected with hand held GPS and added as events in the flood extent map. The overlay analysis shows the extent of inundation on the project area. With calculate geometry module of ArcGIS, the area occupied by river Niger and the flood extent in the study area were calculated respectively. The actual area covered by the flood was calculated by subtracting river Niger extent shown in blue (figure 3.2a) from the flood extent shown in read. This removed the true area of the Niger River from the area affected by flood. This procedure was able to separate the flooded area from the actual river channel so as to reveal the areal extent of the flood. The overall affected area along the river basin in the study area is 1078km2. 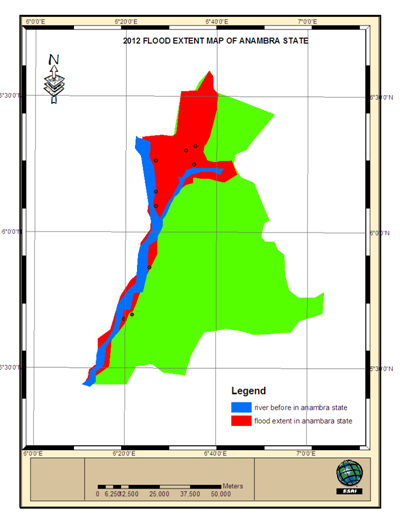 | Figure 3.2a. Flood extent on the study area |
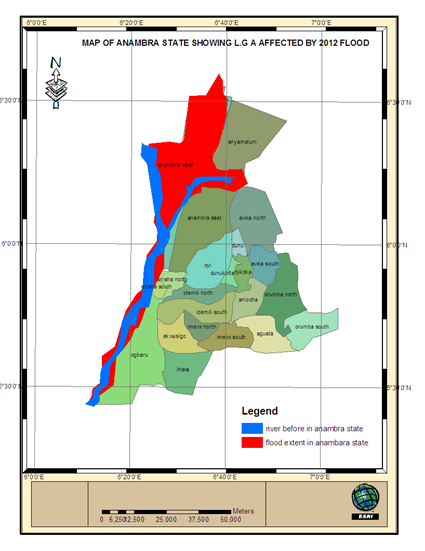 | Figure 3.2b. LGAs affected by the flood |
2.2. Terrain Modelling
Creating the DEM for the analysis requires merging the SRTM DEM tiles into one raster grid entity (mosaicking). Progressively, the tiles were entered into the ArcMap-Arc Info platform for processing. Using the tiles elevation data were mosaicked with data management function of Arc-tool box in ArcGIS 9.3 and the generated data was transformed from geographic coordinate system to projected coordinate system (i.e. from GCS-WGS1984 to WGS1984 World Mercator. The mosaicked data was masked with the boundary limit of the study and converted to xyz point data. The XYZ point data was exported to surfer10 worksheet where the data was resampled to a grid interval of 10m. The resampled data was blanked from the blanked file, elevation model (figure 3.4b), contour, wireframe and flow model of the study area were generated. These models were overlaid to the administrative boundary of the study area disaggregated to local government level for in-depth spatial analysis. The multiple terrain representation was adopted in other to critically analyze the terrain. These models shows terrain elevation range of between 20m to 350m above mean sea level with elevation decreasing towards the river Niger
2.3. Hazard Mapping
This study considered DEM (elevation), flow accumulation , slope map, population density, land use and proximity to the river as the parameters used to generate flood risk map of the study area because the study employs the use Analytical Hierarchical Process (AHP). AHP is a multi-criteria decision making technique, which provides a systematic approach for assessing and integrating the impacts of various factors, involving several levels of dependent or independent, qualitative as well as quantitative information (Bapalu and Sinha, 2006). Therefore, each of the parameters was reclassified into four which included very high hazard, high hazard, moderate hazard, low hazard and no hazard through the ranking process. Flood hazard map (FHM) was later generated through by overlaying the reclassified maps of all the parameters using addition operator to generate the flood hazard map of Anambah state.(i.e. FHM = Ʃ {Reclassified (Elevation, Distance to Drainage, flow accumulation, and slope map, land use POP density)}. The map produced was validated using 2012 flood extent map of the study area
2.4. Population Vulnerability
Population vulnerability analysis was conducted. A high population at risk means that more people and facility will be affected and this affects the economy of the state or country concerned. Since attribute database was automatically created ArcGIS calculated the area occupied by each of the hazard category. The average population density of the state was integrated with the area of each zone to obtain the fraction of the total population at a particular hazard zone. This analysis proved that 1814733, 822953, 719298, 478486 and 346561 persons are within the very high, high, moderate high, low, and no hazard zones.
3. Results
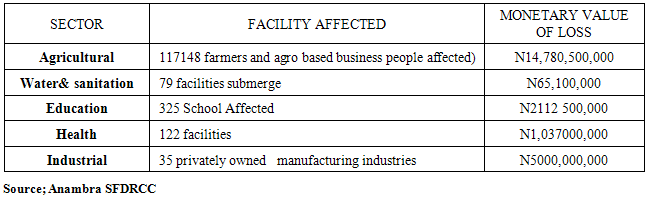
Figure 3.1a is the overlay analysis of river layer and flood layer on the study area fig 3.1b is the overlay analysis of the hydrological layers and the administrative elements. Fig 3.3 is the spatial extents of the 2012 flooding on the LGA’s along the river basin in the study area. Table 3.1 and Fig 3.4 reveals the economic impact of the flood. Fig 3.5a, b and c are the contour map, DTM, and 3-D model of the study area. Figure 3.6 is the overlay analysis of the wireframe, DTM and flow models of Anambra State. Figure 3.7a and b, are the overlay analysis of the topographic model, administrative elements, river and flood layers in 2.5-D and 3-D perspectives. Fig 3.9a and b are spatial extent of hazard zones and hazard zonation map of Anambra state. While (figures 3.9c and d) are the charts revealing the percentages of land occupied by hazard categories and the population at various hazard categories.Table 3.1. Facilities Affected By 2012 Flood In Anambra State
 |
| |
|
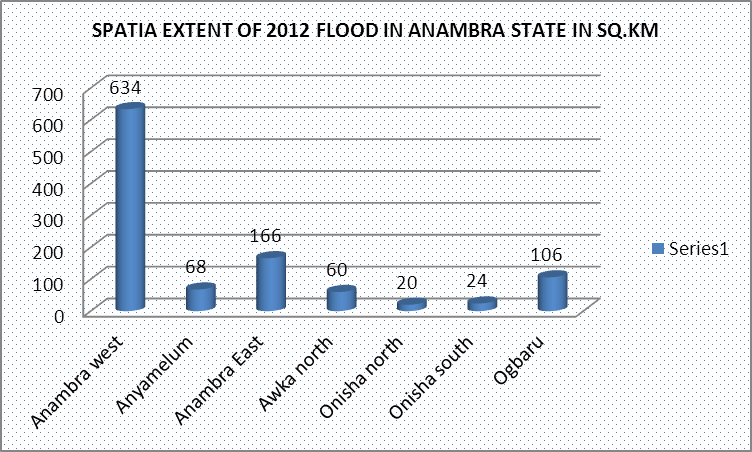 | Figure 3.3. Extent of Inundation on the Affected LGA’Ss |
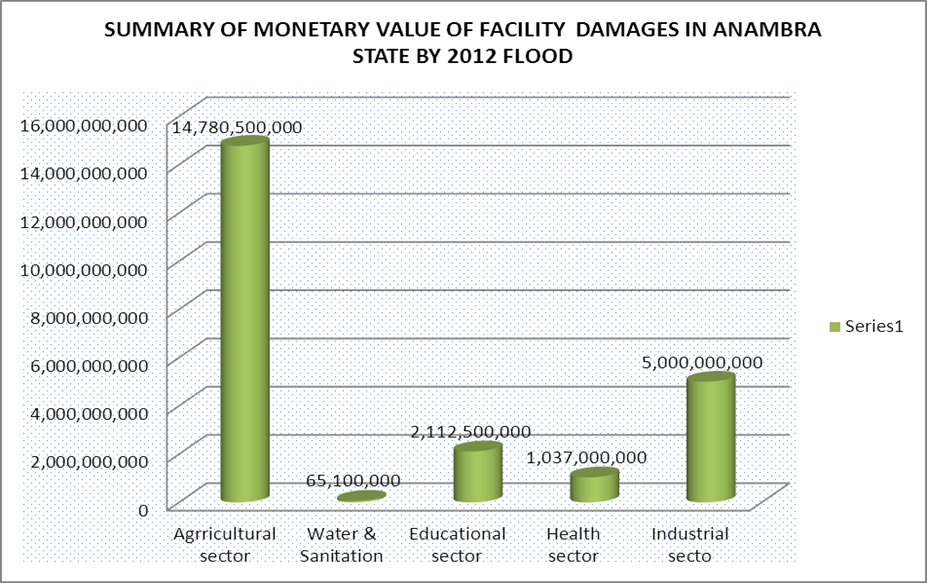 | Figure 3.4. Monetary values of facility damages in Anambra state |
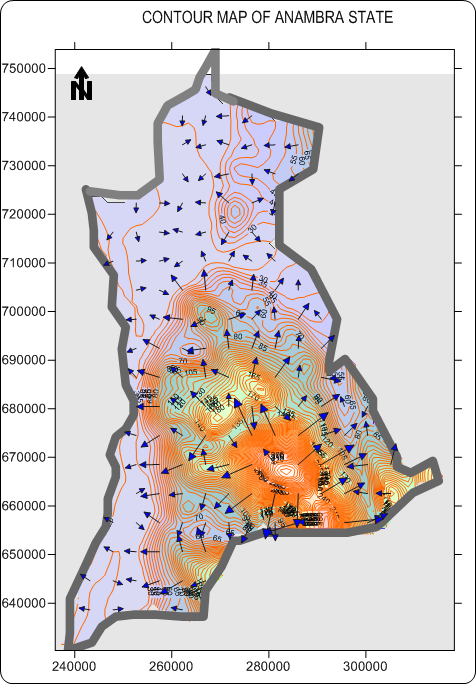 | Figure 3.5a. Contour and Flow Model of the Study Area |
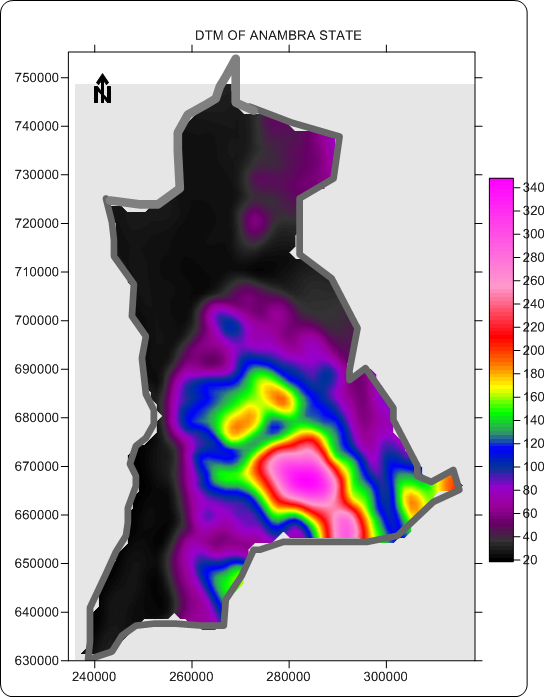 | Figure 3.5b. DTM of the Study Area |
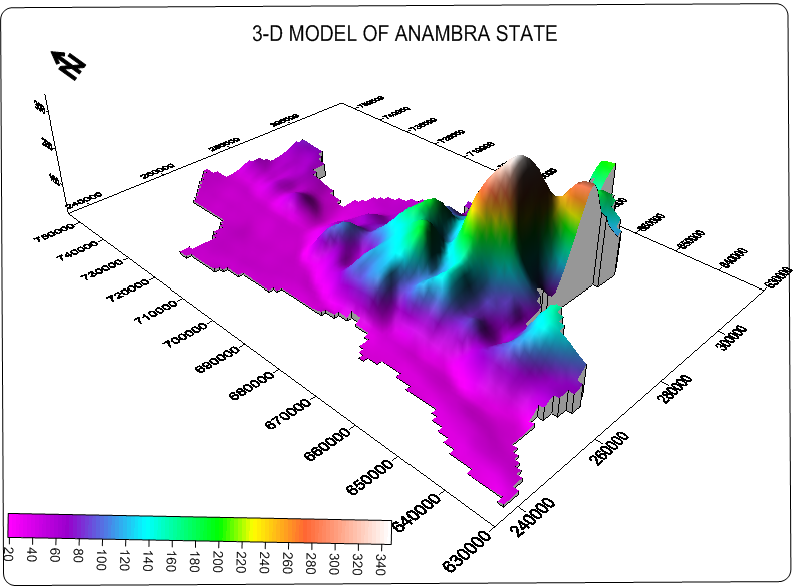 | Figure 3.5c. 3-D Model of the Study Area |
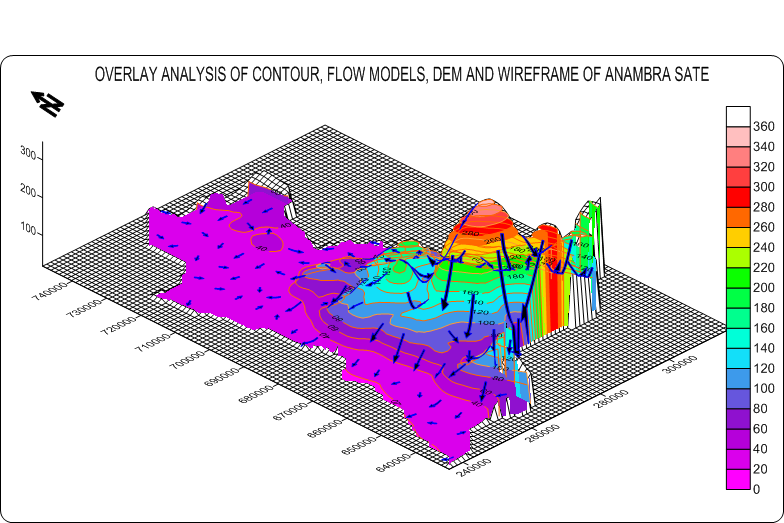 | Figure 3.6a. Overlay Analysis of Wireframe, DTM and Flow Models of Anambra |
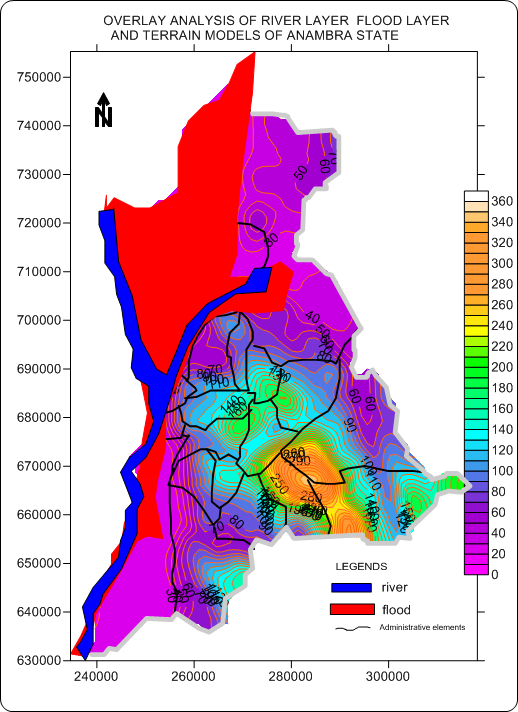 | Figure 3.7a. Overlay analysis of the river layer, flood layer and DTM in 2-D |
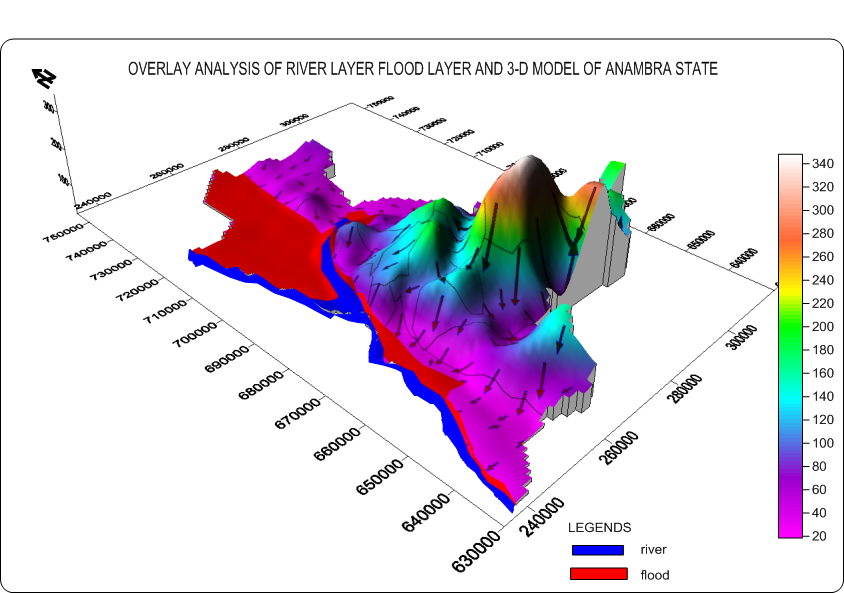 | Figure 3.7b. Overlay analysis of the river layer, flood layer and DTM in 3-D |
 | Figure 3.8a. Hazard map based on proximity to the river |
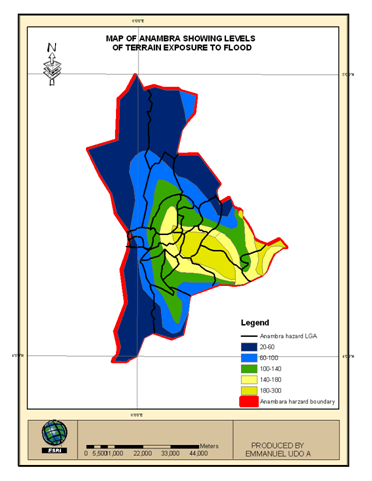 | Figure 3.8b. Hazard map based on elevation |
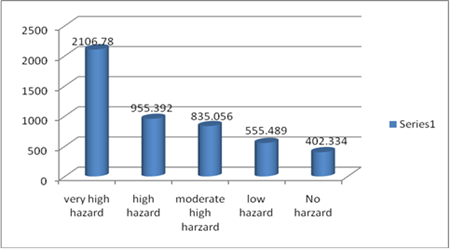 | Figure 3.9a. Areas of land occupied by hazard categories in Anambra state |
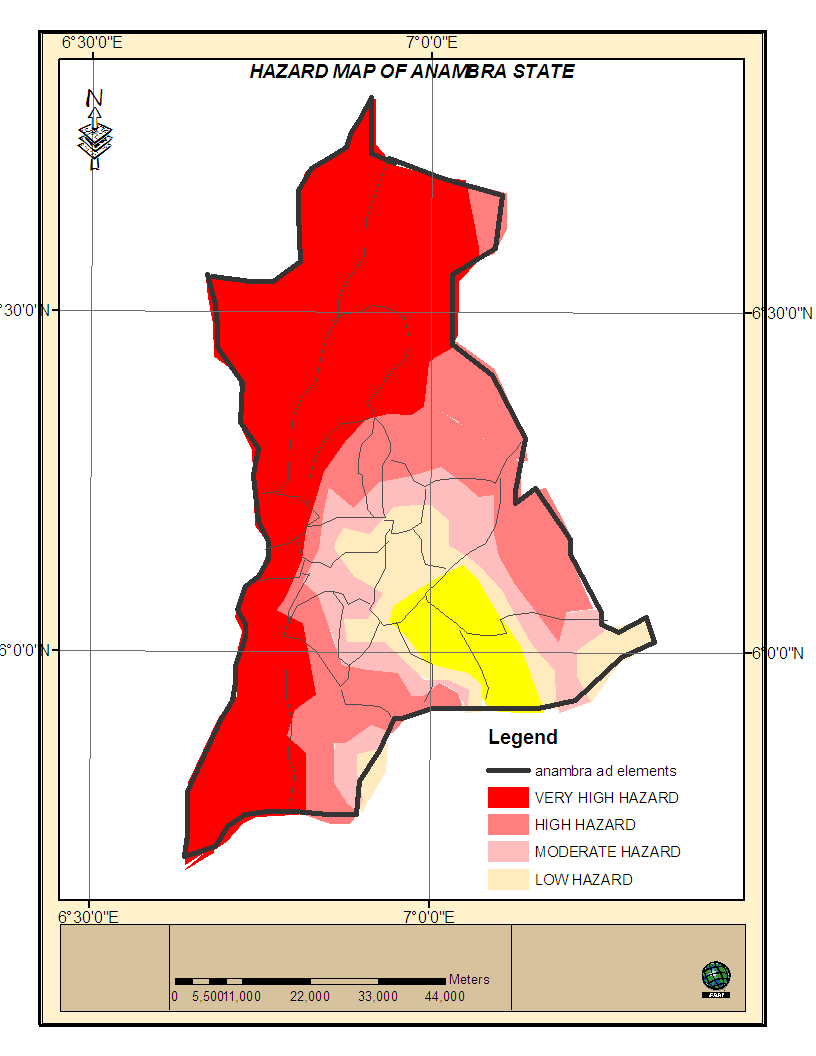 | Figure 3.9b. Harzard map of Anambra state |
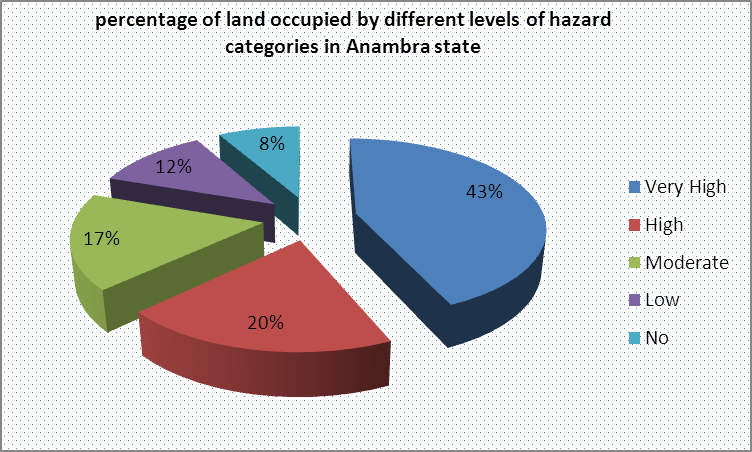 | Figure 3.9c. Percentages of area of land occupied by hazard categories |
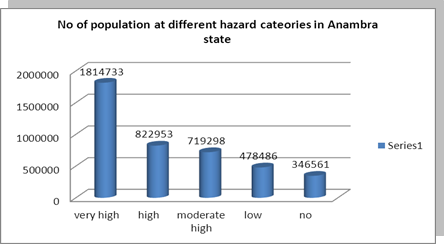 | Figure 3.9d. Population Residing At Different Hazard Zones |
4. Discussion of Result
X,Y,Z point data generated from the SRTM was resampled and contour map and DTM shown in (Figure 3.5a and b) was generated. The DTM clearly shows that the elevation decreases towards the river with elevation range of between 20m and 350m above mean sea levelFigure 3.6a and 3.7b, are the over lay analysis of DTM and flow models of the study area. Both maps show that flow direction and negative slope direction are towards the river Niger and Anambra river basins there by exposing these areas vulnerable to higher risk of flood.Figure 3.4 is the Risk map of the study area. It clearly shows that areas closer to river Niger are highly vulnerable to flood hazard with hazard intensity decreasing towards the Eastern part of the study area. A comparison of the hazard map (fig 3.9b) and 2012 flood extent map of the study area in (fig 3.2) shows that areas flooded in 2012 disaster are areas depicted as high hazard in the risk map.Quantitatively, the flood hazard analysis shows that the very highly hazard places covered 2106.78km2(43.40%), high hazard paces covered 955.392km2(19.68%), moderately hazard covered 835.054km2(17.20%), The lowly hazard areas 555.48km2 (11.44%) and no hazard covers 402.334km2 (8.29%) see fig 3.9a.Also, fig 3.9d revealed A total number of 1814733 (43.40%), 822953 (19.68%), 719298 (17.20%), 478486 (11.44%), and 346561 (8.29%) are residing at very high, high, moderately high, low, and no hazard zones
5. Conclusions and Recommendations
Flood risk mapping is a vital component for appropriate land use planning in flood-prone areas. It creates easily read, rapidly accessible charts and maps that can facilitate administrators and planners to identify areas at risk and prioritize their mitigation and response efforts. The central aim of this study is the Analysis of Flood hazard and damage assessment of 2012 flood in Anambra state using Geo-spatial techniques (remote sensing and GIS). It has demonstrated the use of AHP technique with GIS-based overlay analysis to determine spatial flood hazard levels in Anambra state whereby different hazard inducing factors have been used. The study reveals that due to closeness to rivers, low relief and lack of proper urban planning, some areas in the study area was found to be highly vulnerable to flood hazard.
5.1. Recommendations
In response to the re-occurring flood events in lokoja and in Nigeria as a whole, there is the need for− Continual hazard Mapping of cities in Nigeria.− There is the need for improved land Use Planning in the study area.− flood monitoring and management should be encouraged and funded by government and non- governmental agencies
References
| [1] | Nancy Carlin, (2011) Geospatial Mapping Analysis Of Flood Hazard Levels In Ajeokuta, Nigeria. Journal Of Environmental sciences, vol. 4 (3), PP 28-39. |
| [2] | Olajuyigbe, E A, (2012) Mapping And Analysis Of 2012 Flood Disaster In Edo State Using Geospatial Technic. Journal Of Environmental sciences, vol. 6 (5), PP 32-44. |
| [3] | NWAFOR A.N, Flood Extent Mapping In Bayesa State, Naigeria. Journal of Geography, Vol. 8 (33), pp 18-29. |
| [4] | Ologunorisa, E. T. (2004). An Assessment of Flood Vulnerability Zones in the Niger Delta, Nigeria. International Journal of Environmental Studies, Vol. 61(1), pp. 31-38. |
| [5] | Felix Ndidi Nkeki (2013). Geospatial Techniques for the Assessment and Analysis of Flood Risk along the Niger-Benue Basin in Nigeria, Journal of Geographic Information System http://dx.doi.org/10.4236/jgis.2013. |
| [6] | MISNA-Missionary international news service agency. (2012) “Floods from North to South, Alarm for Crops,” 2012. http://reliefweb.int/report/nigeria/floods-north-south-alar. |
| [7] | Konwea Anthony Chuka. (2012) The Great Nigerian 2012 Flood: Part 1. Retrieved from Think Africa Press: editor@thinkafricapress.com. |
| [8] | Ministry of Environment. (2012) Flood Early Warning: June, 2012. Early Warning Center. |
| [9] | Sunday Ishaya 2009. mapping flood vulnerable areas in a developing urban centre of Nigeria Journal of Sustainable Development in Africa (Volume 11, No.4, 2009. |
| [10] | Barroca, L., 2006. Indicators for Identification of Urban Flooding Vulnerability. National Hazards Earth System, Science. 6: 553 – 561. |
| [11] | Ifatimehin O.O. and M.E. Ufuah, (2006). An Analysis of urban expansion and loss of vegetation in Lokoja Using GIS Techniques. Zaria Geographers, 17(1):28-36. |
| [12] | Ishaya, S., O.O. Ifatimehin, and C. Okafor, (2008). Remote sensing and GIS applicationin in urban expansion and loss of vegetation cover in kaduna town, Northern Nigeria. American-Eurasian Journal of Sustainable Agriculture, 2(2): 117-124. |
| [13] | Shreshia M S, Flood risk and vulnerability using GIS; Acase study of Nepal. |
| [14] | Akintola, F. O. (1978) The hydrological consequences of urbanization: A case study of Ibadan City. In: Urbanization Processes and Problems in Nigeria edited by P. O. Sada and S. O. Oguntoyinbo. Ibadan University Press, Ibadan. |
 Abstract
 Reference
 Full-Text PDF
 Full-text HTML