Carl Y. H. Jiang
Faculty of Science, Engineering and Built Environment, Deakin University, Victoria, Australia
Correspondence to: Carl Y. H. Jiang , Faculty of Science, Engineering and Built Environment, Deakin University, Victoria, Australia.
| Email: |  |
Copyright © 2015 Scientific & Academic Publishing. All Rights Reserved.
Abstract
This interdisciplinary research originated from bathymetric modeling is composed of two parts of exploring how vital bathymetric data are generated by synthetic aperture radar and then hidden into digital elevation models during the period of unwrapping phase in phase shifting interferometry and terrain mapping. The part 1 focuses on theoretically explaining how the electromagnetic fields emitted by microwave antennas installed in satellites interact with molecular structure of chemical compounds in a large scale polluted lake using chemical analysis such as nuclear magnetic resonance which is hardly involved and discussed in the world. In the part 2, the more instances are offered to prove that such a phenomenon in remote sensing and corresponding bathymetric data can be found from all lakes and rivers worldly. The detected depths of water bodies are also affected by both meteorological factors and environmental factors. The discoveries can be extended to sea coast, the tides and ocean salinity are extra factors to influence on bathymetric data. The sea floors near coast can be hopefully detected if such digital elevation models are supplied. Except for them, other important relevant facts are discovered in image processing. Hence, a series of water bodies locating at high places of hills are melt into remotes sensing imageries. They are too difficult to be found as well, but they must be considered inbothanalyzing results of remote sensing and implementing the corresponding geometrical calculation which can be widely used into diverse engineering applications, otherwise fatal errors could happen.
Keywords:
Bathymetric modeling, Chemical analysis, Digital elevation models, Electromagnetic fields, Environmental factors, Image processing, Lakes, Meteorological factors, Microwave propagation, Microwave imaging, Molecular communication, Molecular structure, Nuclear magnetic resonance, Ocean salinity, Optical imaging, Phase detection, Phase shifting interferometry, Radar imaging, Radar interferometry, Radar remote sensing, Remote sensing, Rivers, Satellites, Sea coast, Sea floor, Synthetic aperture radar, Terrain mapping, Tides,Water pollution
Cite this paper: Carl Y. H. Jiang , Uncover Fully Ignored Vital Bathymetric Data Mysteriously Hidden in Digital Elevation Model Combining with Remote Sensing Imagery (Part 2: Evidences of Globally Existing Bathymetric Data), American Journal of Geographic Information System, Vol. 4 No. 1, 2015, pp. 22-37. doi: 10.5923/j.ajgis.20150401.02.
1. Introduction
Reviews of Research in the Part OneIn the part 1 of this reseach, the existence of the bathymetric data hidden in DEM (Digital Elevation Models) was explained in theory in terms of the data of depths of water body when a fully polluted large scale lake was investigated. As indicated and demonstrated in the part 1, the instantaneous interaction between the molecules in the water body of lakes or rivers and electromagnetic fields generates the electrnomagmetric wave with the broadened frequencies. The broadened frequencies means that the signals have a wide range on spectra if all of them are able to be captured and shown.Generating these signals is influenced by many factors such as external physical factor: the strength of electromagnetic fields supplied by SAR (Synthetic Aperture Radar) and internal chemical environment: the components of molecular mixtures and their concentration in water body including temperature and pressure. It is very similar to the case of performing an analytical experiment in a laboratory. The most desired signals are able to be received by the antenna of SAR in the form of microwave. And then,the profile of water body is represented in the form of elevation, which is released in the process of building DEM. Nevertheless, above the process usually does not happen spontaneously. Because at most locations on the earth surface, the magnitude of the earth magnetic field is about 0.5 gauss more or less. Note 1 gauss equals 1×10⁻⁴ tesla (T). The modern SAR is capable of emitting more than 94 GHz microwave (thus 3.3604T) within a period of 1 ns.Compared it with 3.3604T, the electromagnetic effect of the earthon molecular mixtures in lakes and rivers can be ignored. In other words, without the powerful external electromagnetic fields emitted by the platform in space, it is impossible for human to manually obtain the inland bathymetric data on the surface of the earth so quickly and accurately. Of importance is that such a phenomenon ought to happen at any places on the surface of the earth in terms of the previouscase-based theoretical analysis in the part 1. In order to further prove it, in the part 2, the more instances are to be given and confirm a factthat this important phenomenon does exist everywhere as well asexplore the potential factors which affect detecting the bathymetric data.Objectives of Research in the Part TwoThe main task in the part 2 is to provide more instances to prove the theoretical explanations against the discovered phenomenon (thus the interaction between external electromagnetic fields and molecules in water mixtures to generate bathymetric data hidden in DEM). It is shown as follows.1. Present how bathymetric data are displayed from lakes, rivers and coast which are chosen from different parts of different countries in the world.2. Try to explain how bathymetric data are influenced by local factors such as season change and the geologic structure. Although these factors are not topic to be discussed in this research, they not only provide ones with unique feature to quickly identify the water body but also lead to serious errors in identifying water body in remote sensing imagery.3. Focus on how the properties of water mixture varies from inland to coast so as to conclude that bathymetric data of seawater near coast are also able to be gained if DEM in these areas are supplied.4. Illustrate some complex cases which may be required by other applications briefly.The remote sensing imageries and DEM used in this research as instances are supplied by both NASA and USGS. All remote sensing imageries were captured by USGS Landsat8, DEM (thus SRTM3) was made by NASA Shuttle. In general, the dates of remote sensing imageries being made are not supplied, besides the bathymetric data are seriously affected by season change, such as Lake Superior. The names of rivers and lakes as well as their geographic locations are given in the part 2.
2. Instances and Analysis
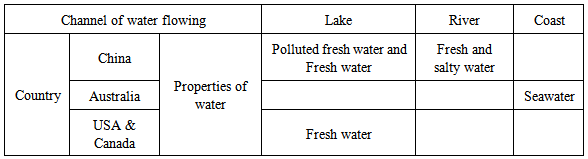
In order to demonstrate the preceding discussed phenomenon, which can exist in any fresh water bodies of lakes, rivers and seawater on the earth, several lakes, rivers and coast are random selected as investigated objects from different parts of different countries.As a matter of fact, such a phenomenon occurs in all lakes, lakes and coasts on the earth. However, many other instances fail to be represented in this paper due to the limitation of the publication size. But such a performance does not affect the quality of research because, at least, the elements of water H2O are the same on the earth.Consider the properties of water, thus components of water body, is one of important factors of how to influence the discovered phenomenon, they are also supplied. Nevertheless, the properties of water in the selected lakes, rivers and coast are determined by both their geographic locations and the discovered matters such as polluted water. The classified properties of them are briefly shown in Table 1. The further discussions against them are to be performed in the following subsections by grouping them into several cases.Table 1. Locations and water properties of selected instances
 |
| |
|
2.1. Fully Polluted Fresh Water Lake
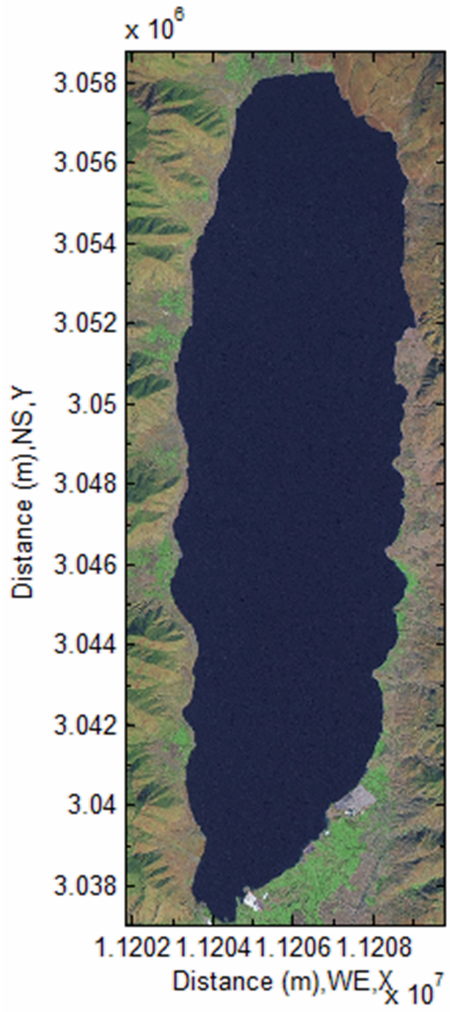
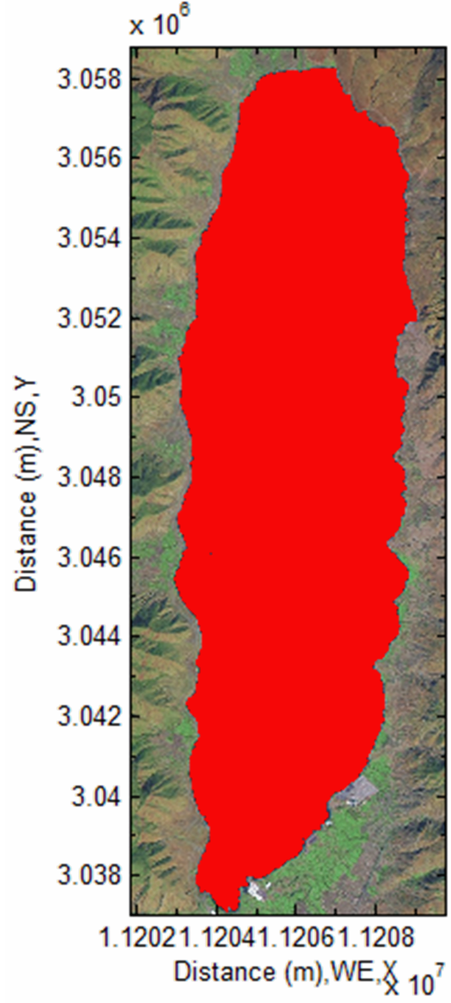
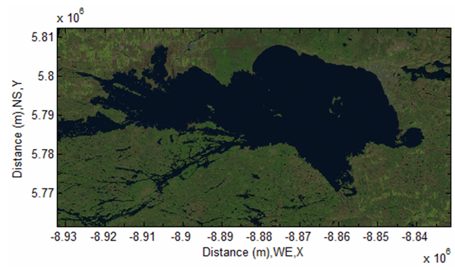
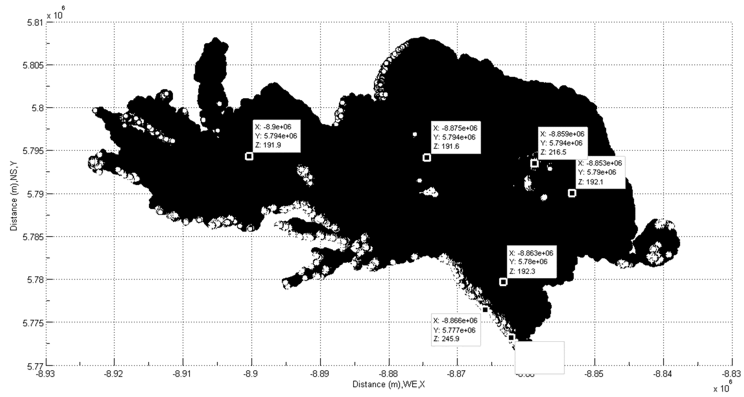
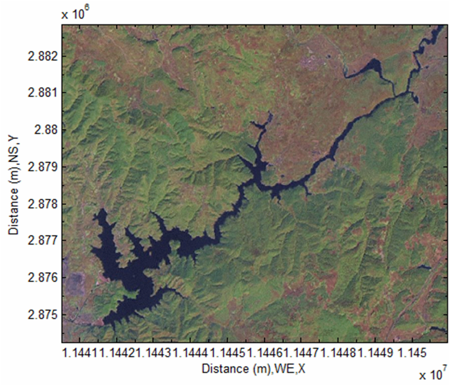
Fig. 1 shows a detected and fully polluted a large scale fresh water inland lake, which is located in China as follows.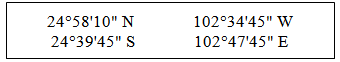
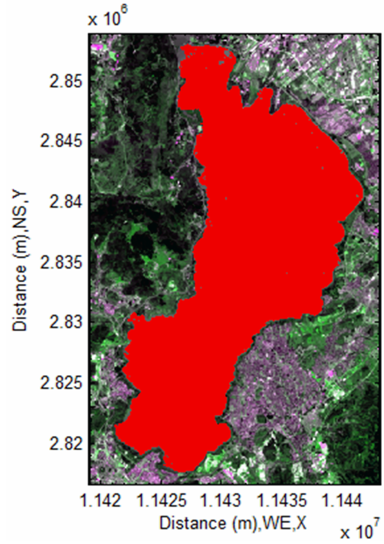 | Figure 1. The detected water body of a fully polluted lake (1249× 805) |
An attention should be drawn to letters in the box is that letter N, S, W and E is used to denote the direction of North, South, West and East respectively in this research. The combination of two letters in plotting is used to show the direction at local place only. The sign is also given by the convention.This case is already discussed in the part 1. However it has much of the representative, it is shown again. Its corresponding DEM is represented in Fig. 2. As to the technique of how the water is detected, the technique is already introduced in the part 1, it is not to be discussed in detail again.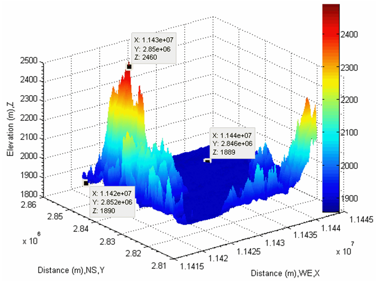 | Figure 2. The corresponding DEM of a fully polluted large scale lake (1249 × 805) |
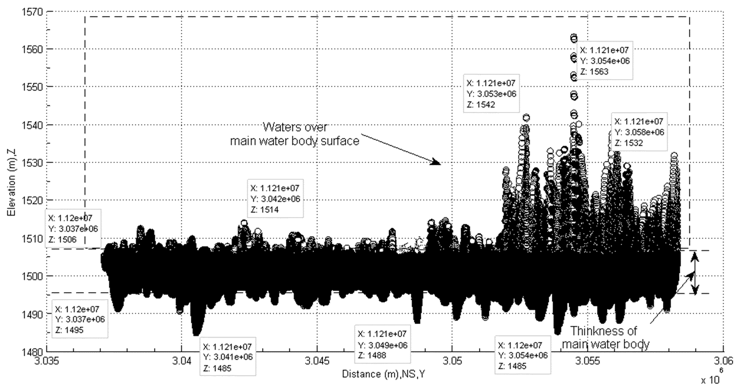
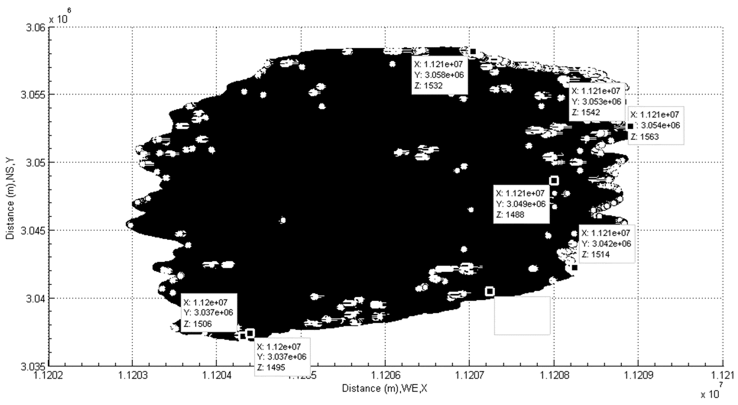
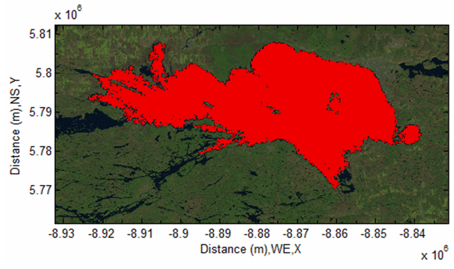
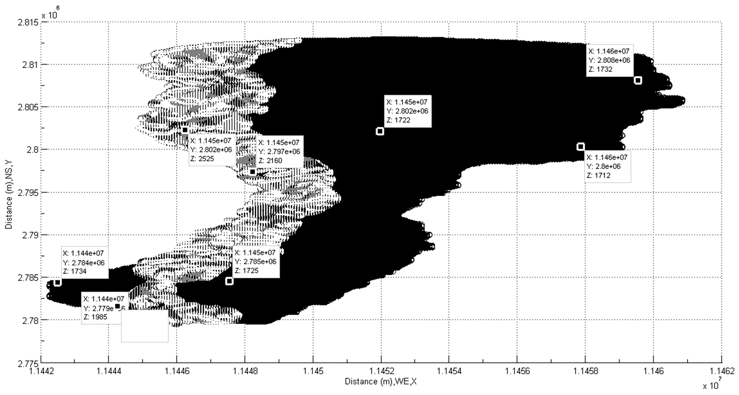
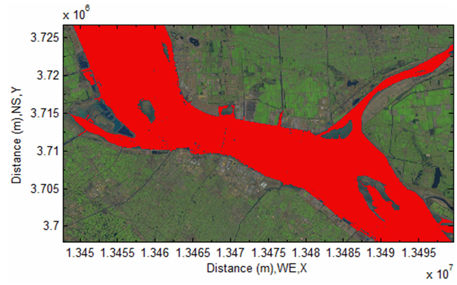
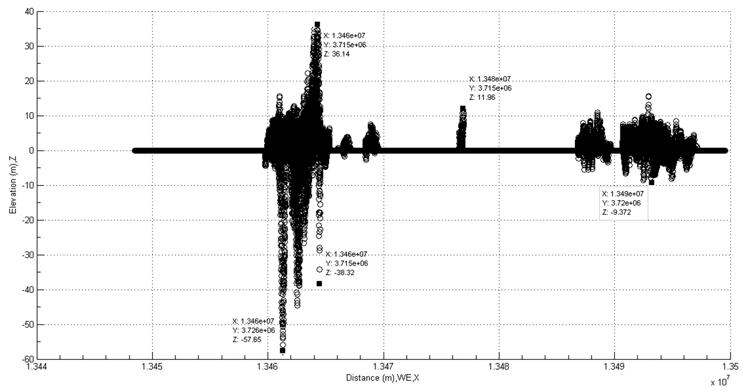
Very Important IssuesNevertheless, there are some very important issues which must be pointed out before illustrating given instances in the following subsections. A series of potential fatal errors or risks exist for researches who use the technique of the bottom albedo-independent bathymetry to map the depths of water body in the world. Those potential fatal errors or risks are easily to be found in the process of discovering the bathymetric data by means of integrating remote sensing imageries with their corresponding DEM and the unique technique created by author.It seems that all water is detected in terms of the one shown in Fig. 1. However, a fatal error or risk is hidden in the remote sensing imagery if users do not take much care of. Because a remote sensing imagery is two-dimensional matrix, thus all objects are projected onto a two-dimensional horizontal plane when the imagery is made by sensors installed in one platform such as satellite in space.In this case, applying the previously introduced technique in the part 1 into processing this remote sensing imagery, the result demonstrates a fact that the three parts of water body are clearly found from Fig. 3. This three-part water body is vertically located at three different levels respectively. If the waters positioning at the higher levels from the elevation of the main water body surface are taken into account in the process of measuring depths of water body as well as calculating the hydraulic parameters such as surface area, perimeter and volume , that must cause a fatal error. 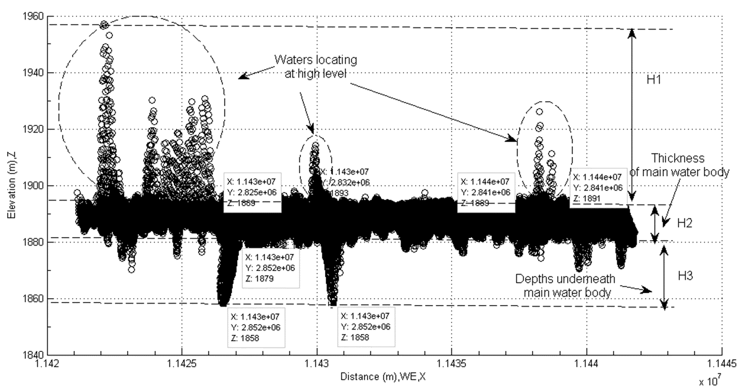 | Figure 3. Side view of detected water body in a fully polluted lake |
The manners of calculating relevant parameters of instances given in the part 2 can be found from author’s most recently published paper: Bottom-up Bathymetric Modelling in Investigating Quality and Quantity of Highly Polluted Water in Large Scale Inland Lake Using Remote Sensing Imagery and Digital Elevation Model [1]. The detailed manners and discussions are already provided in this research paper.As well-known, mathematically and physically speaking, the open-channel is always composed of a series of continuous spatial space where the fluid (water) flows inside it. The places of banks at any cross section could be one part area of steep hills. There must be several water bodies being located at different levels of the steep hills depending on different geographical locations. These water bodies can be thought as the water being originated from either rain or the melt snow. A large number of such phenomena can also be found in the following process of seeking for the existences of depths of main water bodies in the inland lakes or rivers.On the other hand, the concept of bottom albedo-independent bathymetry is based on one remote sensing imagery. Its fundamental concept including relevant technique relies on an ideal assumption that treats the bottom of lake, river and near-coast as a flat plain. Because of this assumption, albedo of light reflected from water body has nothing with the geometric shape of bottom. The depths of water body are calculated by an empirical formula.Such an optical-imaging-based concept has been adopted and developed by thousands researchers in diverse investigations for many years in the world [2-11]. Furthermore, according to the indication shown by the popular commercial package such as ENVI® (Toolbox: SPEAR Relative Water Depth), this potential risk is also spread into it as one reliable technique introduced to international users. Even more, such a technique has somewhat been approved by NOAA.Of course, this hidden error is too difficult to be discovered by researchers in the world only relying on two-dimensional remote sensing imageries. In other words, as uncover the bathymetric data hidden in DEM, the unique technique created and introduced in the part 1 by author is also required to verify such potential errors or risks hidden in remote sensing imageries when the lakes or rivers are investigated by using the remote sensing imageries. Loosely speaking, the satellite sometimes provides human with misleading information if researchers do not treat remote sensing imageries carefully. The data users must verify them before being used.
2.2. Large Scale Unpolluted Fresh Water Lake with Rough Bottom
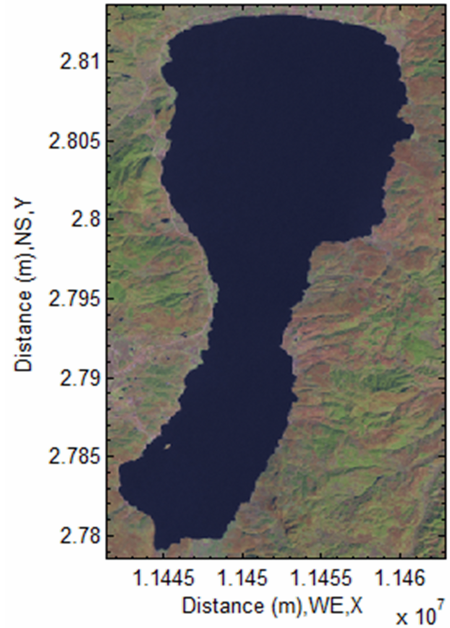
The word “unpolluted” certainly indicates that the fresh water in lake is not polluted by human, and the word “rough” means that the shape of the bottom of lake is very irregular, which has already formed by the long-term internal motion of the earth. The latter is treated as a remarkable feature to quickly identify the bathymetric data of fluid (water). However, there could be some natural organic or inorganic substances in such a lake. They remains in the lake in the natural state of polar molecules or ions.A fresh water lake with above features shown in Fig. 4 is named as Cheng Hai and located in China as follows.
 | Figure 4. Remote sensing imagery of Cheng Hai (2415×884) |
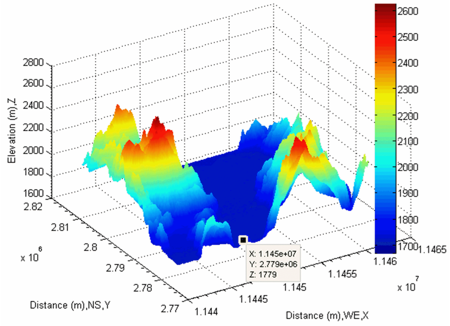
The corresponding DEM and detected water body is represented by Fig. 5 and Fig. 6 respectively. Similarly, this lake can be grouped into three parts according to the vertical profile in Fig. 7. The waters located at high positions can be easily found from Fig. 8. According to the topographic feature of water body at the bottom of lake and a fact that water is fluid, it is easy to prove that all of bathymetric data in this lake are already detected. 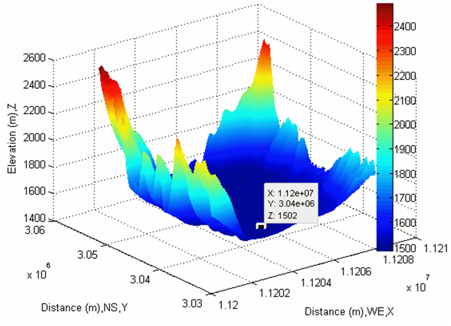 | Figure 5. DEM of Cheng Hai (2415×884) |
 | Figure 6. Detected water body of Cheng Hai (2415×884) |
 | Figure 7. Side view of water body in Cheng Hai |
 | Figure 8. Top view of water body of Cheng Hai including waters locating at high levels |
The average depth of water body could be 10 meters more or less, the maximum depth may be 31 meters on the basis of the information supplied by Fig. 7. However, as already specified, the focus in the part 2 is on proving that the existence of depths of water body rather than discussing how to measure and calculate them accurately. The given figures not only prove the existence of bathymetric data but also indirectly show the strength of electromagnetic fields. In short, this instance tells a fact that the depths of water body in a lake where the place having a higher elevation in the plateau undergoes abit high temperature of local weather are able to be completely detected by the microwave emitted by the antenna installed in a platform.
2.3. Large Scale Unpolluted Fresh Water Lake with Flat Bottom
The water depths of large scale lakes discussed above are very obviously observed and confirmed according to the shape of bottom. However, sometimes it may be difficult to confirm the depths of water body for some specific cases based on above experience. Two following cases have a similar feature, thus the shape of bottom looks flat. They are to be discussed separately according to their individual cases as follows.A large Scale Fresh Water Lake Seriously Influenced by Season ChangeThe lake shown in Fig. 9 is named Lake Superior which has the following geographic location:
 | Figure 9. Remote sensing imagery of Lake Superior (1265×2518) |
The corresponding DEM and detected water body is shown in Fig. 10 and Fig. 11 respectively.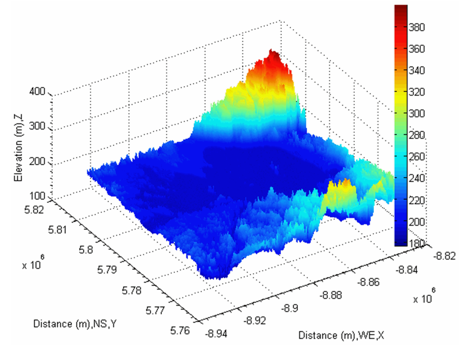 | Figure 10. DEM of Lake Superior (1265×2518) |
 | Figure 11. Detected water body of Lake Superior (1265×2518) |
According to the information supplied by Fig. 12 and Fig. 13, this lake is surrounded by a series of steep hills. Average thickness of the main water body is approximately from 8 to 9 meters. However, the depths of water body may not be confirmed straight away as two cases shown above because firstly the bottom looks a bit flat compared it with above two cases, secondly the depths of water body is seriously affected by season change. Maybe the doubt is an excessive consideration. Actually the fact is that 1. Lake Superior is the largest of the Great Lakes of North America. The lake is shared by Canada and the United State. The thickness of main water body is significantly influenced by season change because the fresh water flows into the lake mainly from the melt snow located at neighboring hills through the valleys. In spring, the snow starts to be melt by absorbing more and more solar energy. The fresh water of melt snow flowing from valleys does not have much momentum to impose onto the bed of bottom due to no large slopes. 2. The supplied thickness of the main water body is based on the date of the remote sensing imagery being made, thus in this case, the publication date: 2014 October 22, which was captured by USGS Lands at 8. This season tells that the thickness of water body in Lake Superior could be minimum. In winter, the surface of water body is to be iced, there is no bathymetric data of the main water body to be found. In the coming spring, 2015, the depths of water body start to increase and then drop to the minimum content in autumn before winter. The marks of waters which are adjacent to the main water body indicate this approach of the level of water body which alters with respect to the season change (see Fig. 11). 3. But the water bodies remaining at high levels of hills may be less affected by the variation of depths of water body in the lake (see Fig. 12 and Fig. 13).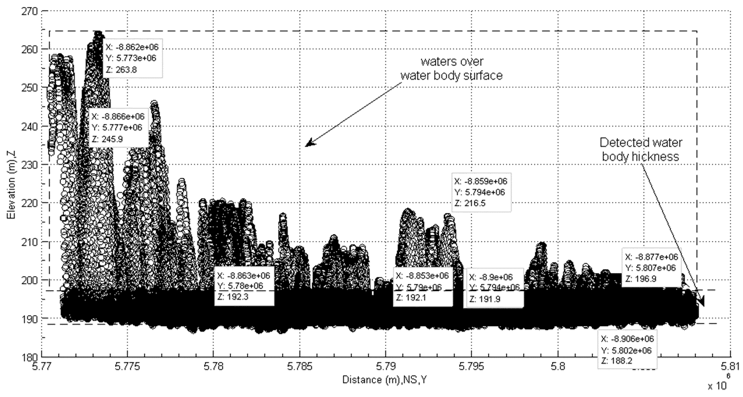 | Figure 12. Side view of main water in Lake Superior |
 | Figure 13. Top view of main water body containing waters at high levels in Lake Superior |
In short, the depths of Lake Superior is detectable using the microwave. They are seriously influenced by season change. Of importance is that, mathematically speaking, the depth of the lake including water surface area, perimeter and volume is a function of season (time). The information obtained from easily calculating them is very useful for fishery and other relevant industries. This manner by choosing one local remote sensing imagery which was made at local time can replace the one being used by NOAA thus using LIDAR to forecast the altering level of water. The notable feature of using proposed manner is easier, cheaper, quicker and more accurate. A large Scale Fresh Water Lake with High Elevation and Vertically Split into Two PartsIn Yunnan province of China, there are several large scale lakes having high elevations. Fu Xian Lake (see Fig. 14) is one of them, which has the following geographic location:
 | Figure 14. Remote sensing imagery of Fu Xian Lake (460×280) |
The detected water body and corresponding DEM is shown in Fig. 15 and Fig. 16 respectively. This lake has an obvious feature, thus about one fourth of water surface is located at the top area of hill being adjacent to the main water body. The vertical difference of distance is approximately 790 meters in terms of Fig. 17. Therefore it looks that the lake is split into two parts. One part seems positioned in sky and another is located at ground. 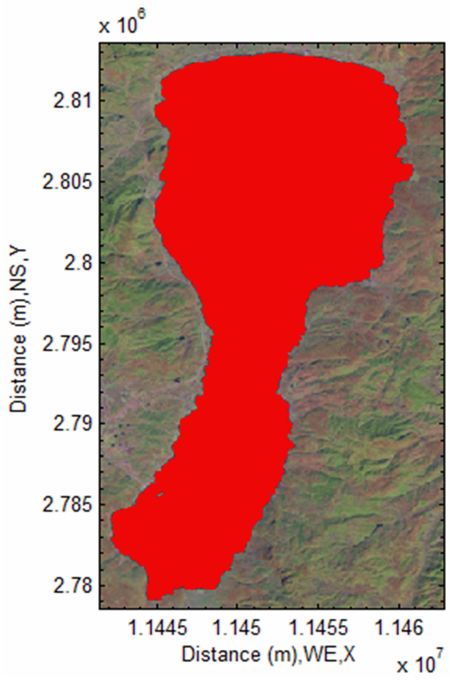 | Figure 15. Detected water body in Fu Xian Lake (460×280) |
 | Figure 16. The Corresponding DEM of Fu Xian Lake (460×280) |
However, on the other hand, it clearly tells that the surface area of this lake cannot be calculated by purely using the remote sensing imagery shown by Fig. 14 if it is not verified by Fig. 17 and Fig. 18.Another feature of this lake is that the main water body at the lower level looks flat, it may be difficult to know how it was formed due to the motion of earth’s inner structure more than billons years ago. Nevertheless, the thickness of the main water body can be estimated by Fig. 17. In this case, the mean thickness of water body at the ground level is roughly 20 meters. 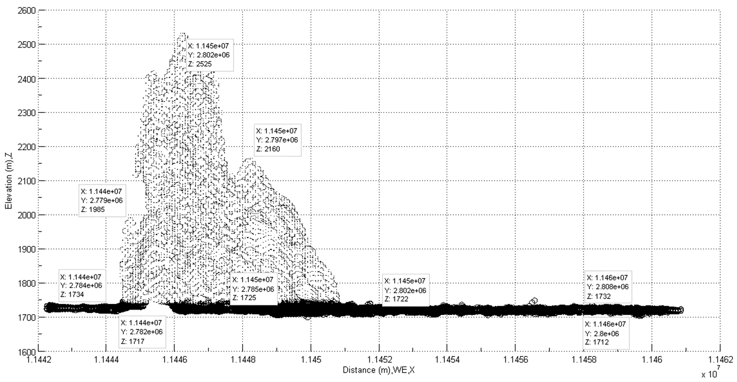 | Figure 17. Side view of water body containing waters locating at adjacent hills in Fu Xian Lake |
 | Figure 18. Top view of main water body including adjacent hills with waters in Fu Xian Lake |
2.4. Brief Summary for Large Scale Lakes
As seen from the preceding subsections, no matter whether the water is polluted by human or influenced by season change, there is always a mean thickness for individual lake. At this stage, it may say that the thickness of the main water body is created and decided by a physical phenomenon, thus the interaction between the polar molecules of water which is the main component in water mixture and the powerful external electromagnetic fields. The climatic factors or environmental factors such as rain or snow only affect the physical magnitude thus the depth of water body rather than the detected depth of water body which is only influenced and determined by the intrinsic physical or chemical properties generated by this physical phenomenon. However, the environmental factors seriously affect the optical imaging. In the case of Fu Xian Lake, the massive waters spreads on the surfaces of the adjacent hills, it looks like a lake having a large number of water surface if simply observed by Fig. 14. Fortunately, the microwave mitted by SAR is less influenced by environmental factors. Those water bodies are then able to be identified and cut off in the calculation. In the following subsections, such a fact is to be continuously proved by river -based instances. However, the attention should be drawn is that this research is not discussing how to classify lake or river. The classification may not be so strict, but it does not affect the quality of the research.
2.5. Inland Fresh Water Lake
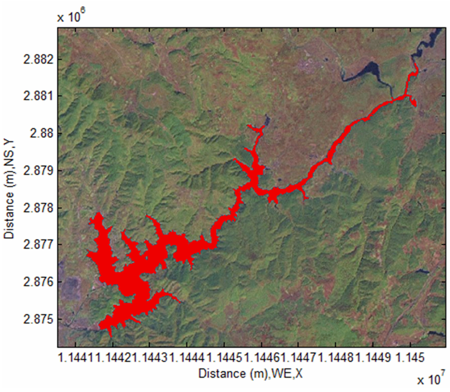
Fig. 19 shows a long distance lake or it may be said as a river because it has a resource from the upstream. It is now used as a reservoir, it is called Yun Long Reservoir. It locates at the following geographic location: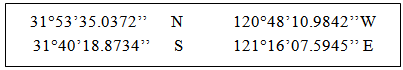
 | Figure 19. Remote sensing of Yun Long Reservoir (1076×1307) |
The corresponding DEM and detected water body is represented by Fig. 20 and Fig. 21 respectively. Due to a long distance (over 100 km), a series of water bodies distribute along two-side banks, except the main water body flowing in the open-channel in the manner of the alternate up-down (waving) (see Fig. 22 and Fig. 23). Although it is not so simply to assess the main water body as did for previous lakes with obvious horizontal levels, an easier way to confirm the main water body in such a case is that the place having darker colour is the spatial location of main water body in open-channel (see Fig. 22). This is because all spatial points of detected water bodies are projected on the same two-dimensional plane, but it is better to project them onto either the Z−X plain or the Z−Y plain. In other words, the more spatial points are projected onto one zone at the same plane, the darker the colour of the zone is. The detected main water body has the most spatial points, therefore, of course, the projected zone having the darker colour belongs to the main water body. In contrast, the projected and spare zones having lighter colours belong to the water bodies locating at the surfaces of hills being adjacent to the main water body in the lake.Anyway, the water body in a long-distance lake and river eisable to be detected and confirmed very quickly in this way.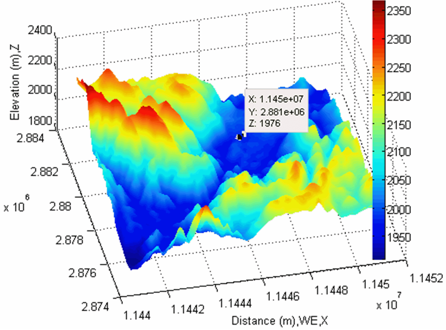 | Figure 20. The corresponding DEM of Yun Long Reservoir (1076×1307) |
 | Figure 21. Detected water body of Yun Long Reservoir (1076×1307) |
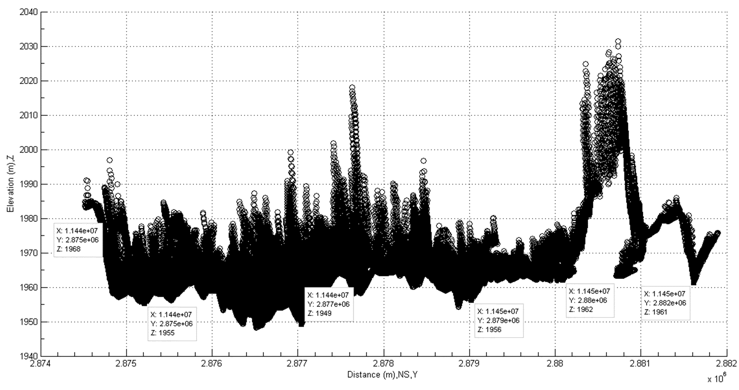 | Figure 22. Side view of detected water body in Yun Long Reservoir |
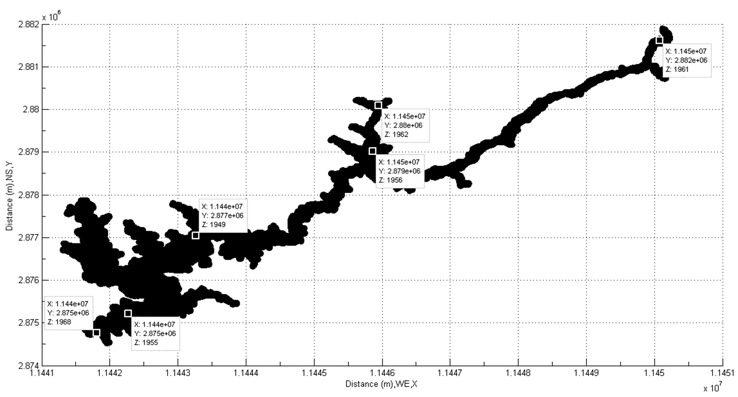 | Figure 23. Top view of detected water body in Yun Long Reservoir |
2.6. Fresh and Salty Water River
From now on, exploring depths of water body is to be implemented from the inland to the coast. Fig. 24 shows one part of Yangtse River or say Chang Jiang, which is located at the exit to East China Sea. The fresh water flowing from the upstream always mixes with the tide coming from East China Sea. The components of water mixture in this part of the river could be more complicated than the ones in other rivers. In addition to water and salt, it also contains massive mud and other substances from the upstream. Its geographic location is shown as follows. | Figure 24. Remote sensing imagery of one part of Yangtse River at the exit to East China Sea (824× 1482) |
 The corresponding DEM and detected water body is depicted by Fig. 25 and Fig. 26 respectively.In this case, the mean depths of river may be 2 meters approximately according to the information given by Fig. 27 and Fig. 28. However, of importance is that a cave having 57.65 meters deep and locating in the river is detected. This is a very valuable figure to prove a fact the polarization of molecules is a quick process of transport like the heat conduction, which may be able to reach to a deeper place when a powerful external electromagnetic fields is applied into them.
 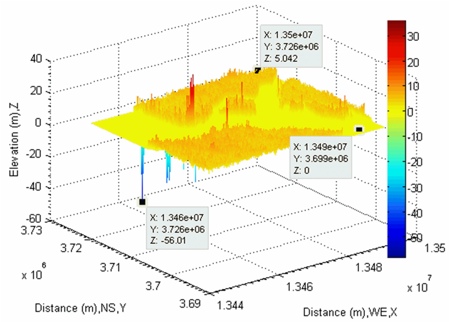 | Figure 25. Corresponding DEM of one part of Yangtse River at the exit to East China Sea (824× 1482) |
 | Figure 26. Detected water body of one part of Yangtse River at the exit to East China Sea (824× 1482) |
 | Figure 27. Side view of detected water body of Yangtse River at the exit to East China Sea |
 | Figure 28. Top view of detected water body of Yangtse River at the exit to East |
2.7. Seawater Lake and Coast of Ocean
As clearly seen from Fig. 29, several seawater lakes being adjacent to the Pacific Ocean are located at Australia east coast. The geographic location of them is as follows:
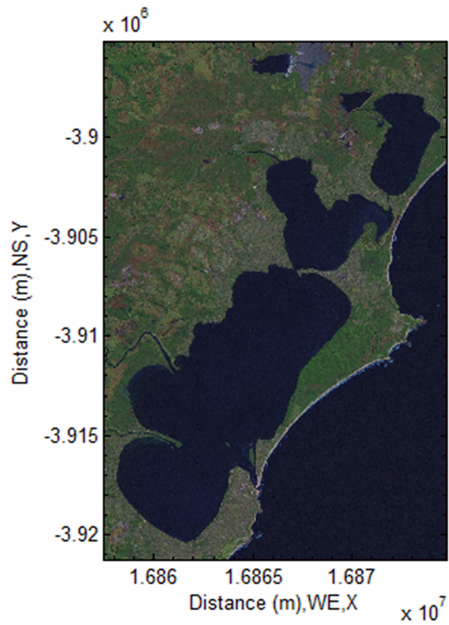 | Figure 29. Remote sensing imagery of Australia East Coast (2899×1916) |
The corresponding DEM and detected water body is illustrated by Fig. 30 and Fig. 31 respectively. 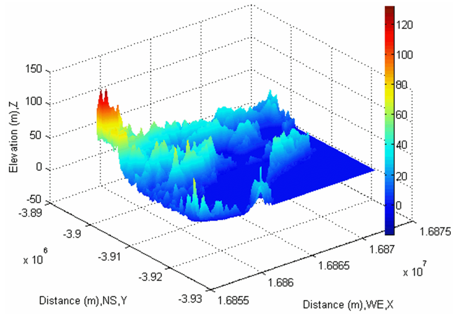 | Figure 30. The corresponding DEM of Australia East Coast (2899×1916) |
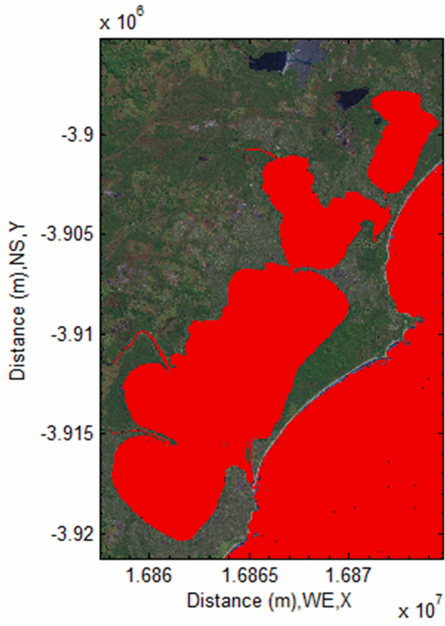 | Figure 31. Detected seawater body in Australia East coast (2899×1916) |
The depths of seawater in the lakes are easily detected as did inland fresh water lakes. The detected seawater flows into and out of the lakes with tides or ocean waves. In addition to the polar molecules: water, ocean salinity becomes another important physical parameter to influence on measuring bathymetric data. As mentioned in the part 1, sodium chloride (NaCl) can be disintegrated as the Na+ and Cl− ions surrounded by the polar water molecules. Those molecules and ions are excellent chemical substances to generate a broadened spectrum while the powerful external microwave is applied into them. In fact, there are many other inorganic or organic chemical substances in seawater. Thus, in turn, those substances enhance the functionalities of detecting bathymetric data using microwave.However, of much interest and importance in this case is that several depths of sea water at near coast are detected as well. These data are luckily obtained and displayed. The reason why these valuable data are luckily obtained is that they successfully escaped from human-made classification. Strictly speaking, these bathymetric data ought to belong to one part of bathymetric data in the Pacific Ocean. However, it is impossible for NASS to very clear and strictly get rid of them in terms of both convention of DEM and the concept of coast. The possible reasons are those:1. DEM is based on the level of sea, thus the elevation of sea is defined as zero by human. However, it is very difficult to confirm the exact boundary. Thus, which part of seawater can be exactly treated as zero elevation?2. From the angle of the coast edge, it is a very difficult mathematical problem to specify a line between the solid edge and seawater.3. Accidently detecting bathymetric data is a physical behaviour designed by human for other purpose. However, the measured bathymetric data naturally exist without obeying human’s will. In other words, the most similar bathymetric data do exist but are already filtered off before DEM is published by important organization such as NASA.Nevertheless, of importance is that, based on above fact, it can be further derived that 1. The bathymetric data near coast must exist.2. These sea-level based bathymetric data may be distributed within the width of 0 to 5km (even more) commencing from the edge of coast along the line of coast. Because, generally speaking, the depths of sea floor increases gradually near coast. 3. The width supplied above is a forecasted range in terms of the figures discovered from above investigated instances. In this case, for example, one depth (12.82 meters) in Pacific Ocean is detected (see Fig. 33).4. If this part of sea-level-based DEM is able to be supplied, the corresponding bathymetric data of sea or ocean should be obtained by using the technique created by author. 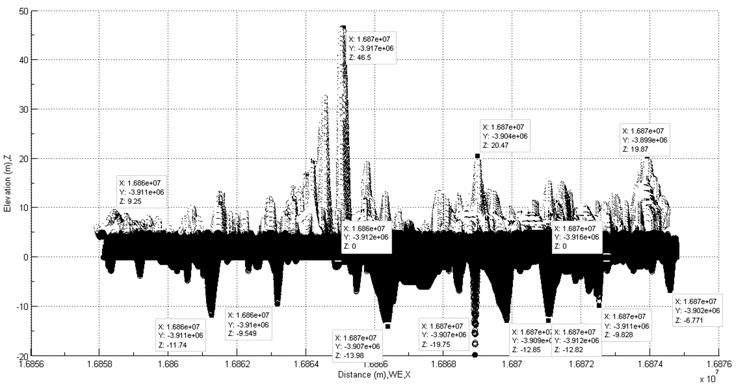 | Figure 32. Side view of detected seawater body in Australia East Coast |
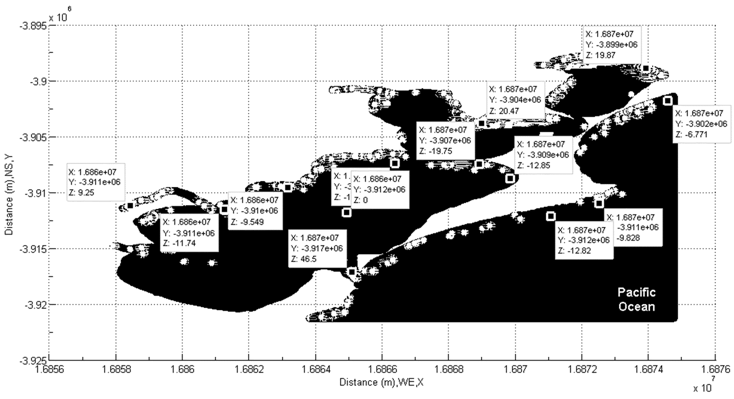 | Figure 33. Top view of detected seawater body in Australia East Coast |
3. Conclusions
In the part two, several instances are selected from different countries to prove the existence of discovered phenomenon in the world. Approved FactsAs seen from the supplied instances, the following concerned topics can be confirmed: 1. The crucial and arcane bathymetric data hidden in DEM do exist in all lakes and rivers in the world.2. The similar data of sea or ocean near coast can be found as well.Extra DiscoveriesThe following extended discoveries are also found and very important.1. In the most cases, there are a series of the suspended water bodies are located at surface areas of hills which are along and adjacent to the lakes. These parts of water bodies are vertically projected and melt into the main bodies in the remote sensing imageries captured by the sensors from space. Accordingly the surface areas of main water bodies at ground are “enlarged”. If they are not considered or trimmed off separately, there must be huge errors happening in the process of the geometrical calculation. However, such risks hidden in the two-dimensional remote sensing imagery are too difficult to be found by researchers in the world unless the suspended water bodies are verified in the corresponding three-dimensional DEM using author’s proposed technique. Unfortunately many approaches in this field are purely based on the two-dimensional remote sensing imageries. Accordingly, the results are in fact unreliable. 2. The bathymetric data hidden in sea-level based DEM near coast of sea or ocean should be able to be discovered as well if these areas of DEM are supplied. However, such a vital phenomenon has not been realized by the main DEM provider such as NASA or USGS so far, there is no chance to verify these bathymetric data in large scale at this stage. According to the theoretical discussions in the part 1 and the maximum detected depth (57.65 meters) from one instance in the part 2, it can be well forecasted that deeper depths of seawater should be obtained in the same manner.Significances of DiscoveriesThese discoveries are full of the significances, whose potential applications can be depicted as follows:1. The bathymetric data of lakes and rivers can be easily detected in this manner and cost less. A typical example is that in order to obtain the bathymetric data of Great Lakes and coast, NOAA is using expensive laser to measure them [12]. If this manner is applied into investigation, it can not only save a lot of money and time but also forecast the variation of depths of water body in Great Lakes with respect to season change.As a matter of fact, over thousands lakes and rivers and over million kilometres length of coast in the world do not have accurate bathymetric data or even completely do not have. That directly results in the failure or difficulties of development. 2. Unfortunately, massive long-term researches performed by researchers in the world remain at the superficial level in this field, even a lot of incorrect results and several incorrect algorithms have been produced by researchers based on incorrect data analysis caused by a fact that the satellites sent human massive miss-leading information. Of course, this is not fault of satellite. It is only a space-flying physical advice designed by human. The problem is that human should be re-consider the manner of how to effectively and accurately utilize the data of remote sensing. The evolution in this field should start from traditional two-dimensional remote sensing imagery-based research to the research with a feature of highly integrating optical and radar remote sensing with other interdisciplinary knowledge so as to avoid massive human-made errors.3. Once the bathymetric data are obtained, other hydraulic parameters such as surface area, perimeter and volume are also gained by calculation combining with other techniques. The values of them are very useful and important in further development such as managing the treatment of water pollution, floodplain, hydraulic project design, and fluid dynamics investigation and so on. Difficulties in Extracting Engineering Data from Discovered DataHowever, there are several difficulties in the process of extracting the bathymetric data from elevation-based data and then calculating the extended parameters based on the extracted data. They are listed as follows.1. As seen from supplied instances, a series of the suspended water bodies are also detected and located at the high places next to the main water bodies at the ground level. How to trim them off becomes one of difficulties.2. Another difficulty is that how to effectively and accurately calculate a volume of a long distance river or lake with very rough bottom of main water body, hence the shape of bottom varies in the manner of both zig-zag and remarkably waving.Proposed Solutions to DifficultiesThe some proposed resolutions to above difficulties have been introduced in author’s other research paper [1]. Suggest ones to read it. The relevant calculations are quite convenient to be achieved if the knowledge of both digital image processing and computational geometry is applied into above instances and the water bodies are properly chosen in calculating the volumes of water bodies.
References
| [1] | Jiang, C.Y.H., Bottom-up Bathymetric Modeling in Investigating Quality and Quantity of Highly Polluted Water in Large Scale Inland Lake Using Remote Sensing Imagery and Digital Elevation Model. American Journal of Environmental Engineering, 2014. 4(5): p. 117-141. |
| [2] | Fonstad, M.A. and W.A. Marcus, Remote sensing of stream depths with hydraulically assisted bathymetry (HAB) models. Geomorphology, 2005. 72(1–4): p. 320-339. |
| [3] | Garcia, R.A., P.R.C.S. Fearns, and L.I.W. McKinna, Detecting trend and seasonal changes in bathymetry derived from HICO imagery: A case study of Shark Bay, Western Australia. Remote Sensing of Environment, 2014. 147(0): p. 186-205. |
| [4] | Jay, S. and M. Guillaume, A novel maximum likelihood based method for mapping depth and water quality from hyperspectral remote-sensing data. Remote Sensing of Environment, 2014. 147(0): p. 121-132. |
| [5] | Legleiter, C.J. and D.A. Roberts, Effects of channel morphology and sensor spatial resolution on image-derived depth estimates. Remote Sensing of Environment, 2005. 95(2): p. 231-247. |
| [6] | Legleiter, C.J. and D.A. Roberts, A forward image model for passive optical remote sensing of river bathymetry. Remote Sensing of Environment, 2009. 113(5): p. 1025-1045. |
| [7] | Lyzenga, D.R., Passive remote sensing techniques for mapping water depth and bottom features. Applied Optics, 1978. 17(3): p. 379-383. |
| [8] | Marcus, W.A., et al., High spatial resolution hyperspectral mapping of in-stream habitats, depths, and woody debris in mountain streams. Geomorphology, 2003. 55(1–4): p. 363-380. |
| [9] | Sima, S. and M. Tajrishy, Using satellite data to extract volume–area–elevation relationships for Urmia Lake, Iran. Journal of Great Lakes Research, 2013. 39(1): p. 90-99. |
| [10] | Song, C., B. Huang, and L. Ke, Modeling and analysis of lake water storage changes on the Tibetan Plateau using multi-mission satellite data. Remote Sensing of Environment, 2013. 135(0): p. 25-35. |
| [11] | Sun, D., et al., A semi-analytical approach for detecting suspended particulate composition in complex turbid inland waters (China). Remote Sensing of Environment, 2013. 134(0): p. 92-99. |
| [12] | NOAA. Multibeam Bathymetry 2015; Available from: http://ngdc.noaa.gov/mgg/bathymetry/multibeam.html. |
 Abstract
 Reference
 Full-Text PDF
 Full-text HTML