-
Paper Information
- Next Paper
- Paper Submission
-
Journal Information
- About This Journal
- Editorial Board
- Current Issue
- Archive
- Author Guidelines
- Contact Us
American Journal of Geographic Information System
p-ISSN: 2163-1131 e-ISSN: 2163-114X
2015; 4(1): 1-21
doi:10.5923/j.ajgis.20150401.01
Uncover Fully Ignored Vital Bathymetric Data Mysteriously Hidden in Digital Elevation Model Combining with Remote Sensing Imagery (Part 1: Methodology and Theoretical Interpretation)
 Abstract
 Reference
 Full-Text PDF
 Full-text HTML
Carl Y. H. Jiang
Faculty of Science, Engineering and Built Environment, Deakin University, Victoria, Australia
Correspondence to: Carl Y. H. Jiang , Faculty of Science, Engineering and Built Environment, Deakin University, Victoria, Australia.
| Email: |  |
Copyright © 2015 Scientific & Academic Publishing. All Rights Reserved.
This is an interdisciplinary research to uncover a miss-observed and very important phenomenon in remote sensing. The high valuable bathymetric data hidden in digital elevation models have completely been ignored by scientists and researchers including main organizations in the world for a long time. The contents have been classified into two parts to demonstrate them. In the part 1, the focus is on introducing a special technique of discovering bathymetric data of lakes and rivers by means of remote sensing Image processing and the fact of water depths found in seeking for a resolution to water pollution for a large scale inland lake. The further performance is in analysing causes starting from radar interferometry. The more attentions are paid to how the microwave emitted and received by antennas of synthetic aperture radar installed in satellites during its propagation and scattering back interacts with molecules of chemical compounds in water body using spectral analysis in spectroscopy such as Raman scattering, nuclear magnetic resonance combining with knowledge of quantum mechanics and physical chemistry. The causes of losing those data have been found from phase shifting interferometry during phase detection and terrain mapping. The outcomes of this research have proved a fact that the capacity of microwave detecting depths of water relies on molecular structure, communication and strength of external electromagnetic fields and bathymetric data could also exist near sea coast. Researchnot only offered difference between optical imaging and radar imaging but also established correlation of effectively using individual data.
Keywords: Bathymetric modelling, Chemical analysis, Chemical compounds, Digital elevation models, Electromagnetic fields, extinction coefficients, Image processing, Lakes, Microwave propagation, Microwave antennas, Microwave imaging, Microwave technology, Molecular communication, Molecular structure, Nuclear magnetic resonance, Optical imaging, Phase detection, Phase shifting interferometry, Physical chemistry, Quantum mechanics, Radar imaging, Radar interferometry, Radar remote sensing, Raman scattering, Remote sensing, Rivers, Satellites, Sea coast, Spectroscopy, Spectral analysis, Synthetic aperture radar, Terrain mapping ,Water pollution
Cite this paper: Carl Y. H. Jiang , Uncover Fully Ignored Vital Bathymetric Data Mysteriously Hidden in Digital Elevation Model Combining with Remote Sensing Imagery (Part 1: Methodology and Theoretical Interpretation), American Journal of Geographic Information System, Vol. 4 No. 1, 2015, pp. 1-21. doi: 10.5923/j.ajgis.20150401.01.
Article Outline
1. Introduction
1.1. A Very Crucial and Intricate Doubt Raised from One Bathymetric Modelling
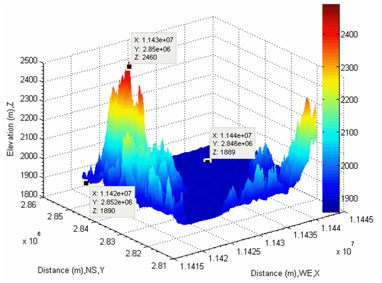
- There is a very important phenomenon in remote sensing, thus a-long-term explored and highly desired bathymetric data secretly hidden in DEM (digital elevation models), which has rarely been mentioned or even fully ignored by researchers and scientists in the world for several decades.Author accidently discovered the phenomenon when modelled depths of water body in a fully polluted large-scale inland lake making use of a unique technique created by author for other purposes initially [1].Because the discoveries are full of not only crucial and practical significances but also mysterious doubts, it is quite necessary to review this special case again before explaining the phenomenon from the view of diverse theories. This large scale inland lake is located at the following geographical location and named Dian Chi in China.
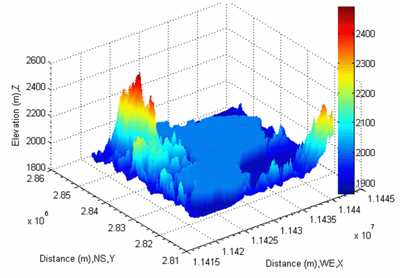
 The pranchromatic sharpened remote sensing imagery and the corresponding DEM is represented in Fig. 1 and Fig. 2 respectively. Applying author’s technique into dealing with this lake by means of integrating DEM with the remote sensing imagery of the lake, the technique is to be introduced in the subsections later, the outcome is much surprised. The elevations of water body can be completely obtained and even displayed by setting the bottom of lake water body up (see Fig. 3). Of course, it is impossible to carry out such behaviour in reality. In order to conveniently measure the absolute depths of water body, the same data of water body are set face and bottom up in two separate figures respectively, accordingly it is a special mathematic treatment for handling the elevation-based bathymetric data. The detailed explanations of this procedure are also supplied in author’s research paper [1].
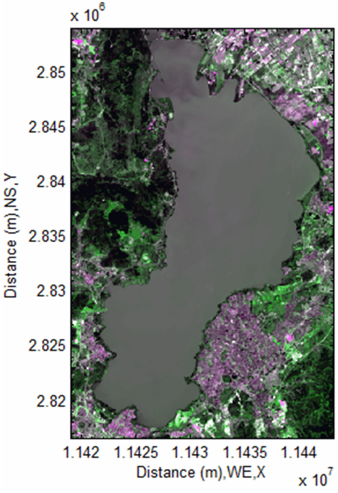 | Figure 1. A fully polluted large scale inland lake (1249× 805) |
 | Figure 2. The corresponding DEM of a fully polluted large scale lake (1249× 805) |
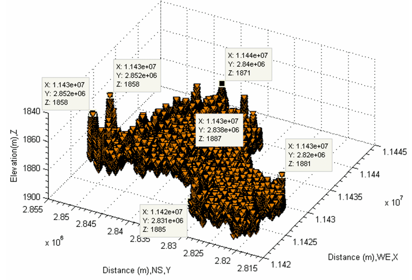 | Figure 3. The elevations of water body are displayed by bottom-up |
1.2. Bathymetric Modelling Reviews
- Although over thousands reports about bathymetric modelling exist in the world, all of these researches in the process of detecting depths of inland water body or seawater are based on the passive optical remote sensing imageries [2, 3]. However, those researchers may not fully understand the mechanism of how the intensity of incident solar radiation is affected by water body at ground level besides the atmospheric factors. In fact, the depths of water body obtained from this approach is not reliable. The reasons are specified as follows.1. The backscattered electromagnetic waves (or say signals in electronic engineering) from water body are seriously affected by water and other substances existing in the water body before they leave the water surface. Hence, the signals leaving the water surface are influenced by the water temperature, pressure and concentration of substances in water body. Those parameters can be finally expressed by the term: attenuation coefficient or say extinction coefficient. The water body can be considered as a system containing many diverse components (or say pollutants) with the varying temperature-dependent heat capacity at the constant pressure in terms of the thermodynamics. The varying temperature is a temperature gradient with respect to the variation of depths of water body in the vertical direction, which is caused by the heat adsorption of water body from incident solar radiation. Thus there must be a layer in lakes, rivers and sea or ocean due to different diffusion and conduction coefficients of components in water body according to theories of transport phenomena [4]. 2. The attenuation coefficient is unevenly distributed in the water body because the water mixture in rivers or lakes including seawater is a flowing fluid. 3. On the other hand, the signals are also affected by atmospheric layer before they are captured by sensors installed in satellites. The reflectance must be treated by atmospheric correction before it is used into the calculation. In order for users to conveniently use the products of reflectance, NASA MODIS provides several reflectance data without considering atmospheric correction [5, 6].4. If both mean attenuation coefficient and individual reflectance are applied into a commonly used Beer–Lamber equation to seek for so-called depths of water body, on the basis of above factors, this approach is very unreliable. The obtained distances in such an approach are in nature the penetrations of solar light rather than the real depths of water body. Furthermore, based on those concepts, other approaches in seeking for depths, geometric shape and the quantity of water body [7-11] are unreliable either. These researchers failed to tell the absolute depths of water body. So-called depths which they found and derived water storage of water body are usually based on the variation of seasonally measured water level sampled at banks of lakes or rivers. Thereby, the figures they obtained are not the absolute depths of water body at all.
1.3. Radar Backscattered Wave Modelling Reviews
- Radar is a very powerful tool in detecting some unknown physical phenomena by means of emitting microwave within certain regions (bands) from about 1mm to 1.3 m [12]. The emitted microwave from the antenna of a radar installed in one high-speed flying platform in space is capable of transmitting through clouds at day and night [13]. Thus, it has weather-independent working functionalities. Accordingly, it is already widely used in the fields in detecting such as Crop [14], oceanic surface waves [15-17], tidal current [18], ice [19, 20], canopy [21], soil [22-24], cloud [25], desert surface [26], wind wave [27], fresh water [28, 29] and snowflake [30] and so on. Nevertheless, in above mentioned reports, researchers hardly discussed the mechanisms of how the backscattered wave being formed and generated when the electromagnetic wave emitted by radar impacts upon the observed objects (scatters) at the molecular level. The reason could be that such a study at molecular level is already beyond the research scopes of their interests for radar engineering based researchers. Hence their focuses are only on either the effect of geometric shape and speed of observed objects on the physical properties of the backscattered wave or microwave being polarized near antenna and targets [31] rather than the physicochemical properties raised from the interaction between molecules consisting in the observed objects and electromagnetic wave. The latter belongs to the domain of quantum chemistry (quantum mechanics), analytical chemistry or physical chemistry. Even if there was a report about microwave acting on substance issued by one former U.S.S.R. scientist in 1964, however, the focus was on how the atom of solid substance is ionized in the strong field of electromagnetic wave [32] other than liquid.Similarly, such a topic is less mentioned or discussed in some remote sensing books [12, 33-38], specific reports and books [31, 39-44] and radar engineering books [45, 46]. In short, the topic of the electromagnetic wave acting on molecules consisting in the observed objects has almost ignored by scientists and researchers in the radar engineering or relevant fields due to the limitation of research scope.
1.4. Brief Summary of Literature Reviews for Radar Backscattered Wave
- Strictly speaking, in terms of classification of research field, studying the physicochemical properties change of molecules raised from the interaction between molecules and electromagnetic wave belongs to the domain on which the chemists focus. However, it gives rise to a series of difficulties and problems in investigating phenomena generated by remote sensing technology.Difficulties and Gap 1. Although chemists have specific knowledge to be capable of interpreting the phenomenon which is already ignored by both radar researchers and GIS (Geographic Information System) researchers, they are more interested in the laboratory-scale research than the large-scale one. Furthermore, chemists may not have much knowledge in GIS.2. The radar researchers pay less attention to GIS and the interaction between molecules of observed substances and electromagnetic wave.3. GIS researchers may not feel interested in molecular structure and radar engineering.4. The further problem is that even if they know the concerned topics well, they may fail to provide engineers in other fields such as hydraulic engineering, environmental engineering and civil engineering with desired data and information extracted from remote sensing. Such a gap amongst the research fields directly results in a fact that some important phenomena and hidden data have been fully ignored and “lost” due to the disconnection of interdisciplinary knowledge in the process of studying remote sensing.
1.5. Objectives of Research
- As seen from above summary, this research is therefore to concentrate on trying to fill specific knowledge into the gap in this field, namely discovering and demonstrating the vital bathymetric data hidden in DEM by means of smoothly connecting interdisciplinary knowledge based on the existing fact and the technique of extracting the useful data which can be further applied into diverse applications. In order for ones to easily and systematically understand them, the contents of this research are grouped into two parts in this paper. The objectives to be performed in the part 1 are those1. Showing a very important case which was discovered by bathymetrically modelling a fully polluted large- scale inland lake. This significant case gave rise to a very important doubt which is to be further explored and interpreted by the current research.2. Introducing a specific technique which was created by author and used to discover some unknown facts. In this section, the fundamental principle and scope of the existing and potential applications to be briefly introduced.3. Understanding how DEM is produced. Firstly, the basic principle of how the SAR (Synthetic Aperture Radar) works is to be presented starting from the basic concepts of electromagnetic wave. Secondly, the technique of InSAR (Interferometeric Synthetic Aperture Radar), which generates DEM from two interferometeric radar imageries is to be introduced afterwards. 4. Implementing a bridging introduction of interaction between electromagnetic wave and molecules in water body within a same geographic environment so as to easily connect two different disciplines.5. Eventually the theoretical explanations for the existing phenomenon and its hidden data are to be performed by using the knowledge of physical chemistry containing some specific knowledge of quantum chemistry and analytical chemistry. 6. On the basis of the reasonable theoretical explanations, it can be concluded that such a phenomenon and its hidden bathymetric data exists in all lakes and rivers in the world. The further conclusion is that it can be also extended to the seawater near coast. 7. Furthermore, a comprehensive summary including difference between optical and radar imaging and further consideration topic are supplied in the conclusion respectively based on the theoretical exploration. Once above objectives are achieved, the more evidences and further discussions and conclusions are to be provided and carried out respectively in the part 2 of this research.
2. Technique of Integrating Remote Sensing Imagery with DEM
- In this section, the several basic concepts of the technique created by author is to be introduced as follows.
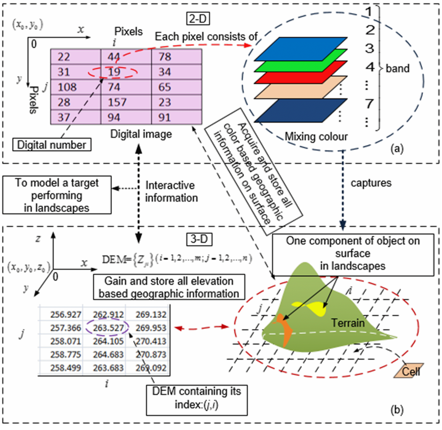
2.1. Interactive Data Transferred within Two Systems
- In general, Fig. 4 offers several basic concepts of how to build an algorithm to extract the information and data from two different systems (thus remote sensing imagery and DEM). And then, in terms of specific requirements to classify observed object in a given remote sensing imagery.However, it may need more words to explain their correlation between two systems. At first, mathematically speaking, so-called system actually is a matrix. As well known, the remote sensing imagery is made by one platform (such as satellite). The signals reflected from the ground in the form of electromagnetic wave are captured by the sensor installed in the platform. The received electromagnetic wave is digitalized and signal is then stored into matrix-like cells according to the intensities of received photons under a certain voltage, hence in a matrix array of charge-coupled device (CCD) [13, 47]. Therefore a digital remote sensing imagery is formed when the platform flies over one geographic location within a time interval.Although DEM made by InSAR installed in other platform which may be different from the optical imaging platform and the functionalities between digital imagery and DEM are completely different, for a digital remote sensing imagery and DEM, their correlations can be mathematically established by means of the following facts:1. They have the same geographic location, the time may not be important for a general application.2. They are all built on a matrix. The dimensions of matrix are adjustable under the condition of remaining the same geographic location. Geographically or physically speaking, such an approach does not affect the quality of any modelling because the real geographic location of observed objects such as terrain and lake are not changed in the process of adjusting dimensions of matrix. It is only a mathematical treatment at this stage. Such a mathematical treatment is very analogous to the case of mathematically assigning different geographic coordinate systems to the earth such as WGS 1984. But it is unnecessary to discuss such an issue, the reason is that the performance to be carried out in the research is based on the geographic coordinate system which was already chosen by DEM and remote sensing imageries designers and providers.Once the correlation between two different systems is mathematically established, the functionalities in applications are more powerful than the ones generated by each individually. In other words, all functionalities owned by each can be not only fully utilised but also their seamless combination are able to produce many applications in many diverse fields. Author has successfully modelled a very complicated process of bushfire spread in landscape including the quantitative calculation of mass (pollutants) and heat (bushfire) emission ratio, smoke spatial dispersion [48]. The applications were already extended to accurately modelling floodplain [49] and bathymetrically modelling [1]. Unfortunately, most researchers in the world are still singly using those data, waste too much.
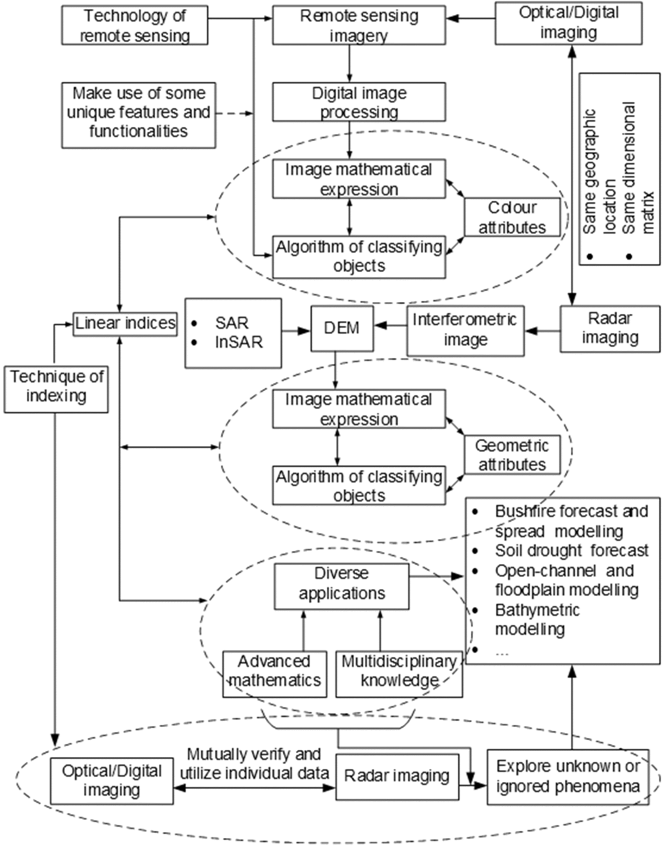
2.2. Interactive Data Transferred within Diverse Systems and Applications
- Although Fig. 4 precisely demonstrate some basic concepts of integrating two different systems. In fact, those concepts can be further developed by using more interdisciplinary knowledge and the skills which were already discovered and utilised in the previous practices.Based on the same mathematical principle of treating data, the different data supplied by more than two platforms can be combined together. For instance, physical parameter: reflectance can be added into the dual system of remote sensing imagery and DEM to model and investigate the degree of water being polluted [1]. Based on the mechanisms of how the devices installed in the platforms works, some unknown matters are able be discovered in diverse researches. Fig. 5 provides more approaches and procedures of how to discover fully ignored data hidden in DEM in terms of Fig. 4. There must be more applications in other fields to be produced. However, in this research, the focus is only on discussing how the bathymetric data hidden in DEM are formed and found. Furthermore, one very important issue which must be taken care of in the process of performing such an approach is that make sure the dimensions of the individual matrix generated from the different systems always remain the same. Otherwise, treating diverse data is impossible to be handled.
 | Figure 4. The principle of integrating remote sensing imagery with the corresponding DEM |
 | Figure 5. The correlation between optical imaging and radar imaging and their diverse applications |
2.3. Detect Water Body in one Remote Sensing Imagery and Display Detected Data into DEM
- In above sections, the main principle of how to extensively use remote sensing imagery and DEM is already introduced. In this section, the procedure of how to deal with dual system is depicted as follows.1. At first, one remote sensing imagery and the corresponding DEM is chosen. Applying one designed algorithm into the remote sensing imagery. In this case, the remote sensing imagery containing a fully polluted lake (see Fig. 1) is selected. The detected lake coloured by red is shown in Fig. 6.2. The detected lake have to be inserted in the corresponding DEM (see Fig. 2). In order to clearly visualize, the detected data of lake are added 120 meters into them before they are transferred into DEM. Finally, DEM containing transferred data of detected lake is represented in Fig. 7. At this stage, the visualized data not only contain information owned by the remote sensing imagery but also have the intrinsic properties owned by DEM (see Fig. 5). These individual properties can be further developed on demand. However, individual data and information can be accurately transferred and displayed mutually as did above. The reason why the performance is so accurate is the linear indices play a crucial role in this process. The definition of linear index can be found in the user’s manual of MATLAB®.
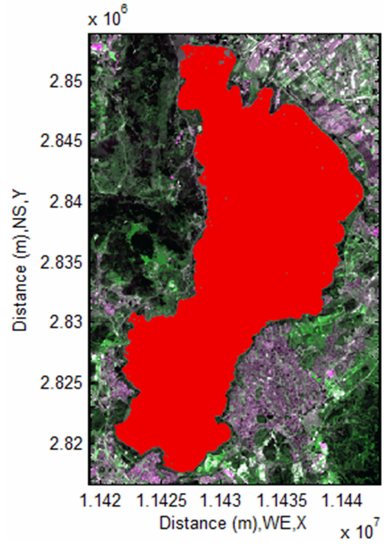 | Figure 6. The detected water body of a fully polluted lake (1249× 805) |
 | Figure 7. Display detected water body into the corresponding DEM (1249× 805) |
3. Generation of DEM Using InSAR
3.1. Basic Concepts of Electromagnetic Wave and Spectra
- Electromagnetic WaveThe electromagnetic wave (or say electromagnetic radiation) may be a well-known term in traditional physics. The light is one form of electromagnetic wave travelling in free space at the speed of 2.998×10⁸ m/s. The electromagnetic wave is already and massively involved in the applications of interdisciplinary researches.
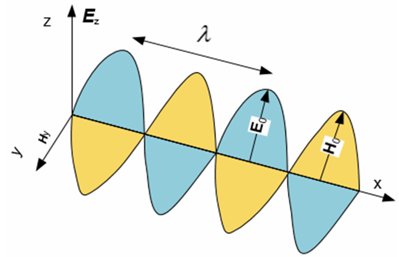 | Figure 8. Electromagnetic wave |
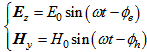 | (1) |
 | (2) |
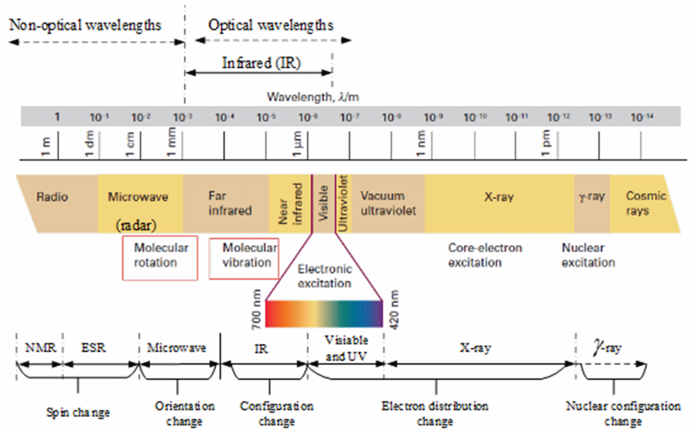 | Figure 9. Electromagnetic spectra |
3.2. Fundamentals of SAR
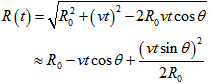
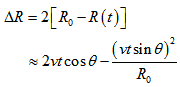
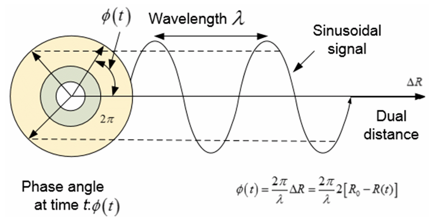
- Flying Trajectory of Platform Before introducing how DEM is finally made, it is necessary to know how SAR works when it performs radar imaging. The SAR is installed in a platform flying along one specific orbit in space. A series of electromagnetic waves are emitted by the antenna installed in the platform in the form of pulse (see Fig. 10). The receiver of signal can be in the same antenna or other antenna. Thus, the receiver or transmitter can be installed at the same antenna or different antennas [40, 53].
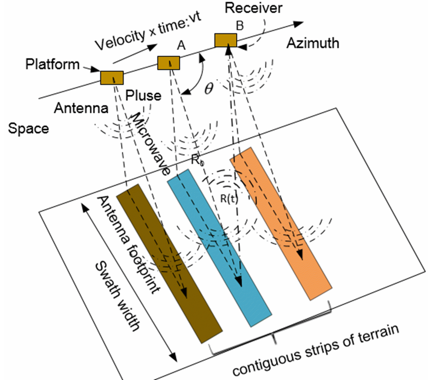 | Figure 10. The working principle of SAR (Synthetic Aperture Radar) to build interferometeric radar imagery |
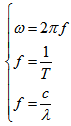
 | (3) |
 | (4) |
 | Figure 11. The Output phase of received signals |
 | (5) |
 | (6) |
3.3. Backscattered Wave from Radar Scattering and Polarized Substances
- As indicated in literature reviews for radar backscattered wave previously, the radar scattering is one of hot topics which are massively discussed by researchers regarding how the electromagnetic wave emitted by the antenna from the platform works. Unfortunately, the discussions are mainly confined to the topics such as how the radar scattering is influenced by geometric properties, such as shape and surface roughness and moisture content including the wavelength of wave and so on. The less discussions are carried out on the issues of how the scatters are polarized.There are several “superficial” models and relevant assumptions made for explaining and calculating the radar scattering in almost relevant books and reports [31, 34, 41, 43, 46, 54]. The so-called superficial models built by the interest of individual researches actually are ideal models, thus the media in air are treated as rigid and inertial particles within assumed layers between air and surfaces of scatters.The corresponding calculation of the scattering is then performed by a series of matrices in such a designed homogeneous or an inhomogeneous system and specifying several parameters of coordinates for a system combining with the physical parameters owned by the electromagnetic wave. In other words, the reports regarding the interaction happening between the intrinsic properties of the electromagnetic wave such as the strength of electric and magnetic field, the intensity of photons and the molecules of (liquid) scatters in the field of remote sensing or radar engineering are hardly found in the world. The possible reasons are already mentioned previously.
3.4. A Fully Ignored Vital Fact at SAR Scanning
- At this point, except for the interest in radar engineering mentioned above, there is a very important fact on which must be emphasized. In terms of the interest of this research, the preceding described process can be interpreted as the one of that electromagnetic fields emitted by the antenna impose on the substances like water mixture (thus water is mixed by other substances) in lake or river for several times. In other words, the molecules consisting in substances or aqueous mixtures are influenced by external electromagnetic fields for several times within a very short period (taking about 1 ns to transmit each pulse).In fact, the strengths of instantaneous external electromagnetic fields are large enough to affect the molecules of water body in lakes or rivers including seawater, which is to be calculated and discussed in subsections later.However, above fact is always ignored because at this stage1. The platform flies over lake or rive at a very high speed (about 7km/s) in space. Thereby, such a phenomenon is immeasurable at ground level.2. No specific physical devices are able to distinguish the signals emitted by molecules and atoms in water body from others scattered back from terrains.3. It is in excess of the scope of research in radar engineering.This important fact is then secretly hidden into DEM at the first step of scanning using SAR. Unfortunately, this secret is still not found at the following step of producing DEM using InSAR.
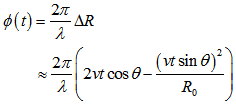
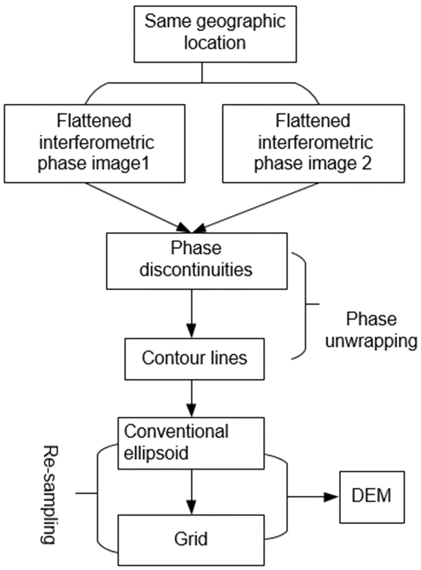
3.5. Procedures of Producing DEM Using in SAR
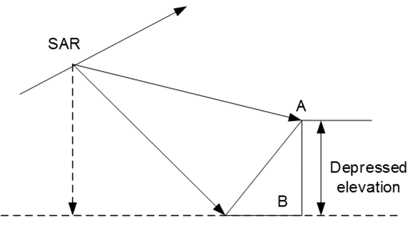
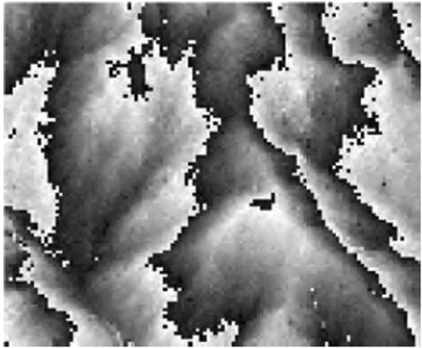
- In the previous subsection, the process of how the interferometeric radar imagery made by SAR is already introduced. However, the information of elevation in an interferometeric radar imagery is depressed. Hence, for example, the elevation of point A and B is located on the same horizontal level respectively (see Fig. 12). That results in that the interferometeric radar imagery look flat (see Fig. 13 and Fig. 14). The terferometeric radar imagery shown in Fig. 13 and Fig. 14 is made at the same geographic location but different time respectively. They could be made by the same platform or separate platforms. For example, the global DEM thus SRTM3 supplied by NASA is made by the same USA shuttle [40].However, the depressed elevations can be released by a technique called phase unwrapping [40, 53]. The main procedure of generating DEM is illustrated in Fig. 15. The process of phase unwrapping is mainly based on the difference of phase for the same observed objects, for example, the phase difference exists between Fig. 13 and Fig. 14. Releasing the depressed elevations is only a first step. The second step is that the released elevations of the same observed objects having contour lines (see Fig. 16) have to be resampled into a geographic system such as WGS84 and located into a matrix-like grid. And then, DEM like Fig. 2 is formed eventually.
 | Figure 12. Depressed elevation in interferometeric radar imagery |
 | Figure 13. Interferometeric radar imagery with the same geographic location at one time |
 | Figure 14. Interferometeric radar imagery with the same geographic location at another time |
 | Figure 15. The procedure of unwrapping phase to generate DEM |
 | Figure 16. Interferometeric radar imagery with the same geographic location and contour lines |
3.6. Important Data Melt into DEM
- At this point, being in mind by following up previous remarks, some important phenomena including their corresponding unknown data are already captured by radar imaging. But only data of elevation are secretly “melt” into DEM in the process of the phase unwrapping.The data captured by radar imaging could include those which have not been discovered yet. However, whether the properties of those data are able to be fully extracted and displayed in data processing or not is decided by the following extended extra factors:1. What kind of substance on the earth, which is concerned by researchers and is capable of being detected by optical imaging and handled by the digital image processing respectively.2. What a sort of physical property generated by the interaction between microwave and scatters, which can be detected and received by radar imaging, as SAR does.Of course, the melt data of interest in this research are bathymetric data. However, as mentioned before, to reveal those melt data in DEM as shown in Fig. 3, it has to rely on the unique technique created by author. Otherwise, it is too difficult to discover them.
4. Approach to Correlating Signals of SAR with Behaviours of Molecules in Water Body
- In above sections, the tasks only illustrated the process of forming DEM starting from the basic concepts of electromagnetic wave and how the hidden data are secretly melt into DEM. The less attentions were paid to the radar engineering in detail. As to the mechanisms of how those hidden data are formed, it is still not explained yet. Consider interpreting the mechanisms in theory is a very complicated process. It could be better to offer a bridging introduction so as to further discuss or for ones who do not feel interested in the analysis at the level of the molecular structure in the following subsections. The quick explanation should be understandable even if ones do not have much knowledge of physical chemistry.Fig. 17 is a big picture of that not only precisely summarizes the contents introduced above but also moves the focuses and concerns from visible terrain to water body in inland lakes or rivers.
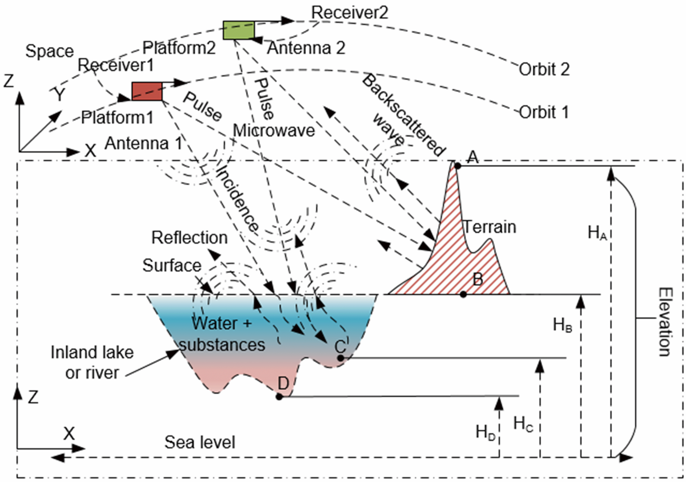 | Figure 17. Global view of correlation between external microwave and elevation of terrain and lake |
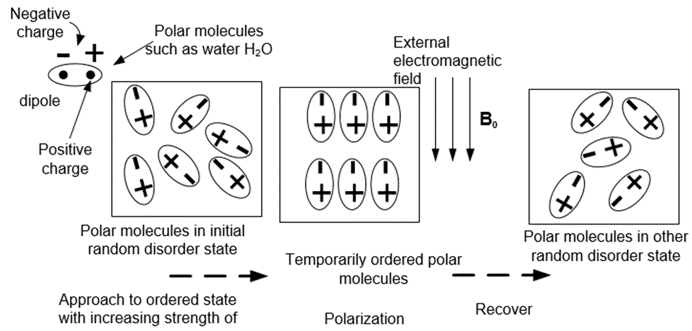 | Figure 18. The sketch of process of polar molecules in lake being temporarily polarized under influence of external electromagnetic fields |
5. Structure and Spectra of Substances in Water Body
5.1. Overview
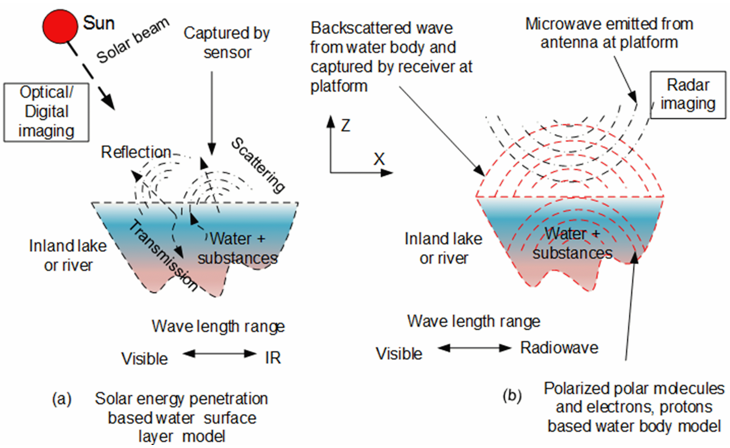
- The remote sensing is a technology relying on the electromagnetic radiation. According to the source type of the electromagnetic radiation, it can be classified into passive and active manner respectively. In order for ones to conveniently to access the core of discussions. Based on the different sources of the electromagnetic wave which is emitted or received by either physical devices or substances (molecules or atoms), Fig. 19 provides ones with a brief profile of how they correlate each other. It is better to consider their potential correlation by means of combing it with the spectra shown by Fig. 9. The passive electromagnetic radiation is reflected from the surface of the earth. The solar beam is the main provider of electromagnetic radiation for the surface. Such an electromagnetic radiation is not controllable. However, the controllable electromagnetic radiation which is often used in remote sensing is emitted by laser and radar respectively. The different mechanism of them acting on atoms and molecules results in the different region of spectra whose signals are emitted by micro-scale substances and received by the receiver as well (see Fig. 9). Knowledge Required in Applications of Remote SensingAlthough the concentration in this research is on how the electromagnetic wave emitted by radar at the region of microwave impacts on water body, from the view of scatters, it is still quite necessary to understand some knowledge of how the water body containing other substances (molecules and ions) is affected by the incident electromagnetic radiation whose bands locating at the visible and infrared region when it impacts upon water body. It is because 1. The external electromagnetic radiation imposing on water body is a time-dependent dynamic process.2.The internal orientation and configuration of molecules responding to the external electromagnetic radiation a time-dependent dynamic process too. Meanwhile, being similar to spectroscopy in analytical chemistry, several spectrums are generated due to the internal energy change of molecules, atoms and metal complexes when the external electromagnetic fields are applied into them. Because of that, those spectrums have a broadened range on spectra, which may include IR and Radio bands and so on. In order to capture those information, sensors are also installed in satellites in addition to SAR. 3. Whether the signals of radio band are able to be captured or not relies on the functionalities of antenna (see Fig. 19). 4. The Raman shift could exist, which could happen in rotational transitions, vibrational transitions of molecules or their mixed mods and electric transitions.5. The interferometeric radar imagery may be captured at the day time, therefore the mixed spectrums should include the partial contribution of solar radiation in the process of activating molecules and so on accompanying with the electromagnetic radiation emitted by SAR.Difference of Electromagnetic Radiation Used in Two DisciplinesIn the radar engineering, the most interest in electromagnetic radiation may be the transmitting form of electromagnetic wave, however in the physical chemistry, the concentration is located on both of them (thus, both wave and particle, the more relevant discussions are to be carried out in the subsections).Accordingly, the electromagnetic wave is treated as a common media and term in depicting and establishing the substantial correlations between the internal energy level changes happening in molecules when the external electromagnetic fields are applied into the molecules and the interferometeric radar imagery generating DEM finally (see Fig. 19).
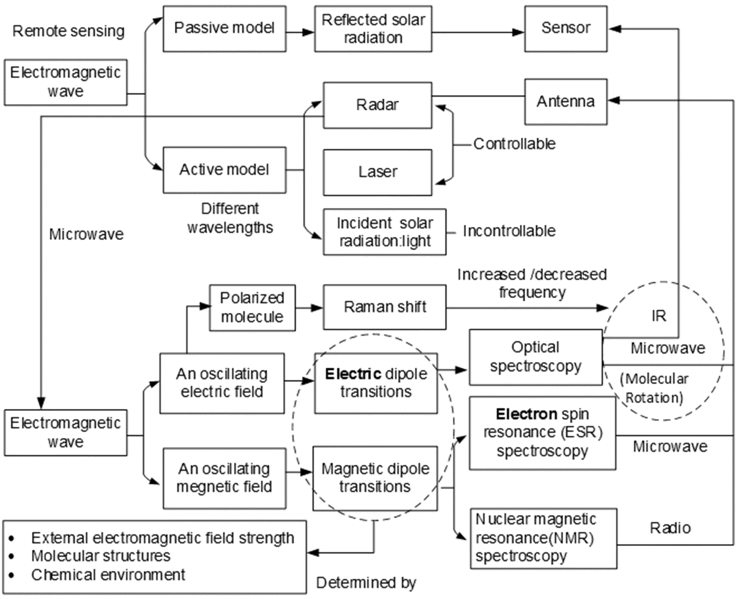 | Figure 19. The sketch of interaction between the external electromagnetic fields and chemical substances in lake and the linkage by microwave |
5.2. Optical Spectroscopy
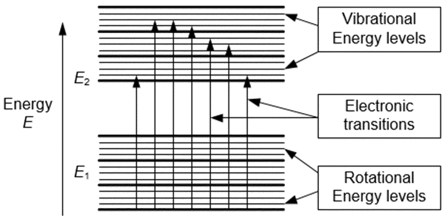
- Energy Levels and Energy TransitionsAs well known, in the modern physics, it is already indicated and well approved that the electromagnetic radiation has wave-particle duality, namely the light has the duality of electromagnetic wave-photon. The corresponding energy of it is quantized. This concept already established the subject of modern quantum mechanics and quantum chemistry respectively.The energy levels of atoms and molecules can be determined by measuring the wavelengths of the light that is emitted, absorbed, or scattered in transitions between energy levels (see Fig. 20).
 | Figure 20. Different energy levels in molecules and atoms |
 | (7) |
 | (8) |
 | (9) |
 | (10) |
 | (11) |
 | (12) |
5.3. Magnetic Resonance Spectroscopy
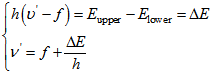
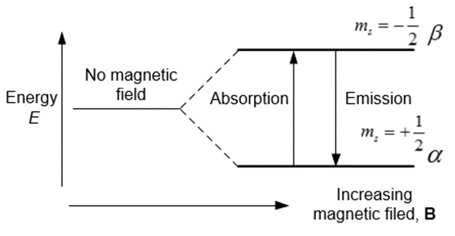
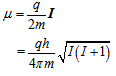
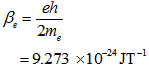
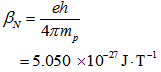
- In the preceding subsections, the potential mechanisms of producing the microwave from the electric dipole transition are already discussed briefly. In this subsection, the attention is to be located on how oscillating magnetic field affects the electrons and nuclei. Both electron spin and nuclei associate with the spin angular momentum when a magnetic field is applied into them (see Fig. 21). The magnetic dipole transitions are involved in electron spin resonance (ESR) spectroscopy and nuclear magnetic resonance (NMR) spectroscopy. However, more attention is paid to ESR is because the electromagnetic wave generated by the electric transition within two spin states (α or β) in magnetic field belongs to the band of microwave, the one produced by NMR is located in the band of radio. But, the RF is very useful too in both substance analysis and medical diagnosis although it is ignored to discuss in this research.
 | Figure 21. Spin energy level |
 | (13) |
 | (14) |
 | (15) |
 | (16) |
 | (17) |
 | (18) |
 | (19) |
 | (20) |
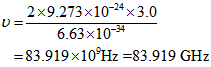 This frequency locates within the band of microwave. In other words, if the external magnetic field B0 supplied by SAR is able to cause ESR and its microwave is certainly received by the antenna. In contrast, if a SAR is capable of emitting 94 GHz microwave, the magnitude of magnetic field B0 is equal to 3.3604T. Modern SAR is able to produce more strength of magnetic field than this figure.
 5.4. Brief Summary of Microwave Produced by Polarized Water Body
- As seen from above, the mechanisms of generating the microwave emitted by temporally polarized water mixtures and eventually received by the receiver installed in a high-speed platform are very complicated. However, the general features could be 1. The molecules affects each other when the external electromagnetic fields impose on them.2. During the period of interaction, the electromagnetic wave having different frequencies are emitted within a very short time interval. Most microwaves are received by antenna.3. Because the received microwaves are directly related to elevations of water body, in other words, the depths of water body in most lakes or rivers can be obtained within less than one minute. The purpose of above illustrations is to demonstrate that such a phenomenon not only does exist but also has the evidences of theory, it may be very difficult to perform in situ experiment to prove it due to the platform has a very high speed in space. However, it completely does not affect its applications and significances based on this vital discovered phenomenon.
6. Conclusions
- The topics of research discussed in this paper were brought out of the doubt when author performed a bathymetrically modelling a completely polluted large scale inland lake. Hence, why did the DEM hide such bathymetric data? Where did they come from? The answer is very positive after exploring from diverse theories. Although interpreting those existing data employs many individual procedures and corresponding theories, our summaries still focus on the final effect of them and main applications from the angle of theory. Summary and Pratical SignificancesHidden Bathymetric data Produced by Interaction at Micro-level The hidden bathymetric data are generated by the interaction between microwave emitted by antenna and atoms, molecules in lakes and rivers. And then, a series of continuous microwaves are captured by antenna installed in the platform. Those received microwaves are partial bands of electromagnetic waves emitted by transitions between different energy levels in atoms and molecules during the very short period of interaction.This fact was already approved by the existing knowledge and theories. Interactions Generates a Natural Physical PhenomenaBecause the internal interaction is involved in the structures of atoms and molecules when external physical factors are applied into them, the mechanisms of interaction happening in the internal motions of atoms and molecules certainly belong to natural physical phenomena and the domains of study of physical chemistry. It therefore has a general rule and can be applied into investigation universally. Namely, on the basis of the known knowledge of physical chemistry, it can be predicated that all inland lakes and rivers have such bathymetric data hidden in DEM once the external microwave superimposes onto water body, because water is a polar molecule.Explore Bathymetric Data of SeawaterAbove knowledge can be also extended to seawater near coast. Regardless of how many components exist in seawater, at least, there are two components can be confirmed. One is water, which is already specified above, other extra chemical substance is sodium chloride (NaCl), which is disintegrated as the Na+ and Cl− ions surrounded by the polar water molecules. They are wonderful charged particles. The microwave is easily generated by them if the powerful external electromagnetic fields superimpose onto them.In order to prove above fact, the more evidences are to be supplied in the part 2.A Existing problemSeeking for bathymetric data using DEM is exciting. Author has already discovered some depths near coast. Unfortunately, DEM supplied by NASA including NOAA and other organizations in the world does not cover such data near coast. The reasons why they do not supply them are similar. Thus, they have1. Realized such a phenomenon and hidden bathymetric data neither.2.Thought that it is unnecessary to provide international users with DEM near coast, which is based on the sea level. This is another disjointed point between scientists and GIS researchers. Therefore, NOAA is still detecting bathymetric data by means of very expensive laser (thus, LIDAR).Further ConsiderationEventually, as a final comprehensive summary for the part 1, another easily understanding picture (see Fig. 22) is provided for ones who have already owned knowledge in optical remote sensing imaging to quickly distinguish it from radar imaging and then further consider other concerned topics.This picture tells researchers in the field of remote sensing that in the process of analysing any observed objects on the earth, any relevant knowledge and techniques cannot be isolated and used repulsively. There are massive topics which have been involved in. It seems that many different satellites exist in the world. However, their different functionalities can be quickly found from both the electromagnetic spectra (see Fig. 9) and their working mechanisms between electromagnetic wave and scatters. Recently author is also paying an attention to researching the underground water using DEMs produced by ASTER (a USA and Japanese joint satellite) and SRTM respectively. A notable difference is that the elevations of lakes shown by ASTER are lower than those shown by SRTM3 at the same geographic location.
 | Figure 22. The schematic of difference and correlation between optical imaging and radar imaging |