Ali Dhafer Abed
Civil engineering department, Faculty of engineering, Al-Mustansiriya University, Baghdad, Iraq
Correspondence to: Ali Dhafer Abed, Civil engineering department, Faculty of engineering, Al-Mustansiriya University, Baghdad, Iraq.
| Email: |  |
Copyright © 2014 Scientific & Academic Publishing. All Rights Reserved.
Abstract
Selecting the best route is a complex process due to the multitude variables must be taken into consideration to achieve the best results in the time, effort and cost. The most important of these variables are those related to aspects of the environmental, economic and political, residential areas and urban areas, topography and geology of the area of the proposed pathway. These variables easily represented through the use of (GIS). In this research the optimum path for electric power transmission towers, high-pressure (132 kv) was choosing, which starts from the main power plant located north of the Balad city and even to the secondary electricity conversion station, located south of the city (33-11 kv) by using modern scientific procedures of Geographic Information System to solve the problem, and the solution was based on digital base maps that have been produced for the study area, which produced in the form of geographical maps graded in colors have three-dimensional model (3D Model) represents the nature of the land use and environmental, topographical aspects for the area of study, Which depending on it the selection of the optimum and shortest proposal path for transmission towers, electrical power. The proposal path was examined and checked depending on the determinants and conditions taken from the Ministry of Electricity for the city, which contains the minimum amount of allowances for junctions and horizontal prohibition for the electricity lines and the results were both agreed.
Keywords:
GIS, 3D analyst, Spatial analysis, 3D surface, DEM, TIN
Cite this paper: Ali Dhafer Abed, The Selection of Optimum Path for Electric Power Transmission Towers, High-Pressure in Balad City, American Journal of Geographic Information System, Vol. 3 No. 3, 2014, pp. 135-146. doi: 10.5923/j.ajgis.20140303.03.
1. Introduction
The electrical energy represent a lifeline because it is involved in all areas of life and the process that is not get up only by availability in sufficient capacity payment and coverage from the main stations to substations to ensure the operation which is, of course, Ability of electric power, which we can confirm that it is unfixed and unstable in all parts of the Iraq provinces and the reason for this due to permanent disability caused by the increase in the consumer loads of electrical current as well as the large number of consumers in addition to the large distances between power plants and secondary electricity conversion station [1]. As a result of continued demand for raising effort electric power due to urbanization, investment and construction in Iraq, forcing power plants to get out from the cities to give place to build houses, buildings and factories, which in turn need to electrical energy of high voltage which get it through the secondary electricity conversion station which in turn get energy by relying on the power transmission towers, for these towers a great importance to being artery core in electric power transmission, so we must ensure that the design of the path of the towers of power transmission especially towers, high-pressure be as short as possible and as far as possible from forbidden areas to be feeding substations of these areas by energy that meets their need, so the design or choose the best path for the electric power transmission towers, is one of the most important determinants in the distribution of this energy properly and not to loss [2].The problem of selecting and designing a better path or a road linking between facilities is a common problems in civil engineering and engineering of roads and transport, especially the traditional methods used in the design and selection of paths that require many of surveys field and a lot of information must be gathered about the area and a lot of variables and parameters must be taken into consideration in addition to the time and effort and high cost, making these methods are not valid in this works [3].Geographic Information Systems (GIS) is one of the more systems commonly used in civil fields and engineering applications because it can describe the variables and parameters which influence the choice of optimum path as the environmental variables and the terrain and built-up areas, geological and related variables in the form of digital information can be used by the system to conduct spatial analysis for many of the spatial variables at one time in order to select the optimum path easily [4].Also GIS can convert all these variables to the maps in digital format tied to its geographical location by isolating each one of these variables with a layer of its own and then link it to a database by special tables within this layer, In addition to the possibility to deal with various maps, integrate and prepare spatial analysis of various kinds by using tables linked with each layer that contain maps of the study area.
2. Study Area
Study area is located in the Balad city which is one of the districts of the Salahuddin province, which lies about 85 km north of Baghdad, Its located at a latitude of 34 between district of Samarra north and district of Al-Dujail south, Which extends its borders from the borders of the Diyala province at Alhatmia district even the northern border of Al-Ishaqi district and extends westward borderd the island that stretches in the province of Salahuddin and Anbar province, while on the north-east borderd other parts of Diyala province, and the Al-Audheim River, As illustrated in “Figure 1”.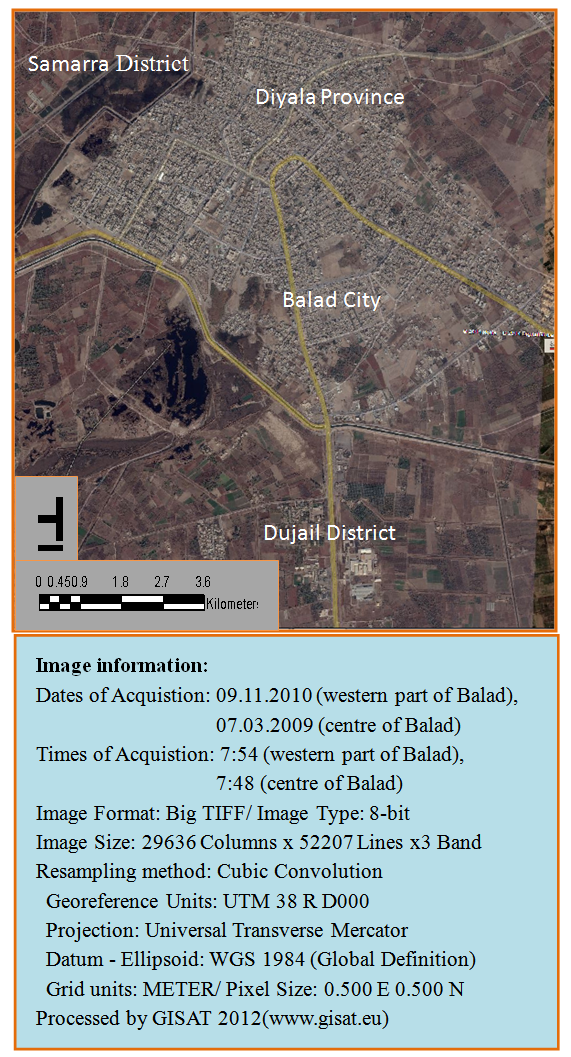 | Figure 1. Balad City (Study Area) |
3. Problem of the Study and Its Importance
Ministry of Electricity of Balad city made a great effort in order to feed the city with electric power sufficient by raising the voltages and the productive capacity for the main power plant of city, but because of the problem of far this station about the city and the weakness and lack of power transmission lines that do not fit with the productive capacity of the main station in addition to the large number of abuses and irregular area of residential and agricultural in the city, and those who have access to electricity illegally by encroaching on the power transmission lines, so it became not possible to rely on these lines to feed the city with sufficient energy and it became necessary to develop towers for power transmission with new paths for feeding secondary conversion station with energy of its needs, in addition choosing the best locations for these towers to prevent abusers and non- passage in forbidden areas.The importance of this study is to select the optimum path for the transmission towers, electrical energy, high-pressure connecting the main power plant and secondary conversion station for Balad city relying on digital base maps of the city after converted into a formula of (Raster data) which have been produced based on plan satellite images with high-resolution (50 cm) and digital elevation models (DEM) which produced based on the ground survey points of study area. This path was chosen by using the most important analyzes in geographic information systems (Spatial analyses & 3D analysis of GIS software) where the benefits of these analyzes, it enables us to identify areas and determinants which dependent by the desired path passed. where it is possible to avoid the effects of the proposed path on sensitive and environmental areas that we do not want to pass the path through it, where the remainder of this property are possible in geographic information systems and to the possibility of this type of analysis to deal with more than one layer, and more than a specified or variable simultaneously.It also lies the importance of this study is to build a three-dimensional surface of the study area (3D-Surface by using tools of GIS software) in the form of digital map, which was adopted in production of the longitudinal section and basic design elements of path, which will enable the planners, designers and decision-makers to making any kind of analysis, and design any type of paths for the study area based on this surface, in additional the possibility of additive, modernization and modification on the map after the completion of the design by geographical database associated with it.
4. Theoretical Framework of the Study
As a theoretical framework for this study will be interpreted process of selecting the optimum path, then it will be addressed to the concepts of geographic data and then will be highlighted on geographic information systems and data types used in the study, methods of its analysis, in which through it will be selected the optimum path.
4.1. Interpretation the Process of Selecting the Optimum Path
The process of selecting the proposal optimum path for electrical power transmission lines is considered a complex process because of the large number of variables that must be considered when choosing the path so as to achieve the best results. The most important of these variables are those related to environmental and economic aspects, areas of residential buildings, topography and geology nature for the region of the proposed route's path, the representation of these variables can be easily through the use of Geographic Information Systems. (GIS), which is the high potential to deal with the various maps and integrated it, prepare of different spatial analyzes by using linked tables with each layer that contain data of the study area [5].In the midst of the progress science and technology, especially in the fields of surveying and Geographic and Informatics, it became possible to employ techniques of geographic information systems in development, design and selecting the paths of different roads, and that many of the traditional methods used to select the appropriate path of roads is done by civil engineers, but it is through the blending of science and technology with each other, it became possible to use the techniques of GIS and remote sensing in identifying solutions to select the most appropriate paths for roads in addition to designs by using terrestrial calculations [6].These solutions show new horizons in road engineering, which would reduce the period of time in the design and planning of roads, can these solutions reduce labor significantly, so reservation dramatically the time and effort in surveying works, and the advantages of using these techniques is presented for several other solutions in record time, in addition to the provision of effort, money and time.
4.2. Concepts of Geographic Data
Goes scientists geography and them (Ben Salma, 1995 [7]) that the geographic data are divided into four sections, which are the data of spatial adjective: a statistics that show a particular phenomenon in a place or a particular location, data of vector adjective: which have one length and maybe have type of width such as roads, rivers, data of area adjective: Which is statistical data for a particular phenomenon (two-dimensional) on an area of the map such as the type of climate and natural characteristics, and data of volumetric adjective: Which be three-dimensional and it ranging from mental building such as the number of the population [8].
4.3. Concepts of Geographic Information Systems
GIS is defined as a computerized system for the collection, management, processing and analysis the information of spatial adjective, which describes the geographical features on the earth surface, whether these features were a natural such as forests and rivers or artificial such as buildings, roads, bridges, dams, or even natural phenomena and environmental like tides and pollution, desertification and others. It can limit the components of GIS with the following elements [9]:  Users: they are the most important components of this system, where the human element which is developing procedures and definition of the system.
  Data: from aerial photographs, maps and statistical tables, descriptive information, and others.
  Hardware: it is the component that affects the speed and quality of information analysis and deal with it.
  Software: programs and different database.
  Methods: which govern the relationships between the different components.
4.4. Types of Data and Methods of Analysis
Initially the data can be divided into two basic types: Spatial Data and non-spatial data. The spatial data identifies geographic location (coordinates) on the earth surface to the phenomenon or spatial feature under study while any other information - other than geographical location - related to this spatial feature is referred by name of non-spatial data or Attribute Data, Which describes the quality and characteristics of this type of data [10].The analysis of the data in the frame of geographic information systems also will be divided into two types according to the types of data, which includes statistical analysis conducting analysis work and interpretation for non-spatial digital data, while the analysis of spatial data called spatial analysis of the data.The spatial analysis based on, that each phenomenon has space or spatial scope, and it has spread and specific distribution, this type of analysis aims to uncover relationships and reciprocal spatial correlations between the vocabulary of the phenomenon (and also shows several types of phenomena in the same spatial space) for access to build a spatial model for spatial phenomena.Spatial analysis could be done on several levels: two-dimensional, three-dimensional, four-dimensional. In the tow dimensional analysis the horizontal locations are analyzed only (Coordinates for example) that express to the geographical location of the phenomenon vocabulary under study. While in the case of the availability of the third dimension values (height) of the phenomenon vocabulary, it is possible to analyze the data in three-dimensional (3D-analysis) or so-called (Surface Analysis), It can also be the work of spatial analysis chronologically (four-dimensional) in the case of the availability the same data for several periods of time [11].The data in the geographic information systems are represented by two models, the first so-called linear or directional data (Vector Data), and the second is called the retina data (Raster Data). The spatial analysis in the framework of geographic information systems depends on vector data or raster data as an essential factor to conduct the analysis, “Scheme 1”.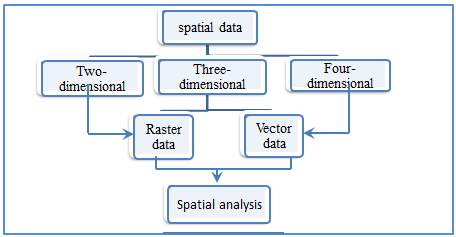 | Scheme 1. Data types and spatial analysis |
As a summary of the theoretical framework as sees, (Artimo, K., 1993) that must accept the fact that the modern cartography under modern geographic information systems has a completely new foundations, that both in terms of production or in theory or in terms of the definition, and that through the prevalence of many concepts, such as: Digital map, digital landscape model of the earth's surface, cartographic Information Systems, geographic information system, cartographic data base and geographic data base [12].
5. Methodology Steps of the Study
The action plan includes the following steps:
5.1. Building Three-dimensional Digital Model for the Area of Study
Digital 3D-Model for the area of study was constructed according to the following stages:1. Production of digital base map: The digital base map for the study area was produced by using (Arc View GIS) software based on a corrected plan satellite image with high-resolution (50 cm) _This satellite image corrected by using ground control points (GCP) that existed in the study area, where 25 of (GCP) were used to geometrically correction and rectify this satellite image and_ which contains all the existing details and symptoms in the satellite image such as residential areas, commercial, industrial, agricultural, and empty areas and all buildings and facilities that founded in the region, In addition to drawing all types of roads and paths, rivers, water areas that existing in the region, Where it was to isolate each one of these details in a layer of its own, then linked these layers with a database describing these symptoms and facilities by using tables of each layer based on the land use for this area, Where this symptoms may be residential buildings or government buildings, industrial, commercial, tourist, empty area, hospital, road, school, power station ... These data were added based on field survey forms for this region that taken from the Directorate of Municipality of the Balad City, where these forms contain the land use for each building or a road or region that found on the satellite image, Also contains details of the infrastructure, water and sanitation, transport, power plants, all kinds of power transmission lines and all details of the basic design for the Balad city, Where all these details were added to the digital map produced as in “Figure 2”.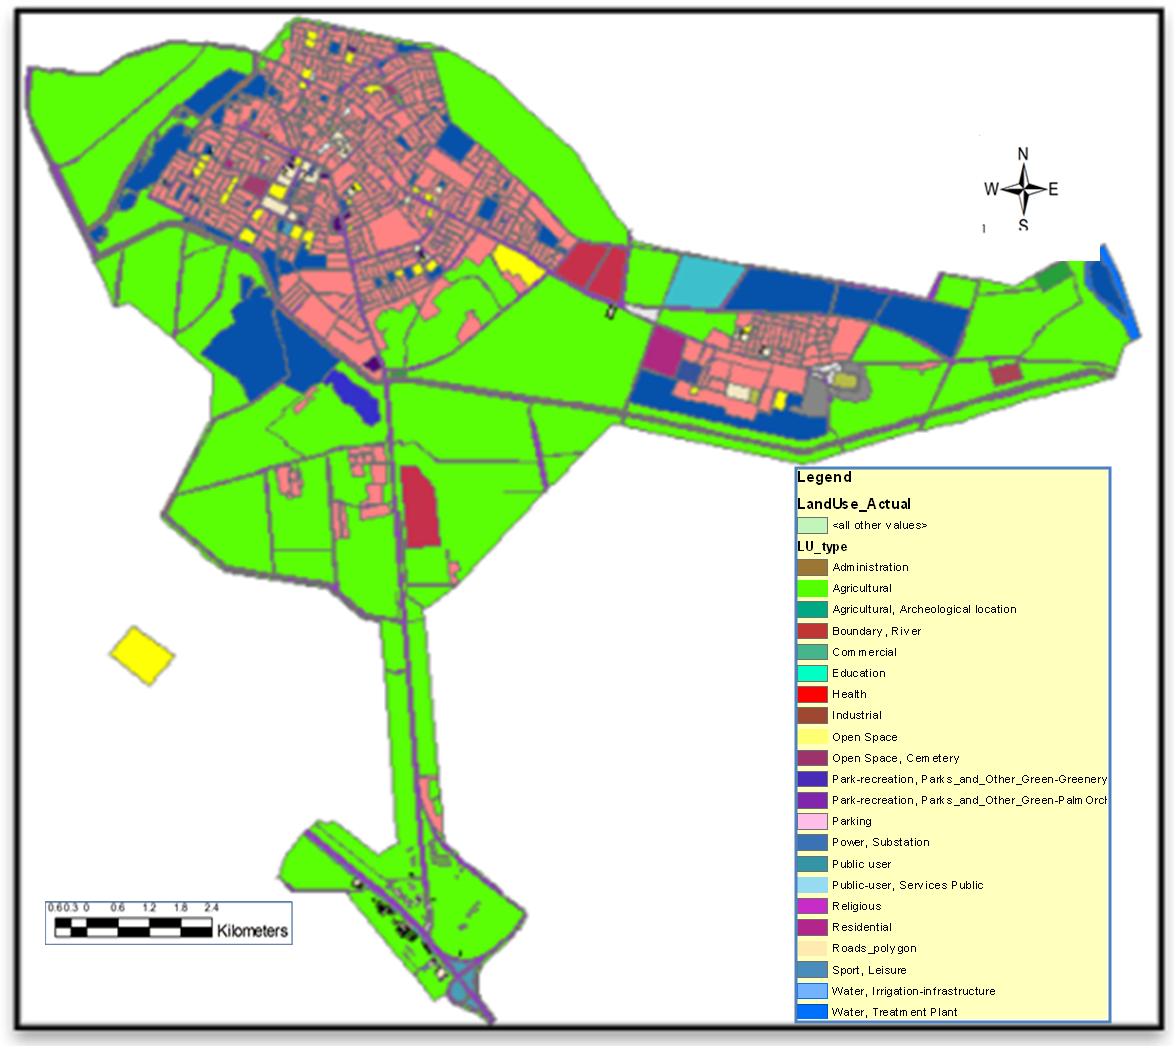 | Figure 2. Digital base map for Balad City |
2. Create a digital elevation model: The creation of digital elevation model to the earth's surface, which is called TIN (Triangulated Irregular Network) was been based on the ground survey points for the area of study by using (Arc View GIS 3D surface analysis) as in “Figure 3” shown below: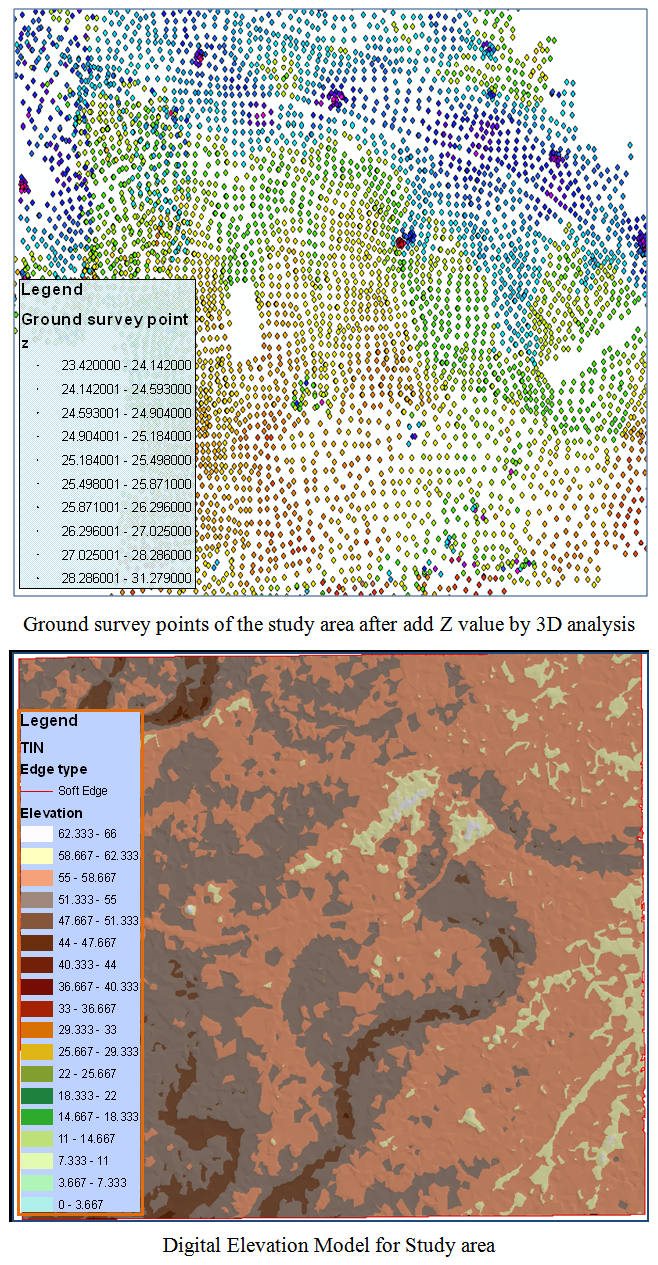 | Figure 3. Production the digital elevation model for the area of study |
3. build a three-dimensional surface: by usng GIS software tools a 3D-Surface of the study area were built after converting digital base map to the Raster formula based on the table of land uses for each region in order to be giving each region the color of its own represents a use of the land in this region, then three-dimensional surface of the study area was created depending on the digital elevation model (TIN) as illustrated in “Figure 4” below, Where will consist of our a three-dimensional model (3D Model) in Raster formula can be used later to conduct analyzes to find the best path, Since this type of analysis depends on the layers in raster formula instead of vector formula which gives digital apical for each Pixel in raster which system adopted during the analysis [13].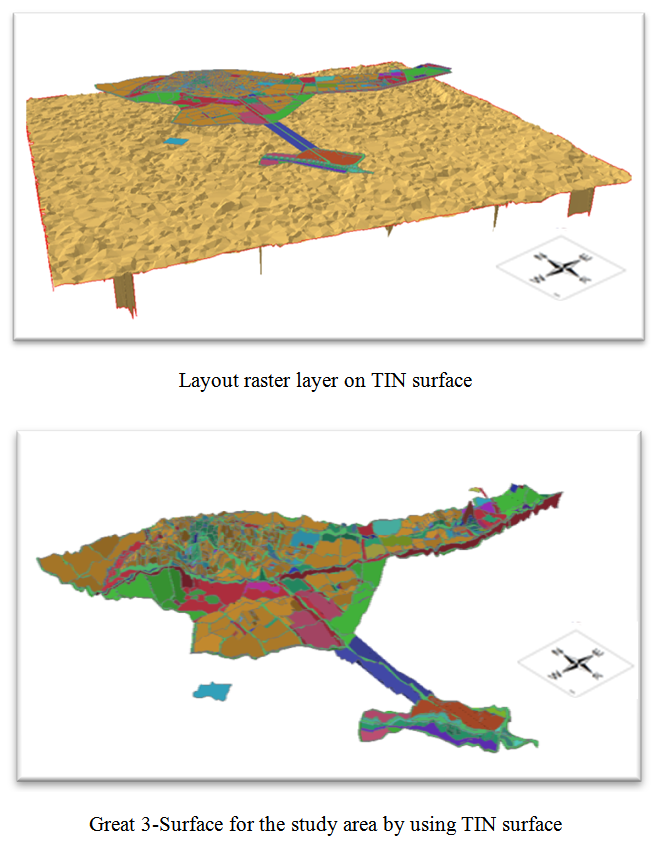 | Figure 4. 3D Model for Balad City |
5.2. Select the Optimum Path for Electrical Power Transmission Towers, High-pressure
Optimum path was selected by using the (Spatial analysis in Arc View GIS) as in the “Scheme 2” shown below, which shows the sequence of action steps for the selection of the optimal and shortest path.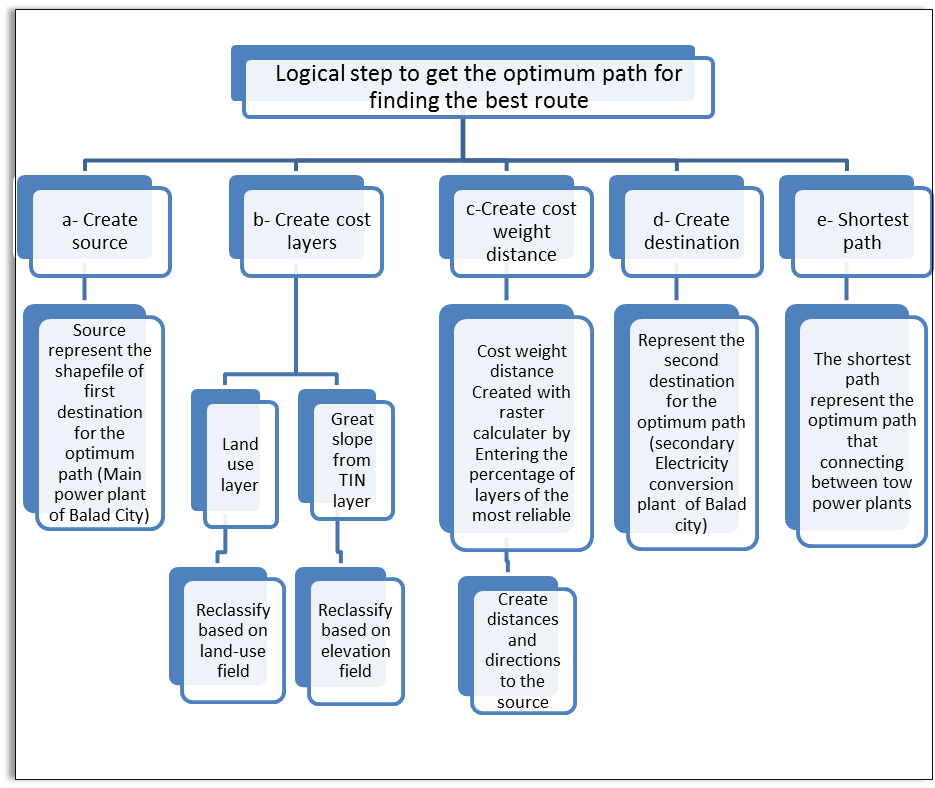 | Scheme 2. Logical step to get the optimum |
Practical steps to find the optimum path will be summarized based on the sequence of steps “Scheme 2” described above, as follows:a) Create source: by selecting the first destination of the path which represents the main power plant for the Balad city as in “Figure 5” shown below: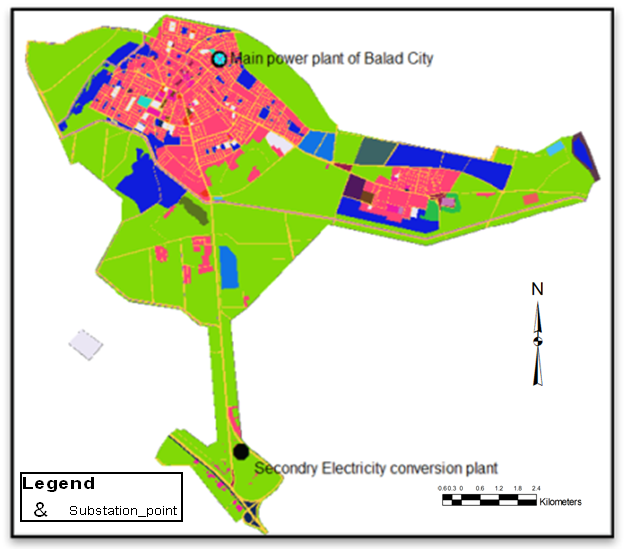 | Figure 5. Select first destination (main power plant) |
b) Create cost layers: It is a two-layer (Land-Use & Slope), The (Slope Layer) created based on digital elevation model (TIN), this layer shows the amount of change in the slope for natural ground of the study area, then we do re-classify for this layer depending on elevations so as to ensure that the path will pass in flat area not in area of sharp slope. In addition to work re-classify for (Land-Use layer) based on the land uses that related of each area, so as to ensure that the path will not passes through the area that not permitted, as illustrated in “Figure 6” shown below. The property re-classification in geographic information systems allow us to reclassify layers depending on the cost of the design, to ensure selection of best route at the lowest cost [14].c) Create cost weight distance: it is created by Entering the percentage of layers (re-classified layers) of the most reliable that the route will depend on it to find the optimum path, Where the highest percentage were given to the layer which is the most dependent (Land-Use layer). Then cost distance Created with its direction to the source that shown in the “Figure 7” below.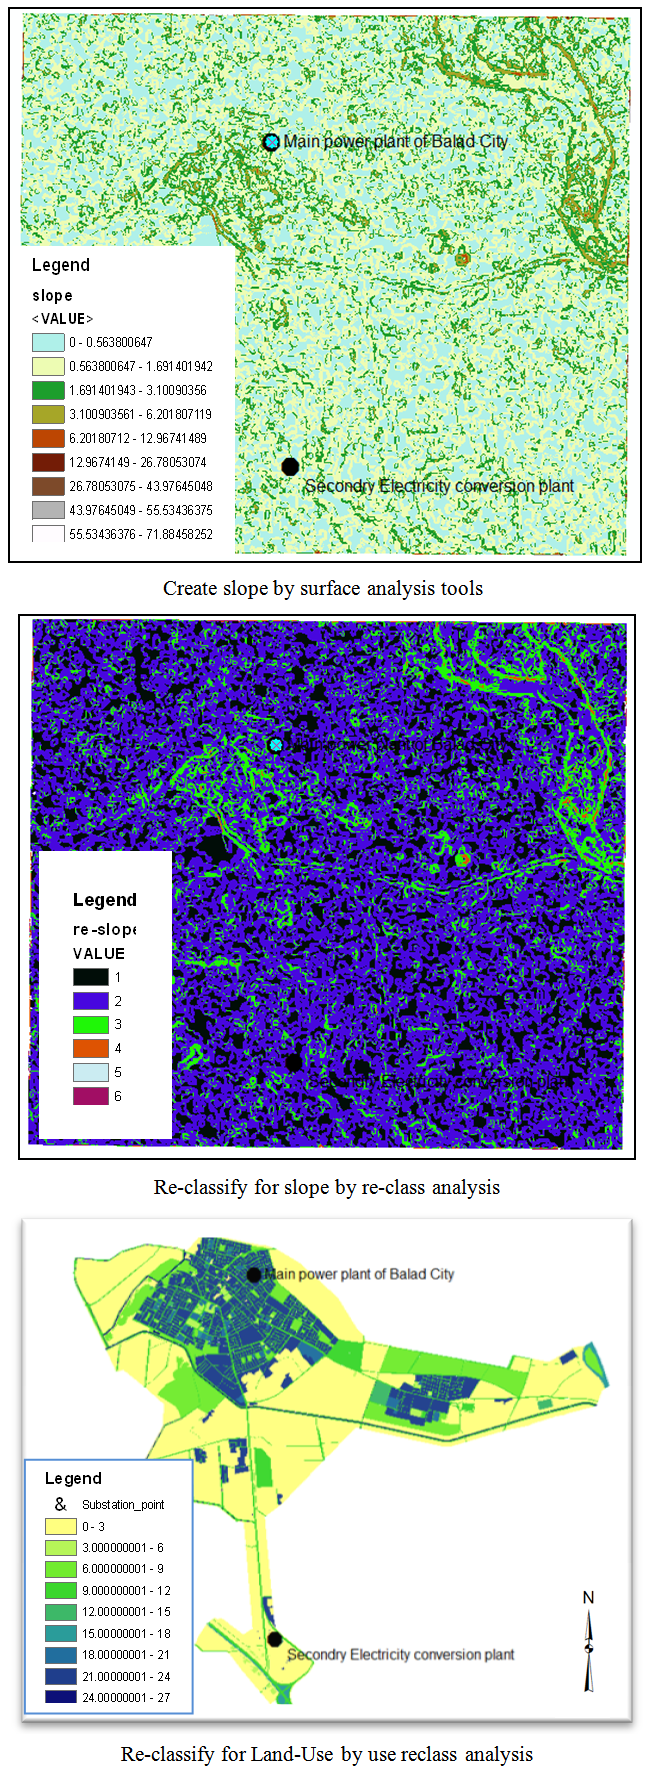 | Figure 6. Cost layers |
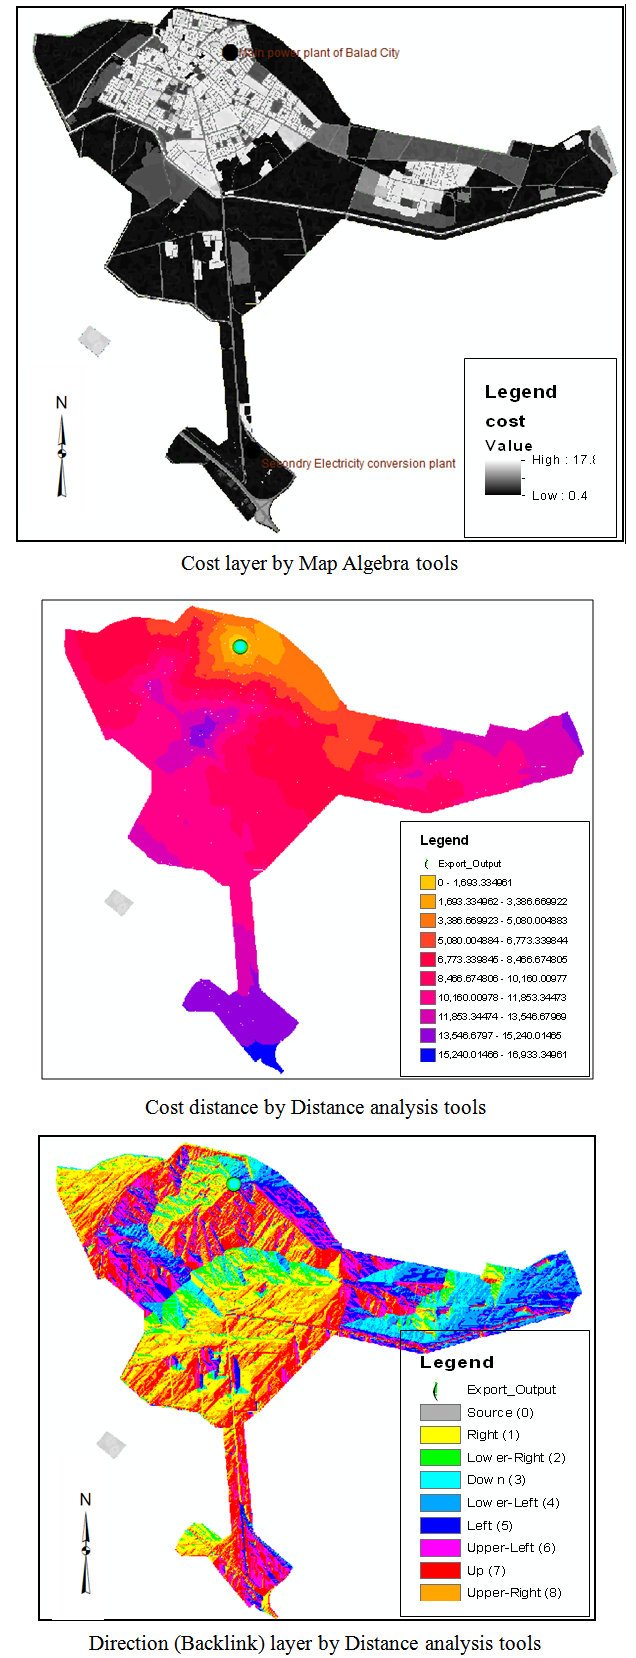 | Figure 7. Cost distance layers |
d) Create Destination: destination created by select the second target that optimum rout must ends on it or directed to it from the source (secondary Electricity conversion plant of the Balad city) as illustrated in “Figure 8”.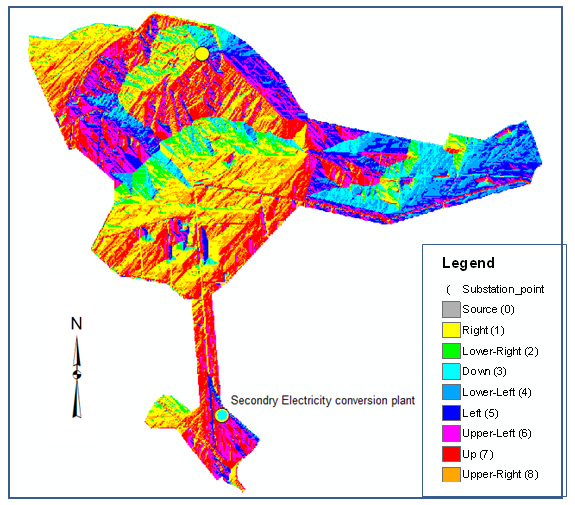 | Figure 8. Destination |
e) Shortest path: The shortest path was obtained between the main power plant and secondary electricity conversion station So as to ensure that no loss of electrical power for long-distance, as “Figure 9” Shown below.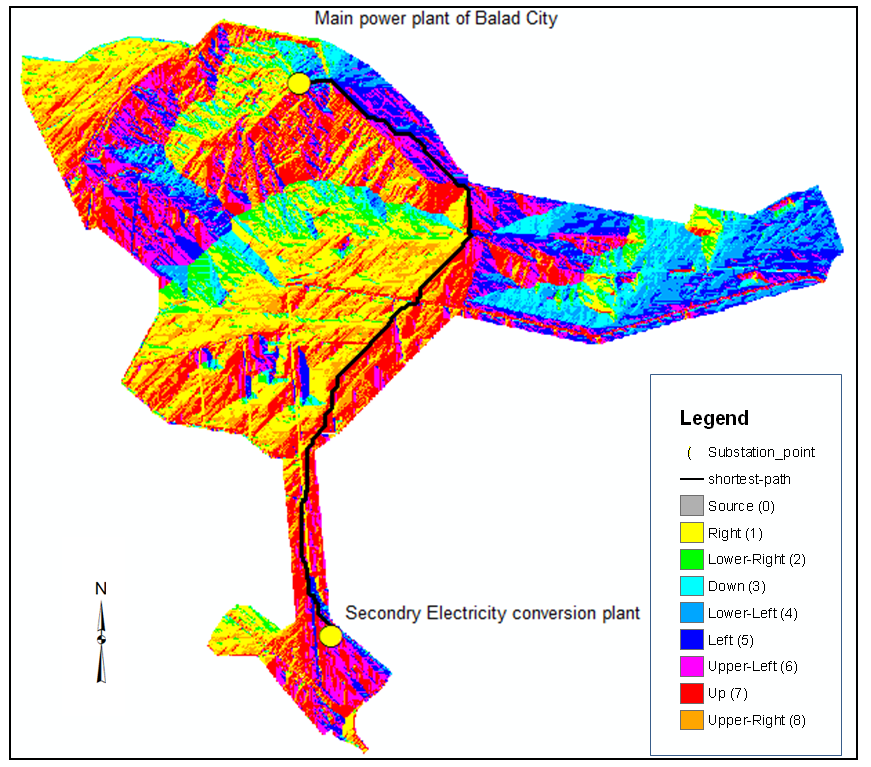 | Figure 9. Shortest path |
5.3. Examination the Path and Checking it
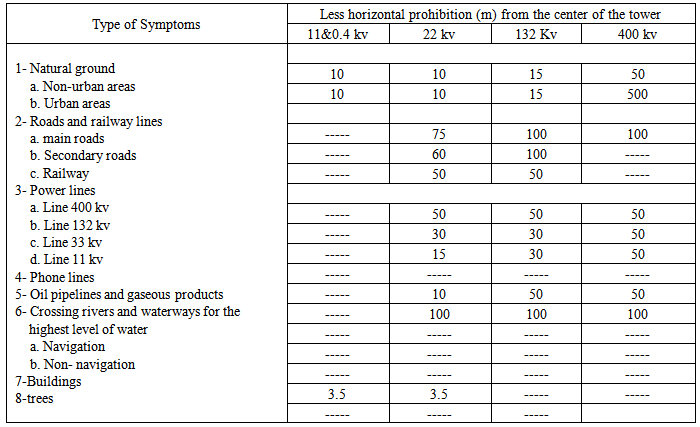
The proposed route for the path of electrical power transmission towers examined and checked depending on the determinants that taken from the Ministry of Electricity of Balad city, where this determinants contain the amount of a minimum allowances for junctions and horizontal prohibition for the electricity lines that show in “Table 1”. Where (Buffer) analysis was applied on the layers that contain these determinants by relying on the minimum distance allowances, then path was checked and modified in the case of intersect with one of these prohibition.Table 1. Determinants of the Ministry of Electricity for Balad City
 |
| |
|
The result has been to get the optimum path connecting between the main power plant and secondary electricity conversion plant of Balad city, which is identical to the design specifications and determinants imposed by the Ministry of Electricity as shown in “Figure 10”.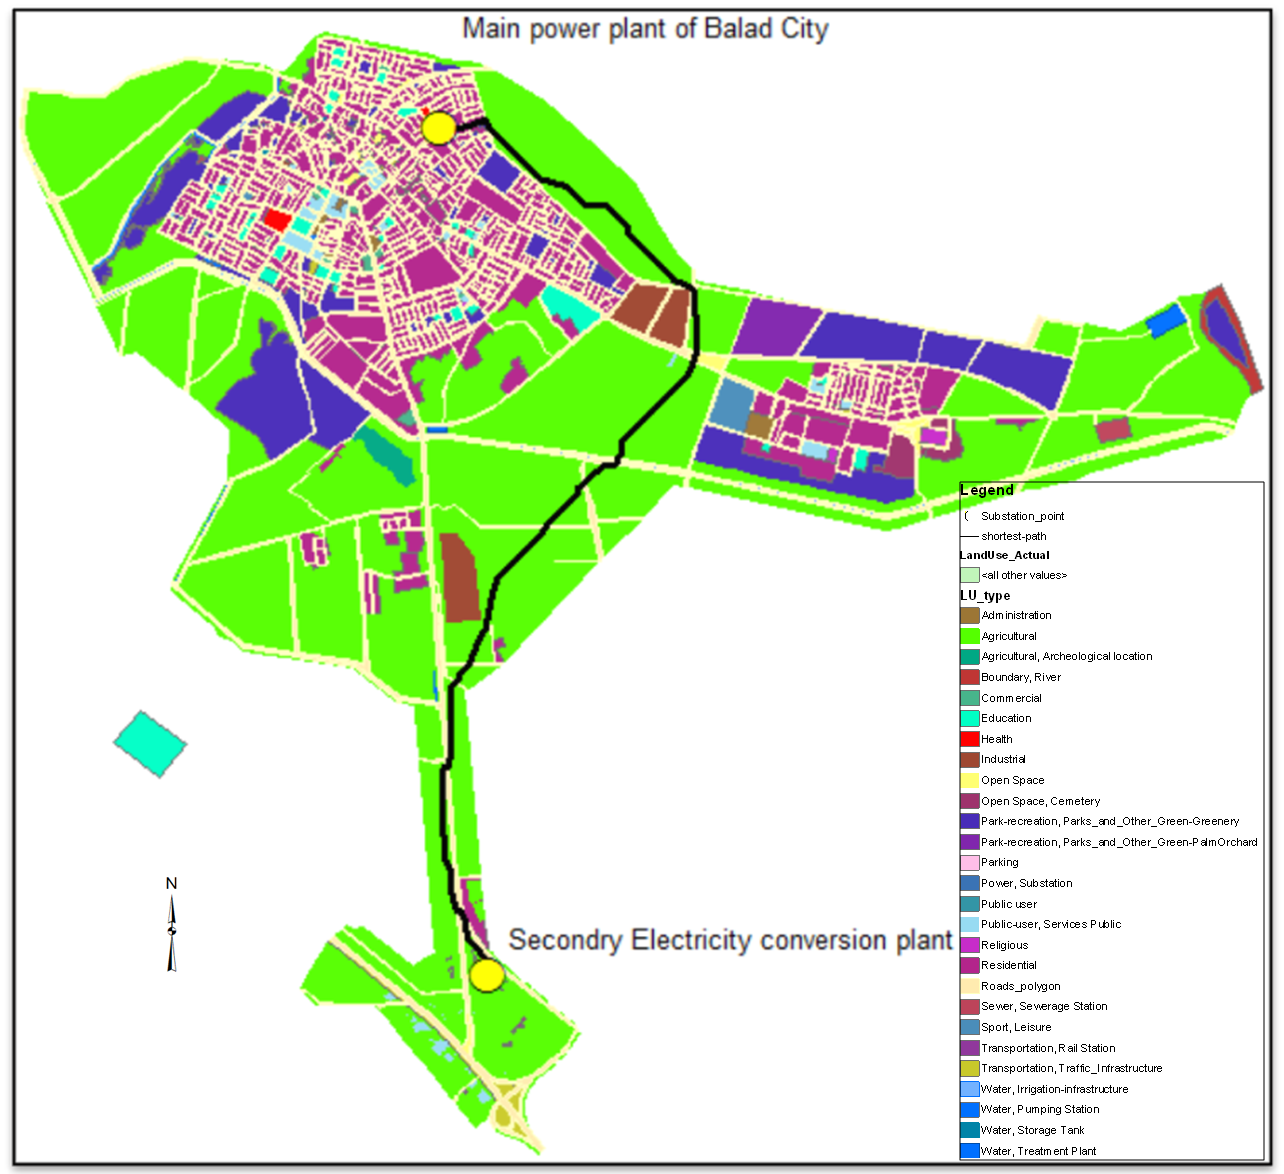 | Figure 10. Optimum path |
5.4. Surveying Work Related with Proposed Path
Surveying work included production of longitudinal section (profile) for the proposed path based on digital elevation model for the area of study using software (AutoCAD Civil 3D 2013).Longitudinal section shows the elevations of the natural ground for the proposed path, which is the design of base for a power transmission towers depended on it. The horizontal distances of this profile are designed depending on the horizontal distance that separates between the towers which should be (300 m) between any two consecutive towers, except in some region there is a possibility to increases or lessening this distance when it closed from symptoms or road, Also the design level for this path was been done, which represents the proposal level for the base of towers when carry out. This design level was chosen on the basis of reducing the amount of excavation or filling at each of the sites that designed to creating the base of towers. In additional, this proposal level is Maintain of equal in heights between the towers to minimize the distance of the path to the extent possible. As shown in “Figure 11”.Surveying works also included calculation of coordinates for the centers of towers for this proposal path in system (WGS_1984_UTM_Zone_38N) [15] for the purpose of stakeout by using one of the surveying equipment when carry out, as shown in “Table 2”.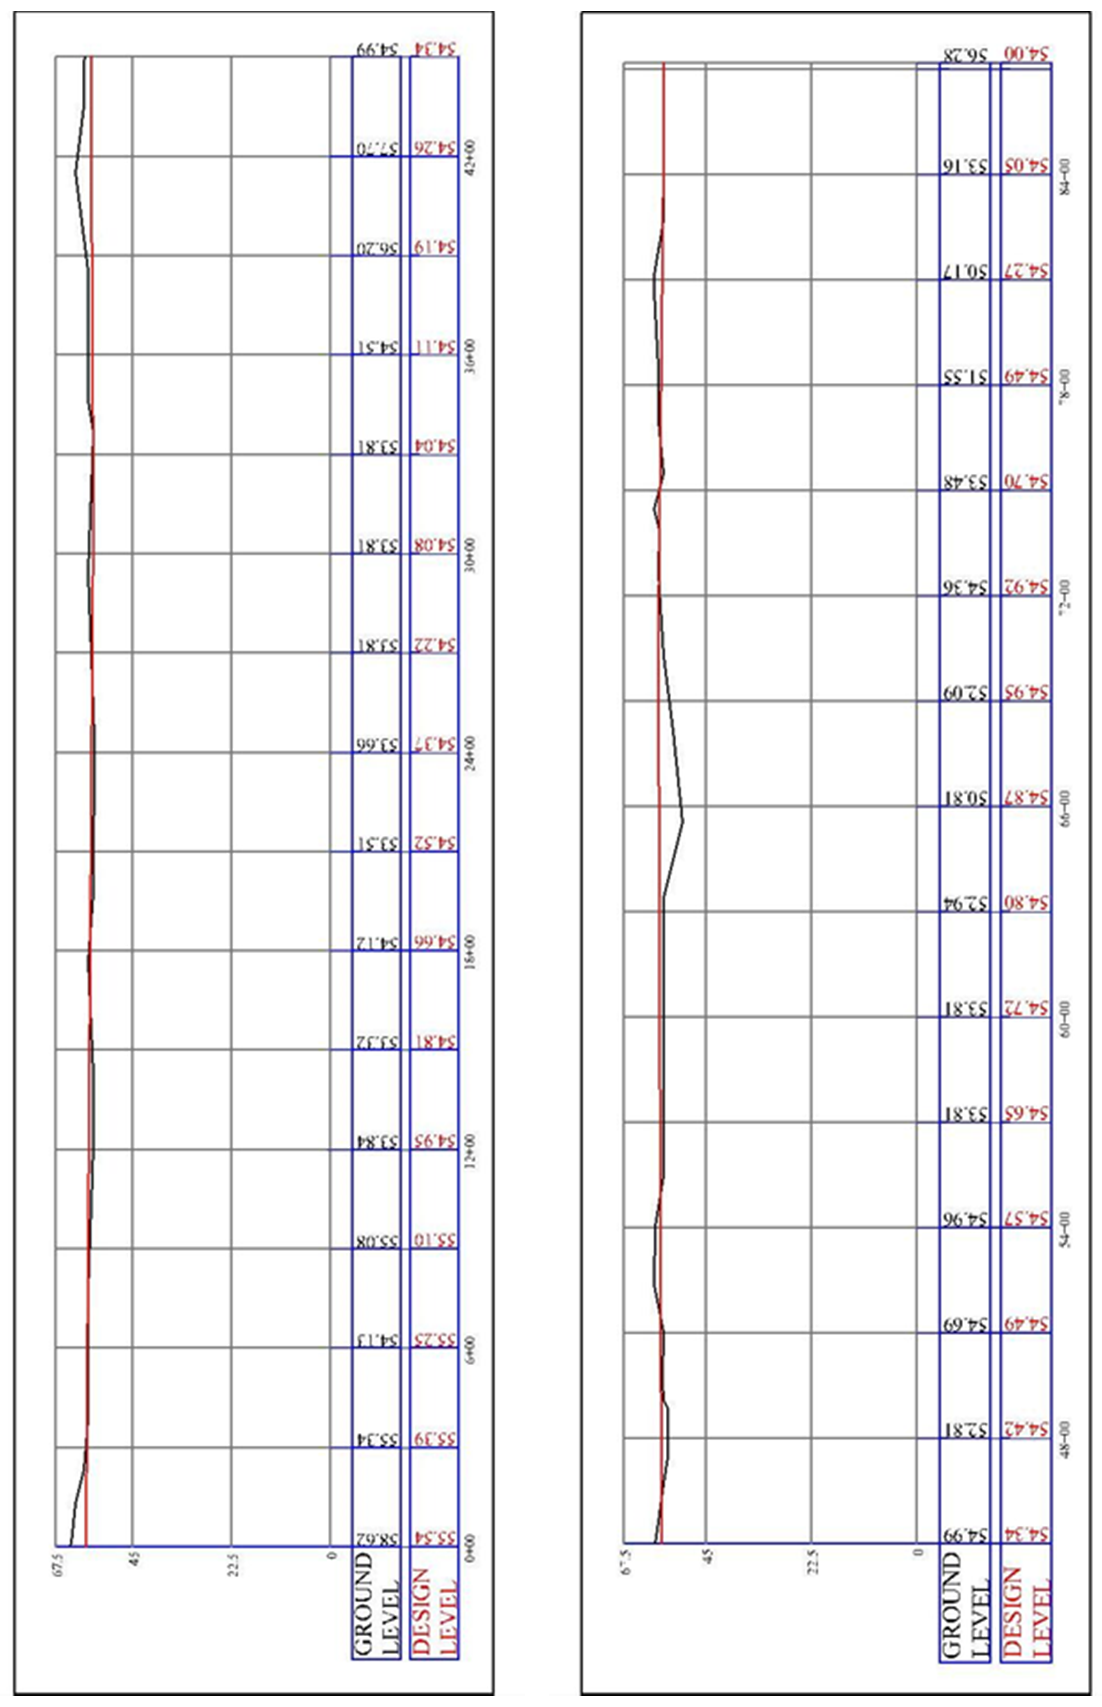 | Figure 11. Profile of the optimum path |
| Table 2. Coordinates of centre for power transmission towers |
| | Tower No. | Stations | Northing | Easting | Ground level | Design level | | 1 | 0+00 | 3764347.64 | 421698.73 | 58.62 | 55.54 | | 2 | 3+00 | 3764395.46 | 421983.60 | 55.34 | 55.39 | | 3 | 6+00 | 3764243.03 | 422193.35 | 54.13 | 55.25 | | 4 | 9+00 | 3764030.90 | 422405.48 | 55.08 | 55.10 | | 5 | 12+00 | 3763912.48 | 422663.88 | 53.84 | 54.95 | | 6 | 15+00 | 3763762.64 | 422898.77 | 53.32 | 54.81 | | 7 | 18+00 | 3763596.93 | 423123.73 | 54.12 | 54.66 | | 8 | 21+00 | 3763372.13 | 423308.96 | 53.51 | 54.52 | | 9 | 24+00 | 3763177.21 | 423532.05 | 53.66 | 54.37 | | 10 | 27+00 | 3762936.89 | 423637.57 | 53.81 | 54.22 | | 11 | 30+00 | 3762642.67 | 423651.69 | 53.81 | 54.08 | | 12 | 33+00 | 3762387.29 | 423508.38 | 53.81 | 54.04 | | 13 | 36+00 | 3762175.16 | 423296.25 | 54.51 | 54.11 | | 14 | 39+00 | 3761960.48 | 423087.65 | 56.2 | 54.19 | | 15 | 42+00 | 3761769.10 | 422934.60 | 57.7 | 54.26 | | 16 | 45+00 | 3761556.43 | 422732.76 | 54.99 | 54.34 | | 17 | 48+00 | 3761342.05 | 422523.14 | 52.81 | 54.42 | | 18 | 51+00 | 3761121.04 | 422324.76 | 54.69 | 54.49 | | 19 | 54+00 | 3760902.63 | 422120.75 | 54.67 | 54.57 | | 20 | 57+00 | 3760610.48 | 422056.77 | 53.81 | 54.65 | | 21 | 60+00 | 3760335.09 | 421948.50 | 53.85 | 54.72 | | 22 | 63+00 | 3760090.55 | 421779.67 | 52.94 | 54.80 | | 23 | 66+00 | 3759792.53 | 421773.73 | 50.81 | 54.87 | | 24 | 69+00 | 3759493.21 | 421764.80 | 52.09 | 54.95 | | 25 | 72+00 | 3759228.01 | 421713.73 | 54.36 | 54.92 | | 26 | 75+00 | 3758932.16 | 421723.73 | 53.48 | 54.70 | | 27 | 78+00 | 3758642.22 | 421773.73 | 51.55 | 54.49 | | 28 | 81+00 | 3758381.43 | 421854.95 | 50.17 | 54.27 | | 29 | 84+00 | 3758112.49 | 421961.02 | 53.16 | 54.05 | | 30 | 87+00 | 3757884.64 | 422089.74 | 56.18 | 54.07 | | 31 | 87+00 | 3757884.64 | 422089.74 | 56.28 | 54.00 |
|
|
6. Discussion and Conclusions
This study is applied to choose the best path for the transmission towers of electrical energy, high-pressure in the Balad city, Which connecting the power plant that located north of the city and secondary electricity conversion station south of the city. The best path was selected based on the facilities available for geographic information systems by building digital model of a three-dimensional for study area by using all data collected about area of study for the purpose of choosing the optimal path.Based on the study results, the following conclusions are made:1-From the presented problem it was easy to conclude how a vital role the GIS analysis could play in selecting optimum paths, because of its effectiveness and its logical visual (geographic) solutions for such problems.2-It has been shown that using GIS in selecting paths can be flexible and has the capability to expand easily and accommodate any additional required data layers, such as soil and geological features, to represent the real world, On the other hand, the model can take additional data and layers that comes from the future plans of the study area. Also run the constructed model every time we need to get new solutions in a very short time.3-The importance of the 3D-Model that represents land uses came from the interaction between 3D-Analyst and Spatial Analyst extensions when the slope of the topography was considered in selecting the optimum path. The division of the study area according to its slope and merging the different slope areas with the forbidden and permissible areas prove the importance.4-This study proved the possibility of GIS in controlling of the desired path passes. Through the possibility of identifying areas which path passes through it, Such as open areas and empty areas that do not contain residential buildings or excesses, In addition to the possibility of preventing the path from passing in forbidden areas and sensitive areas, Such as water areas and steep areas, according to the terms of design that we want.5-Interface with CADD & Civil 3D software (Softdesk) allows interaction with the capabilities of GIS model, because ArcView is very limited in design features. This property allows to giving the geometric design that contains design level and the geographic coordinates necessary to set out the optimum path.
References
| [1] | B. A. Carreras, V. E. Lynch, I. Dobson and D. E. Newman, “Critical Points and Transitions in an Electric Power Transmission Model for Cascading Failure Blackouts,” Chaos, Vol. 12, No. 4, 2002, pp. 985-994. doi: 10.1063/ 1.1505810. |
| [2] | R. Bapat, I. Gutman and W. Xiao, “A Simple Method for Computing Resistance Distance,” Zeitschrift für Naturforschung, Vol. 58a, No. 9-10, 2003, pp. 494-498. |
| [3] | X. Zhang, “Shortest Path’s Probability Distribution of Stochastic Road Network,” Master Thesis, 2010. |
| [4] | Dawwas, M. Emad Basheer Salameh, "GIS as a Tool for Route Location and Highway Alignment", An-Najah National University, Nablus, Palestine, 2005. |
| [5] | Richard P. Greene and James B. pick, "Exploring the urban community: a GIS approach", P.CM, 2006. |
| [6] | Shafi'i, Sherif Fathi, "The Basics And Principles Of Remote Sensing," Scientific Library for Publishing and Distribution, Cairo, 2009. |
| [7] | Ben Salma, Nasser Mohammed, “Maps of human distributions“, the concept and methods of its inception, Obeikan Bookstore, Riyadh, 1995. |
| [8] | Kang-Tsung Chang, "Introduction to Geographic Information Systems", fifth edition, McGraw-Hill Science Engineering, 2009. |
| [9] | ESRI educational services, "Introduction to Arc View GIS", (1998). |
| [10] | Abdul-Kadhim, Haider Ismail, "The Principles of Geographic Information Systems", Ministry of Higher Education and Scientific Research, University of Technology, Department of Building and Construction Engineering, 2009. |
| [11] | Daowd, PHD. Juma Mohammed, "Introduction to digital maps", Mecca, Saudi Arabia Kingdom 2012. |
| [12] | Artimo, K., “Concepts, Definitions and Theory in the Modern Cartography”, 16th International Cartographic Conference Proceedings, Vol.2, May 1993, Cologne, Sayfa 1121-1127. |
| [13] | Ali, PHD. Abdul Haq Abdul Hadi "Accuracy in Digital Base Map Production for Hillah City", Ministry of Higher Education and Scientific Research, Babylon University, College of Engineering, 2009. |
| [14] | Al-Joboory B. S., Al-Bakry M. M. and Al-Hamadany O. Y., "THE SELECTION OF OPTIMUM ROAD PATH USING GEOGRAPHIC INFORMATION SYSTEM (GIS)", University of Baghdad, college of engineering, Department of Surveying, Journal of Engineering, 2006. |
| [15] | Abadi, PHD. Khadr "Cartography in map projections", Ministry of Higher Education and Scientific Research, University of Baghdad, College of Engineering, Survey Department 1980. |
 Abstract
 Reference
 Full-Text PDF
 Full-text HTML