American Journal of Geographic Information System

p-ISSN: 2163-1131    e-ISSN: 2163-114X

2014;  3(3): 109-121

doi:10.5923/j.ajgis.20140303.01

Using Geographically Weighted Regression to Estimate the Spatial Patterns of Fuelwood Utilization in Nigeria

Ali I. Naibbi, Richard G. Healey

Department of Geography, University of Portsmouth, Portsmouth, PO1 3HE, UK

Correspondence to: Ali I. Naibbi, Department of Geography, University of Portsmouth, Portsmouth, PO1 3HE, UK.

Email:

Copyright © 2014 Scientific & Academic Publishing. All Rights Reserved.

Abstract

While the use of fuelwood for cooking among households in the various states of Nigeria supersedes any other cooking fuel type, the consumption pattern is spatially heterogeneous in the country. This paper uses Nigerian socio-economic data and fossil fuel distribution data obtained from the National Population Commission and the Nigerian Petroleum Corporation respectively to identify the diverse spatial pattern of fuelwood utilization in Nigeria, using Geographically Weighted Regression (GWR) model (local regression). The results of the local regression model coefficients highlights the relationships of fuelwood usage with its impact factors, as well as the spatial variations in the use of fuelwood amongst the 36 states of Nigeria (and Abuja the capital city). The analysis of these results, supported by the existing literature, leads to the conclusion that the northern part of the country uses more fuelwood than the south, which is closely related to the region’s socio-economic activities. This method reveals the local aspects of the relationships which may be concealed when qualitative analysis or global regression (which assumes that one model fits all) are used.

Keywords: Nigeria, Northern Nigeria, Fuelwood, Fossil Fuel Supply and Geographically Weighted Regression (GWR)

Cite this paper: Ali I. Naibbi, Richard G. Healey, Using Geographically Weighted Regression to Estimate the Spatial Patterns of Fuelwood Utilization in Nigeria, American Journal of Geographic Information System, Vol. 3 No. 3, 2014, pp. 109-121. doi: 10.5923/j.ajgis.20140303.01.

1. Introduction

The report of the 2011 United Nations Development Programme (UNDP) assessment of the Millennium Development Goals (MDGs) included Nigeria among those countries requiring further effort to improve their energy situation [1]. This was earlier highlighted in the 2005 UNDP MDGs report, which stressed the need to reduce the high dependence on fuelwood. The report also indicates that the majority of the countries participating in the MDGs project (including Nigeria) take little notice of the energy requirements of poor people, by only treating energy development within the context of large-scale infrastructure projects, without taking on board the traditional sources of energy in their policy decisions. The continued lack of commitment shown by most of the developing countries to address the problem of energy deprivation is reflected in the energy poverty seen today in many countries (see for example, [2-4]). At present, more than 2.4 billion people worldwide rely on traditional biomass as their primary source of energy and more than 1.6 billion people have no access to electricity [5-10]. Based on these figures, it can be argued that a large segment of the world’s population is deprived of improved energy services that can advance their economic growth and social equality. For example, the electricity supply in Nigeria is erratic and of poor quality [11-13], and is so unreliable that people now depend on their own power generators in order to meet their demands. The electricity generating figures suggest that Nigeria produces less than half of the Ghanaian average, nine times less than the African average, and 22 times less than the world average [14]1. Thus, the majority of the population have to depend on traditional fuelwood for their cooking.
The National Energy policy plan of Nigeria emphasised that the use of fuelwood should be discouraged by promoting the use of alternative energy sources to fuelwood ([15], p.25). However, this is hampered by the unreliability in the supply of other energy options in the country (like oil, natural gas, tar sands, coal, nuclear, hydropower, solar and wind).
Anozie et al. ([16], p. 1284) highlighted some of the efforts of the Nigerian government through its Energy Commission and the numerous other research contributions in addressing the energy situation. They concluded that the majority of the energy targets set by the government remained unmet, due to lack of policy implementation, general lack of awareness from consumers of the compelling need to conserve energy and lack of logistics and proper funding. All the four impediments to the improvement of the energy situation in Nigeria described by Anozie et al. ([16]) focused on the laxity of the policy makers in either not funding the sectors efficiently or not policing the laws that would regulate the proper use of energy in the country. For example, the Nigerian government in its efforts to improve access to energy has adopted the policy of subsidising fossil fuels [17], in terms of distribution and pricing subsidies, in order to achieve a uniform price throughout the country ([18], p.236). However, no consistency in terms of sufficient fossil fuel supply has ever been achieved [17-18]. In the light of this, switching to the use of fossil fuels (gas and kerosene) in Nigeria has proved to be very slow, hence another reason for the dependence on the use of fuelwood by households in most of the African countries ([19-20]. It is against this background that it is appropriate to provide an academic assessment of the salient issues in the Nigerian energy situation with particular emphasis on the traditional energy (fuelwood) situation, as wood is the major source of cooking energy in the country [21-22].
The aim of this paper is to improve our understanding of the underlying drivers of fuelwood dependency among households in Nigeria, and to improve the literature on fuelwood utilization drivers by unravelling mechanisms which may have particular implications for the high use of fuelwood in Nigeria. The study employs a spatially local regression analysis using the socio-economic characteristics of the population and fuel supply in the 36 states of Nigeria and the capital city Abuja. It should be noted that this paper does not address the complex pattern of fuelwood utilization across the developing countries or the difficulty in analysing such complexities using simple linear regression, as highlighted by Mahiri ([23]). It is also beyond the remit of this paper to evaluate comprehensively the socio-economic impact of fuelwood demand and supply in Nigeria.
The paper begins with a brief review of the recent fuelwood consumption debate in the developing countries and Nigeria. Next, the methodological approach to the study is given, and a description of Geographically Weighted Regression (GWR) provides important background to the subsequent sections. The results of the regression models based on the Principal Component Analysis (PCA) outputs are represented, followed by visual interpretation of the local coefficients maps showing the spatial distribution of local parameter estimates. The paper concludes with a discussion of the policy implications of the results.

1.1. Fuelwood Versus Other Energy Types

Fuelwood is a renewable form of energy that has continued to be the dominant energy option (especially for cooking) for most people in the developing countries [24-29]. Results from recent studies of the Nigerian fuelwood situation suggest that the population has been moving back to the use of fuelwood in recent times. For example, a study conducted in Kano city in Northern Nigeria by Maconachie et al. ([29]), which investigated the consumption pattern of fuelwood among households over at least two decades, revealed that several families, despite using other cooking fuels in the past, are now reverting to the use of fuelwood. Even though there is now a general consensus about the large scale dependence on fuelwood among households in the developing countries, some of the early fuelwood investigators were of the opinion that unless there was a change in the situation, the future demand for fuelwood would be unsustainable. There are various reasons for this, including among others, population increase, poverty and inconsistency in the supply of fossil fuels in the region (see for example, [29-30]). Increasing poverty has frequently been reported in both the developed and the developing countries as a driving factor in the use of fuelwood. For example, Arabatzis et al. ([31], p. 6495) reported that because of the economic crisis in Greece, there is an increased consumption of fuelwood, especially in rural areas.
Nigeria has estimated forest and woodland reserves of 11 million hectares and produces about 110,000 tonnes of fuelwood per day [32]. While Nigeria’s forest area as a percentage of its total land mass is less than 10% [7], the fuelwood utilization in the country (120,000 tonnes/day) surpasses its production, making it the only energy source in the country where utilization surpasses production. This is potentially catastrophic given that the country has been experiencing problems with its forest management [33], and most areas in the north have been declared unsustainable in terms of fuelwood production [34]. Sambo ([35]) maintained that several factors ranging from population growth to the low technical efficiency of the traditional cooking style are responsible for Nigeria’s high dependence on fuelwood. However, one other key factor that is lacking from Sambo’s observation is the unreliability in the supply of alternatives to fuelwood in the country, which is linked to major allegations of corruption and irregularities from both the government and the marketers of fossil fuels ([29-30]). These factors are also assumed to be the potential cause of the high demand for fuelwood in Nigeria where more than 70% of households use it for their cooking, making it the most used form of cooking energy in the country [35]. Therefore the over-dependence on fuelwood in Nigeria can be attributed to its availability and affordability compared to the other sources of energy (like cooking gas and electricity), which Odihi ([36]), Maconachie et al. ([29]) and Naibbi and Healey ([30]) have described as a sign of fuel poverty. For example, Unwah (2007) in Maconachie et al. ([29] p.1096), noted that while Nigeria as an oil producing nation sells a 12.5kg cylinder of cooking gas for N3000, the same quantity retails for N1200 in its neighbouring Benin republic (which does not produce oil). It is therefore not surprising that Nigeria now imports cooking gas from Benin and the Niger Republic, which Maconachie et al. ([29]) attributed to the wide scale problems surrounding the petroleum sector.

2. Materials and Methods

2.1. Study Area

Nigeria’s population is estimated at about 170 million with an annual growth rate of 2.8% [37]. Even though Nigeria is a wealthy country in terms of human and natural resources, its social and economic development is quite slow, mainly due to the country’s high level of poverty, lack of basic social infrastructure and above all, the high level of corruption [38]. For example, about 65% of the people are living on less than US$1.25 a day ([13], p. 16 & [37], p.63). Table 1 shows some socio-economic indices of the country, while Figure 1 shows a map of Nigeria. From Table 1, the Human Poverty Index (HPI) data reveal that poverty is prevalent in the northern part of the country (with the exception of Abuja, which is the seat of power in the country). Comparatively, all the southern states have a higher Human Development Index (HDI) with lower HPI values than the northern states.
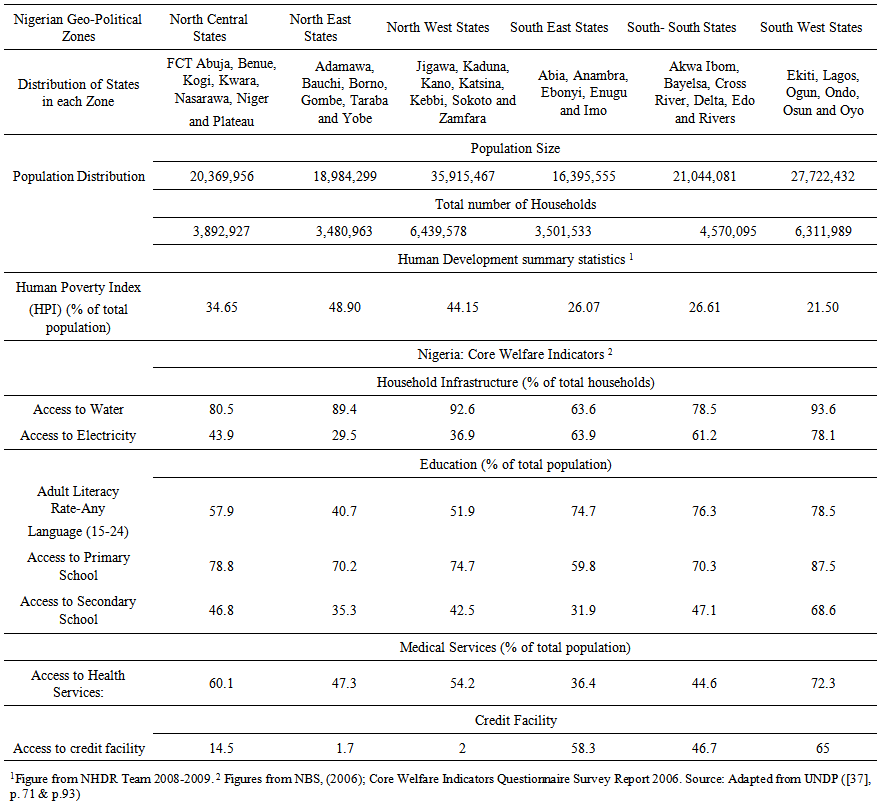
Table 1. Some Socio-Economic Indicators of Deprivation in Nigeria
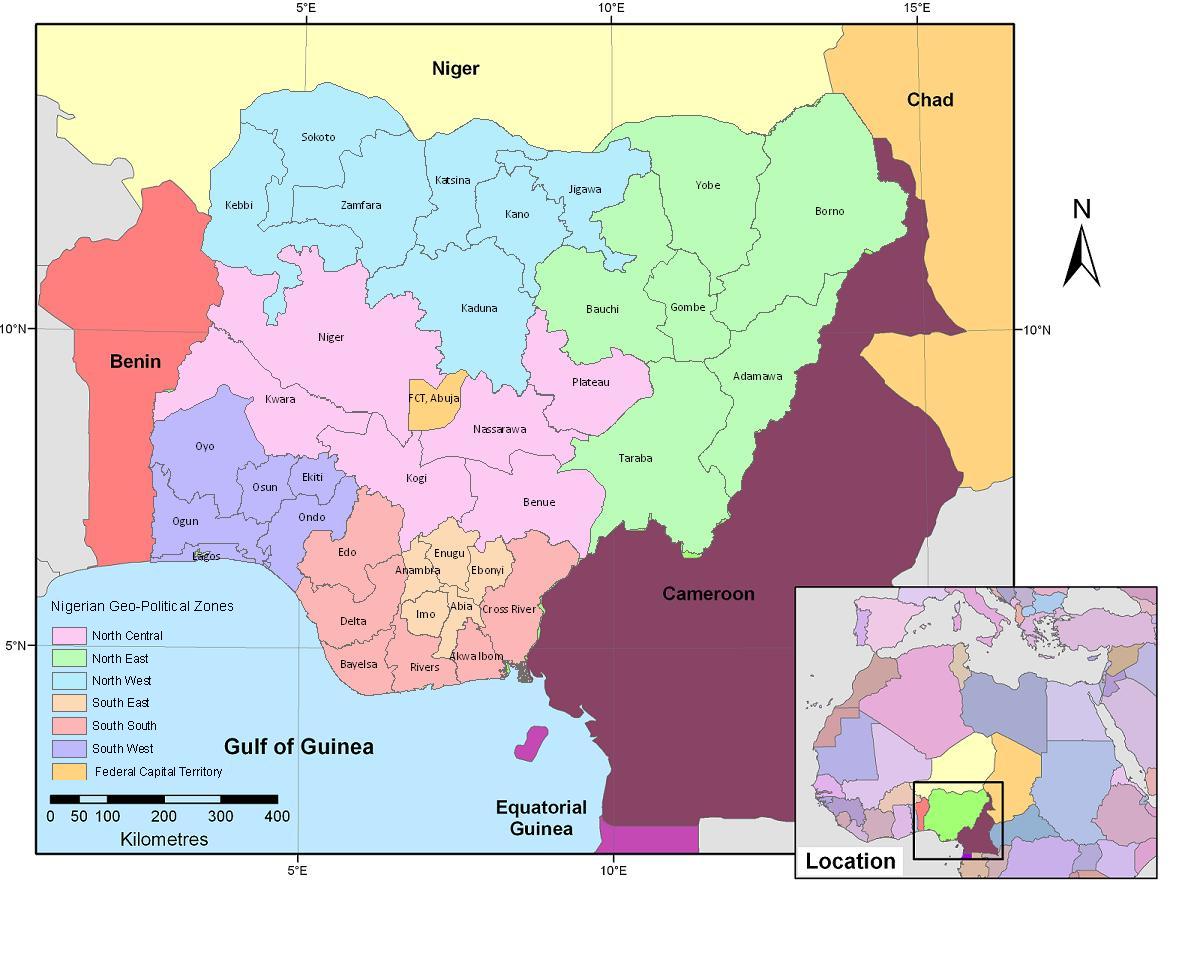
Figure 1. Map of Nigeria showing its Geo-Political Zones
The states with the most pronounced poverty in order of intensity are Yobe, Borno, Kebbi, Katsina, Bauchi, Jigawa, Gombe, Taraba, Kano, and Niger, which are all in the north. With the exception of Abuja, all the states with the lowest HPI values are located in the southern part of the country ([37], p. 91-94). This could be another reason why more than 80% of the households in the Northern part of Nigeria depend on fuelwood, compared to the less than 50% of households in the majority of the southern states [30]. A selected number of human development benchmarks that are reported in Table 1 further reveal that the life expectancy for all the zones are similar: 51 years for South West; 48 years for North Central, North West and South East; and 47 years for North East and South South [37].

2.2. An Overview of Spatial Interaction Studies Using Geographically Weighted Regression (GWR)

Human activities have a strong spatial component and because they vary from place to place, spatial heterogeneity is usually present in socio-economic relationships. It is possible to capture this spatial heterogeneity when modelling the structure of these relationships. Regression analysis is one of the traditional methods that are used in explaining these variations because it allows one to model, explore and examine spatial relationships and to be able to predict their outcome based on a series of observations [39]. However, there are many types of regression models available that are used in modelling both global and local relationships. The term global relationship is applied when the relationship between the dependent variable and the independent variable (explanatory variable) is assumed to be constant across the study area at every possible location. This is one of the disadvantages of a global regression model when applied to spatial data [40]. In this technique, the dependent variable, is modelled as a linear function of a set of independent or predictor variables. The regression equation is expressed as follows:
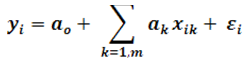
(1)
Where yi is the ith observation of the dependent variable, Xik is the ith observation of the kth independent variable, the εis are independent normally distributed error terms with zero means, and each ak must be determined from a sample of n observations ([41], p.282-283).
On the other hand, GWR is a local regression method which generates spatially varying parameters that express the variation in the relationships among variables [41]. GWR is a relatively simple technique that extends the traditional regression framework of equation (1) by allowing local variations in rates of change so that the coefficients in the model rather than being global estimates are specific to a location i ([42], p. 284). The regression equation is expressed as follows:
(2)
Where aik is the value of the kit parameter at the location i. The weight assigned to each neighbouring observation in equation (2) is based on a distance decay function centred on observation i. This function is adjusted by a bandwidth setting at which distance the weight rapidly approaches zero. The bandwidth is either adjusted manually or using an algorithm that seeks to minimise a cross-validation score or the Akaike's Information Criterion (AIC) score, which pro-vides a measure of the difference between the observed value and the predicted value [40].
Charlton et al. ([43]) employed Analysis of Variance (ANOVA) to compare the improvements of a global regression model with a GWR model (a local regression model) using educational attainment in the counties of the state of Georgia, USA, data as a case study. They found that among the two models, the GWR model provided an improvement in terms of explaining the data. Bitter et al. ([44]) also compared GWR and a global regression method to examine spatial heterogeneity in housing attribute prices in the Arizona housing market. Their result also confirmed that GWR has more explanatory power and predictive accuracy than the standard global regression model.
Even though GWR is widely used among researchers to explore spatial relationships, especially in studies of health, crime, housing, and recently in the study of drivers of afforestation [45] and deforestation [46]; it has not previously been employed in the analysis of fuelwood consumption patterns. One popular model used in the study of fuelwood is the Woodfuel Integrated Supply/Demand Overview Mapping (WISDOM) model ([27] & [47]). Although both the WISDOM and GWR models provide results that show spatial heterogeneity, the two differ in their approach to data analysis. While WISDOM is confined to mapping hot spots of fuelwood deficit, GWR is a universal modelling technique that has been used in different fields, as indicated earlier. Hence the GWR approach has been adopted here to explore the spatial heterogeneity of fuelwood usage in Nigeria using socio-economic indicators as the explanatory variables.

2.3. Data Sources, Organization and Interpretation

Data for this study were obtained from National Population Commission of Nigeria (NPC), the Nigerian National Petroleum Corporation (NNPC) and the National Bureau of Statistics (NBS). It should be noted that all the data used here are official figures. The relevant organisations have explained in great detail on their various websites how such data were generated and disseminated. The data used for the study are briefly described in Table 2. The socio-economic data provided counts of population (which were converted to population density), houses with more than three rooms (for sleeping), detached houses, huts, flats in blocks of flats, rented accommodation, educated adults (number of people over 15 years who are educated) and details of fuelwood usage. They were obtained from the 2006 Nigerian national census [48]. Unemployment data were obtained from NBS. The data on the distribution of fossil fuel, i.e. petroleum, kerosene and gas products were obtained from NNPC’s Corporate Planning and Strategy Division (CP&S) in its 2010 Annual Statistical Bulletin.
Table 2. Dependent Variable Descriptions and Summary of National Statistics
Despite no previous studies of the fuelwood situation using GWR, many global regression models have been developed that show the direct relationships between socio-economic activities and energy use. Legros et al. ([49]), for example, used multiple regression techniques to show that access to modern energy (electricity and all liquid and gaseous fuels used for cooking) and human development measures are significantly related. The development measures considered by Legros et al. [49] in their model to explain the relationships included education and poverty.
In a different study, Lenzen et al. ([50]) analysed the energy requirements of households in Sydney using multiple regression. Their model showed that education, house type, age groups and employment were significant in explaining the energy requirements of households in Sydney. Therefore, this study considered the combined socio-economic variables used by Legros et al. ([49]) and Lenzen et al. (50]) that have indicated significant relationships with energy access and requirements in their respective studies. This study used population (population density), education (educated adults >15yrs), house ownership (rented houses), housing type (detached house, flats in block of flats and huts), house size (>three rooms), age (children who are <15years old), unemployment status and fossil fuel distribution in Nigeria to explain the variation in the use of fuelwood among households in the various states of Nigeria (see Table 2). The variables in Table 2 (data sets) were standardised by converting each of the variables to a percentage before the analysis. A Microsoft Office Excel spreadsheet was used in organising the data while SPSS statistical software and ArcMap 10.1 software were used in analysing the data.

2.4. Pre-Analysis Phase

Although the use of GWR has been found to be successful in explaining local spatial heterogeneity, it also has its shortcomings. One of the problems has been that the model can only explain the spatial variation of the explanatory variables specified in the model. Bitter et al. ([44]) have highlighted the possibility of omitted variables being responsible for explaining much of the variation in the data. Fotheringham et al. ([51]) have suggested that the best way to circumvent this kind of problem is to explore the spatial variation of each of the explanatory variables with the dependent variable separately (visual mapping) in order to observe if there is a relationship, before deciding which variables are to be included in the model.
Another issue with the GWR model is that spatial variations in a relationship may simply be caused by random sampling variations in the study area. And because the GWR model is only interested in the relatively large variations in the parameter estimates that are not likely to be caused by sampling variation alone, the random sampling variation effects, if not spotted and addressed prior to model building, may affect the final result. For this reason therefore, a simple correlation and scatter plot were used to diagnose the variables proposed in the model (note that all the variables were standardised prior to the commencement of the analyses).

3. Results

3.1. Correlation Analysis

The results of the correlation analysis (see Table 3) reveal some initial associations. As anticipated, the use of fuelwood will increase as a result of the following situations; when there is high unemployment (a sign of poverty); when there are numerous households with many rooms (indication of overcrowding); and when the area is rural (huts). It is also expected that the use of fuelwood will decrease in urban areas, where houses are rented and living space is mostly restricted to block of flats (all these are further investigated using OLS regression).
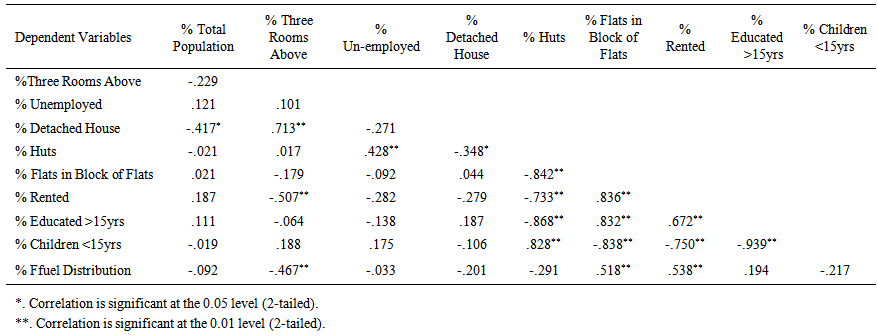
Table 3. Correlation Coefficients
While most of the variable associations are in the expected directions with fuelwood usage, some exhibit multicollinearity. For example, results from Table 3 reveal that multicollinearity exists between detached house and >three rooms variables (0.71), rented accommodation and flats in block of flats (0.84), educated>15yrs and flats in block of flats (0.83) and educated>15yrs and rented accommodation (0.67).
Given these findings of multicollinearity among the model variables, there is the need to explore them further in order to exclude some of them from the model or simplify them. Through this procedure, a better model can be achieved while avoiding the complexities of including two or more variables that are explaining similar effects. However, because of the difficulty of determining which variables should be excluded from the model due to multicollinearity, a Principal Component Analysis (PCA) was used to simplify the variables into a smaller number of independent dimensions of variation (see for example, [41]). PCA attempts to explain a set of data in terms of a smaller number of dimensions by selecting those components that may explain as much of the variance in the sample as possible [39]. The PCA was undertaken in SPSS using the following equations [39]:
(3)
Where the bs in the equation represent the factor loadings. The new variables (var) in the equation contain all the information in the original measured variables (Table 3). Using the PCA equations above, the data variables are grouped into three principal components (interpreted as Industrial States, Less Industrial States and Deprived States), which are fed into the GWR model. Note that the names (industrial, less industrial and deprived states) are somewhat arbitrary and given for the convenience of relating the effects of the variables on fuelwood use, because there are no supporting arguments from the literature that specifically justified the choice of these names.

3.2. PCA and OLS Regression Diagnostic Model

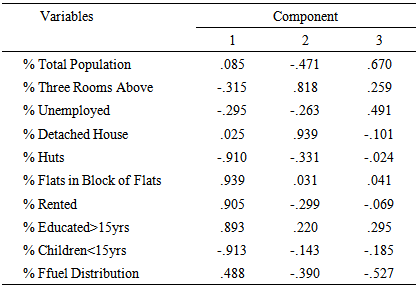
Three orthogonal components were identified from the PCA results accounting for a cumulative variance of 86% in original variables using a cut-off point value (Eigenvalue) of 1. The first PCA contributed 50.9% of the total variance while the second and third contributed 23.6% and 11.6% respectively. The three PCA components are named based on their loadings in relation to the original variables. From Table 4, the first component had positive loadings on flats in block of flats, rented houses, educated adults, and the supply of fossil fuel, while the rest of the variables had loadings that were either negative or close to zero. This mixture of characteristics describes those states that are actively engaged in industrial activities (concentration of industries or commercial activities), so these are therefore referred to here as “INDUSTRIAL STATES”.
Table 4. Principal Component Matrix Extraction (3 Components Loadings)
     
The second component had positive loadings on households with more than three rooms, detached houses and educated adults, while the remaining variables had loadings that were either negative or zero. This component describes states where the main activities are either agriculture for subsistence or commercial activities. So these states are categorised as “LESS INDUSTRIAL STATES”. The third component had positive loadings on unemployment, households with more than three rooms, and educated adults. The last of these is perhaps strange, given that all the other variables positively associated with the third component are indicating some level of deprivation. However, the component is retained at this stage and describes “DEPRIVED STATES”. The third component was retained because all the three components were subsequently examined using OLS regression for purposes of statistical validation before using them in further analysis. Therefore the new model variables to explain the situation of fuelwood use in Nigeria are the three resulting components of the PCA, named to identify the groups of states with which they are most closely associated (industrial states, less industrial states and deprived states). The use of an OLS regression model is regarded as good practice for model fitting ([40] & [50]). So this approach was used to examine the relationships between the dependent variable (fuelwood use among households in Nigeria) and the independent principal components (industrial states, less industrial states and deprived states) (Table 5).
Table 5. Summary of OLS_All Results
     
From the results of the OLS test (Table 5), the deprived states component is negatively correlated with fuelwood use. This is unanticipated because the use of fuelwood would be expected to increase as the level of deprivation increases. One possibility is that the model might be lacking some key explanatory variable elements, but no guidance is available from the literature. However, given that the deprived states coefficient is reported as being insignificant, this indicates there is no justification for including the deprived states component in the overall model. For that reason, the OLS model was re-run with only industrial states and less industrial states components (OLS_ND). The results are presented in Table 6.
Table 6. Summary of OLS_ND Results
     
From Table 6, both industrial and less industrial states retained their coefficients in the expected direction with fuelwood use, and were all statistically significant (robust probability; 0.00 & 0.00 respectively). Also, given that the variance inflation factor values (VIF) for the industrial states and less industrial states components are only just above one, there is no redundancy among the two explanatory variables (i.e. the two variables are capturing dimensions of variation). This suggests that the choice of the explanatory variables in the model is justified. Further checks on the choice of the two variables were conducted and are presented as the OLS Diagnostics test results in Table 7.
Table 7. OLS Diagnostics Test Results
     
Several test results from this table can be highlighted. Firstly, the significance of the model coefficients is confirmed by the Koenker (BP) statistic. However, this statistic indicates that the relationships between the explanatory variables and the dependent variable are non-stationary. This means, for example, that the industrial and less industrial states components are important predictors of fuelwood usage in some states of Nigeria, but perhaps weak predictors in other states. Looking at the performance of the model (Adjusted R-Squared from Table 7), the model explains about 73.9 % of the total variation in the use of fuelwood in Nigeria. The Jarque-Bera test is not statistically significant and therefore the model is said to be unbiased, which means that the model is not missing key explanatory variables. This is helpful in addressing concerns raised in relation to the eliminated third component.
Finally, the significance of the model residuals are tested to make sure that they are free from spatial autocorrelation (spatial clustering of over and under predictions). The results of the Spatial Autocorrelation test on the model’s regression standardised residuals (Spatial Autocorrelation (Moran’s I), indicates a random distribution. The z-score of the Moran’s I is not statistically significant (1.52), so the null hypothesis of complete spatial randomness of the residuals is accepted.

3.3. GWR Model

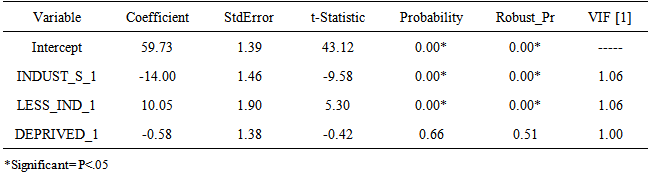
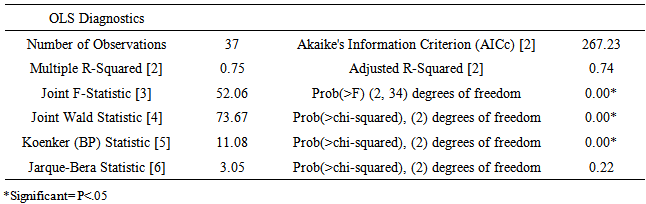
Since the test results (OLS and Moran’s I) have all confirmed the significance of the model choice in explaining the variation in the use of fuelwood in Nigeria, and the Koenker (BP) statistic (Table 7) is also statistically significant, the model results are likely to be improved by using GWR.
The result of the GWR model is presented in Table 8. From Table 8, there is some improvement in the model compared to the OLS model discussed above. Using 37 neighbours to calibrate the local regression equation, the GWR yields more optimal results than the OLS regression based on the Akaike’s Information Criterion (AICc) method. For example, the Adjusted R2 value is higher for GWR than it was in the OLS model (OLS was 73.9%; GWR is 80.1%).
Table 8. GWR Model Results
     
The AICc value is also lower for the GWR model (252.6) compared with the OLS (267.2). This decrease indicates a small improvement in the model performance when GWR is used.
The Spatial Autocorrelation result also confirmed that the z-score for the standard residuals of the GWR model is statistically insignificant, therefore the null hypothesis of complete spatial randomness in model residuals is accepted and the results of the coefficients were accepted as significantly describing the spatial variation of fuelwood use between the 36 states in Nigeria (and FCT).

3.4. Local Regression Parameter Estimates from the GWR

One of the primary advantages of GWR is the ability to visualize the local regression coefficient estimates in order to identify local model heterogeneities. However, visualization of GWR results has remained a focus of debate. While some authors noted that presenting local test results from a GWR raises the problem of running multiple significance tests, Mennis ([52]) and Tsai ([53]) recommend that mapping of local parameters should include both the coefficient and the t-value side by side on the same map. When this is done, the reader can effectively visualize where the coefficient results are significant or not. The maps in Figure 2 are therefore provided in accordance with the recommendations of Mennis ([52]) and Tsai ([53]).
Figure 2a, classifies individual states based on their component scores (PCA loadings). Only the North-East states of Nigeria (NEN) are fully in the less industrial category, while Lagos and Delta states in the south and the FCT tend towards the industrial category. The remainder of the states load equally on both PCA components- either belong to the less industrial (all from the northern part), or have the attributes of both industrial and less industrial states (Kano, Kaduna, Nasarawa, Kogi and Kwara in the north and all the southern states with the exception of Lagos and Delta states). The standardised residuals indicate where the unusually high and low residuals are located. Surprisingly, the majority of the states that consume a high percentage of fuelwood (see for example, [30], p. 162-164 and Figure 3) have positive residuals (Std Res >0.5). However, some states in the south that use less fuelwood have positive residuals, while a few from the north that use large amounts of fuelwood have negative residuals. The model, therefore, highlights possibilities of over or under-prediction of the fuelwood use in those states. Evidence from the spatial autocorrelation tests on the GWR residuals, shows that p = 0.30, which indicates minimal autocorrelation in the results. This implies the observed residual values do not indicate statistical problems with the model. So it is appropriate to report the final coefficients from the model as they stand, taking aboard the likelihood of over or under estimation of parameters in some states.
The sign of the coefficients for the industrial states component with fuelwood use (Figure 2 b) indicate a negative relationship. This is in the expected direction, because, where there are a large number of flats in a block of flats, rented accommodation, educated adults, and an ample supply of fossil fuel, fuelwood use will tend to decrease. However, the range of the coefficient values is only between -11.34 in the north and -15.14 in the southern states. These small variations in the negative coefficients indicate that there is little variation in the nature of fuelwood use among the industrial states. The t-test values (Figure 2 c) confirm the significance of these coefficients. This may be because the lifestyles of the people in the industrial states are more homogeneous, in terms of competitive urban/ industrial employment, than in the less industrial states. Also, family settings are more of a nuclear type, which will increase the chance of using fossil fuels rather than fuelwood, due to space restrictions. Another factor that may affect the use of fuelwood in the industrial states is the long hours most people spend away from home in the office or workplace. This contrasts with the lifestyle of traditional agricultural families in the less industrial states whose work commitments vary with the passage of the seasons (rainfed agriculture).
Figure 2. Spatial Distribution of the Parameter Estimates of Fuelwood Consumption in Nigeria
Conversely, the strong positive relationship shown by the coefficients for less industrial states (7 to 11.09) (Figure 2 d), is also in the expected direction. This is because, when there are numerous households with extended family systems, rural detached houses and compounds, it is likely that in these rural settings, the vast majority of the population will practice subsistence farming (rain fed agriculture), and rely on locally available resources, especially from their farms. This situation reflects the nature of Nigerian society, where the majority of the population still depend on subsistence agriculture [54]. The t-test value of the coefficients (Figure 2 e) confirmed the significance of the direction of association between the less industrial components and fuelwood use.

4. General Discussion

Figure 3 is an overview of the various cooking energy used among households in Nigeria. The figure revealed that more fuelwood is being used for cooking than any other fuel type. Also, only Lagos state uses less fuelwood than other fuel types, while between 30% to 70% of households in each of the remaining 36 states including Abuja primarily use fuelwood for their cooking. It is noticeable that the north has the highest level of fuelwood usage compared with other sources of cooking fuel.
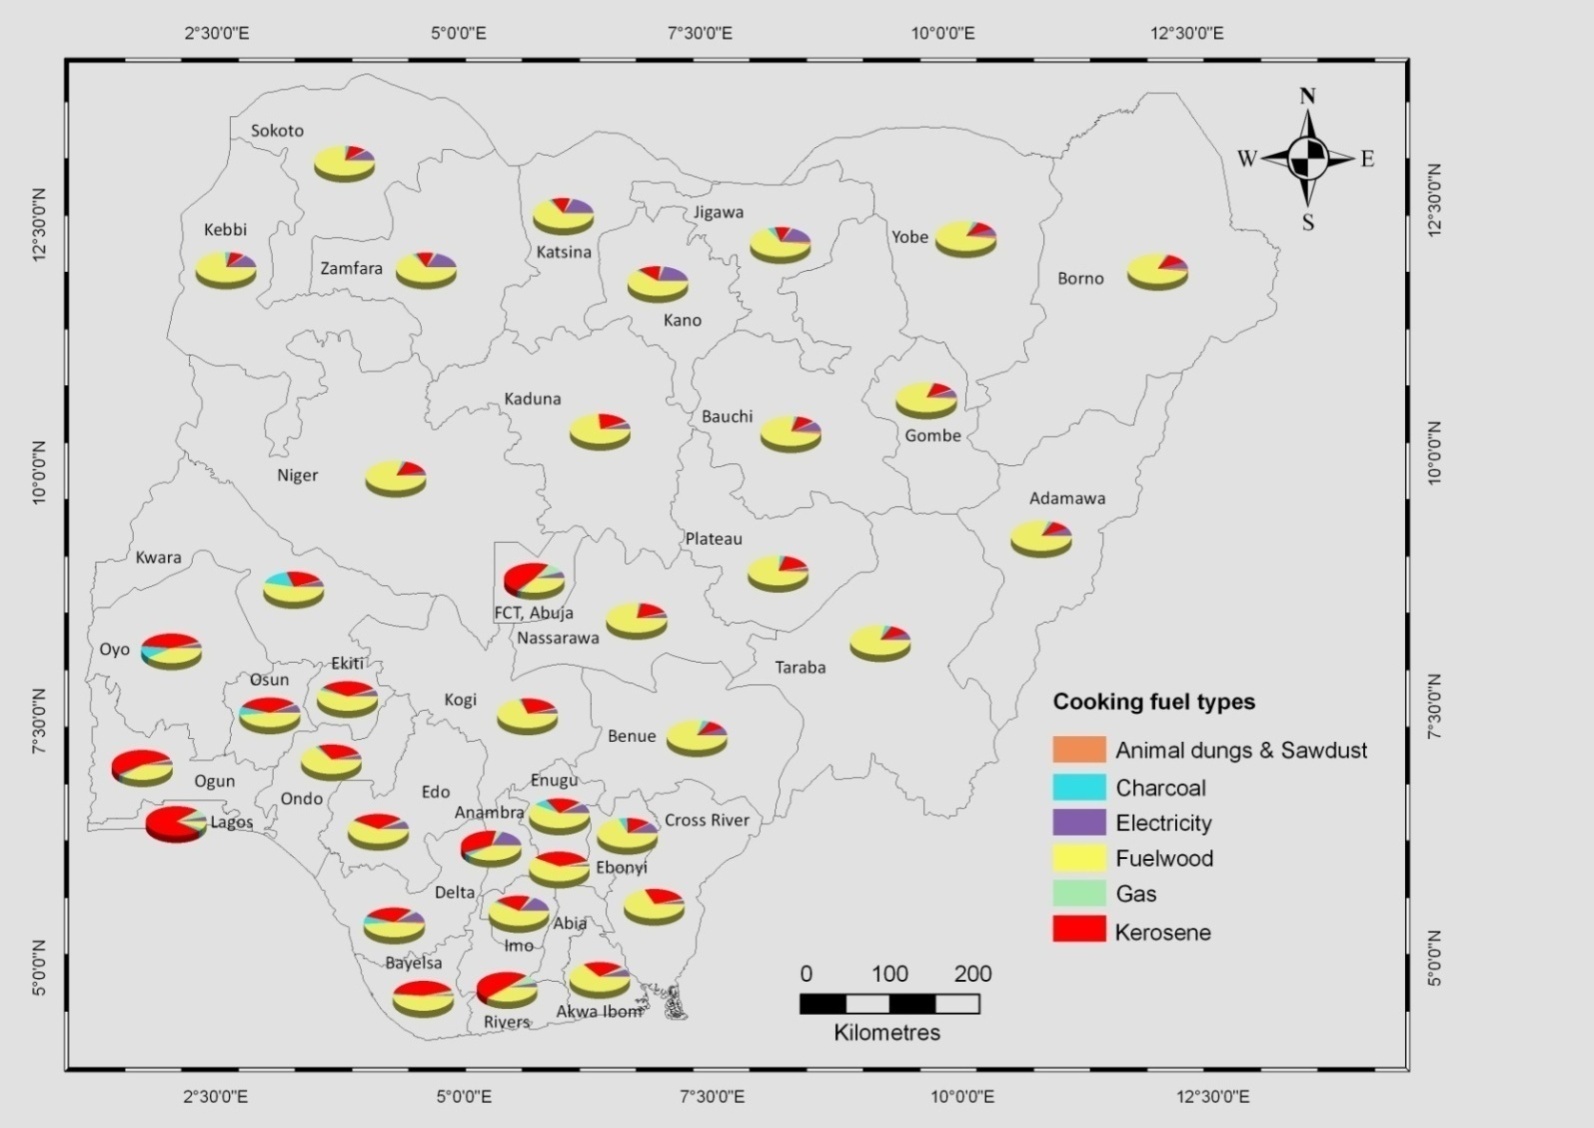
Figure 3. Different cooking fuel types used among households (Source: [30])
The coefficient parameter results from Figure 2 are in agreement with the results shown in Figure 3, which further revealed that the majority of the less industrial states (northern states) of Nigeria predominantly use fuelwood for their cooking, while their southern counterparts use modern fuels. However, it should be noted that the north has the highest level of unemployment [55] and poverty, as well as the lowest level of education in the country since the 1980s ([37], p. 63). The level of poverty, education and unemployment are attributable factors for the dependence on fuelwood in northern Nigeria [30].
Conversely, the findings of this paper also reveal that the relationships involved in fuelwood usage do not vary as much among the majority of the states in the country as might be anticipated. However, while there is a limited supply of modern cooking fuel in the country [30], the use of fuelwood in the majority of the northern states is related to the low supply of fossil fuel in the region [29-30]. In an attempt to answer the question, ‘why are there differences in the fossil fuel supply among the various states?’ Naibbi and Healey ([30], p.167) reported that “there is no clear answer as to why there are substantial differences in modern fuel supply in Nigeria, which favour a few states in the country”. It was concluded that population size and industrial activities do not explain the high or low supply of modern fuels in the country. Also, family size (extended family) and cultural values in the north are among the other factors noted for the use of fuelwood in the north (see for example, [29] & [36]). The results here also reveal that those states with a large supply of fossil fuels (industrial states, Figure 2b) are less likely to be using fuelwood. Similarly, attainment of high average levels of education does not necessarily result in a reduction in fuelwood use (see Figure 2 b).

5. Conclusions

The scale (state level) at which the investigation was necessarily conducted may have concealed localised but important differences, which have therefore not been identified and reported. However, the use of the state boundaries rather than Local Government Area (LGA) boundaries (which were provided by the census data) was a result of the unavailability of fossil fuel distribution information at a similar scale to the census data.
GWR has not previously been used in this kind of study; however, it has demonstrated its relevance as an exploratory tool here. The GWR has proven useful in explaining the spatial variation of fuelwood usage in Nigeria. The method can be particularly effective in this kind of study, because of its ability to identify regional variations in the operation of more general processes. The national situation of fuelwood utilization is now clear. The south region (industrial states), where extensive forest vegetation exists [7], used less fuelwood while the less industrial states (northern region, with its savanna vegetation) uses more fuelwood than the south.
Even though improved supply of modern fuel has frequently been emphasised as a possible option to reduce fuelwood utilization in Nigeria, in the medium/long-term, as things stand, fuelwood will remain the preferred cooking fuel option for the majority of the families, for a very long time to come. Also, as accessible areas of forest continue to decline, especially in northern states ([22] & [56], it is inevitable that fuelwood collection will progressively extend beyond local borders in the near future.

ACKNOWLEDGEMENTS

This research was funded by the Nigerian Petroleum Technology Development Fund (PTDF). We also like to thank the reviewers for their comments and suggestions.

Notes

1. In 2012 Nigeria generated 5,000 megawatts (MW) of electricity for its approximate 170 million population, as compared to at least 40,000 MW, which is required to sustain the basic needs of such a population [13].

References

[1]  United Nations (UN), (2012). General assembly A/67/257 accelerating progress towards the millennium development goals: Options for sustained and inclusive growth and issues for advancing the United Nations development agenda beyond 2015. Annual Report to the Secretary General, United Nations, New York.
[2]  Florini, A. & Sovacool, B.K. (2009). Who governs energy? The challenges facing global energy governance. Energy Policy, 37(12): 5239 – 5248.
[3]  Cherp, A., Jewell, J. & Goldthau, A. (2011). Governing global energy: systems, transitions, complexity, Global Policy, 2(1): 75 – 88.
[4]  Scott, A. (2012). The energy trilemma for developing countries, ODI development progress blog. http://www.developmentprogress.org/blog/2012/08/03/energy-trilemma-developing-countries (February 11, 2013).
[5]  United Nations Development Programme (UNDP), (2005). Energizing the millennium development goals- a guide to energy’s role in reducing poverty. Bureau for Development Policy Energy and Environment Group. New York. www.undp.org/energyandenvironment (January 10, 2012).
[6]  Brew-Hammond, A. & Kemausuor, F. (2009). Energy for all in Africa—to be or not to be?! Current Opinion in Environmental Sustainability, 1:83–88.
[7]  Food & Agriculture Organization of the United Nations (FAO), (2010). Global Forest Resource Assessment Main Report 2010. FAO Forestry paper, 163. http://foris.fao.org/static/data/fra2010/FRA2010_Report_en_WEB.pdf (July 25, 2013).
[8]  Kebede E., Kagochi, J. & Jolly, C.M. (2010). Energy consumption and economic development in Sub-Sahara Africa. Energy Economics, 32 : 532–537
[9]  Deichmann, U., Meisner, C., Murray, S. & Wheeler, D. (2011). The economics of renewable energy expansion in rural Sub-Saharan Africa. Energy Policy 39: 215–227.
[10]  International Energy Agency (IEA), (2011). Energy for all: financing access for the poor – special early excerpt of the World Energy Outlook 2011. OECD/IEA, Paris.
[11]  Odularu, G.O. & Okonkwo, C. (2009). Does energy consumption contribute to economic performance? Empirical evidence from Nigeria. Journal of Economics and International Finance, 1 (2): 44-58.
[12]  Olise M. & Nria-Dappa, T. (2009). Overcoming Nigeria’s energy crisis: towards effective utilisation of associated gas and renewable energy resources in the Niger Delta. Social Development Integrated Centre Social Action Briefing No. 2. Port Harcourt, Nigeria. www.saction.org - accessed 10/07/ 2011.
[13]  United Nations Development Programme (UNDP), (2010). Human Development Report: The real wealth of nations: pathways to human development. New York: Palgrave Macmillan for the United Nations Development Programme, p.162-191.
[14]  Research & Markets, (2011). Electric power sector in Nigeria 2010. http://bit.ly/hTkUkt -accessed 28/12/2012.
[15]  Energy Commission of Nigeria (2003). Federal Republic of Nigeria National Energy Policy. The Presidency. http://www.wacee.net/getattachment/21cca4e4-ef1b-4c59-8501-98b3e8624b88/National_Energy_Policy_Nigeria.pdf.aspx - accessed 28/12/2013
[16]  Anozie, A. N., Bakare, A.R., Sonibare, J.A. & Oyebisi, T.O. (2007). Evaluation of cooking energy cost, efficiency, impact on air pollution and policy in Nigeria. Energy 32: 1283–1290.
[17]  Adeoti, O., Idowu, D. O. O. & Falegan, T. (2001). Could fuelwood use contribute to household poverty in Nigeria? Biomass & Bioenergy, 21(3): 205-210.
[18]  Ehinomen, C. & Adeleke, A. (2012). An assessment of the distribution of Petroleum products in Nigeria. E3 Journal of Business Management and Economics, 3(6): 232-241.
[19]  Hyman, E. L. (1994). Fuel substitution and efficient woodstoves - are they the answers to the fuelwood supply problem in Northern Nigeria. Environmental Management, 18(1): 23-32.
[20]  Hiemstra-van der Horst, G. & Hovorka, A. J. (2009). Fuelwood: The "other" renewable energy source for Africa?. Biomass & Bioenergy, 33(11): 1605-1616.
[21]  Sambo, A.S. (2005). Renewable Energy for Rural Development: The Nigerian Perspective. ISESCO, science and technology vision. 1 : 12 – 22.
[22]  Food & Agriculture Organization of the United Nations (FAO), (2011). Wood energy. http://www.fao.org/forestry/energy/en/ (September 28, 2012).
[23]  Mahiri, I. O. (2003). Rural household responses to fuelwood scarcity in Nyando District, Kenya. Land Degradation & Development, 14(1): 163-171.
[24]  Aron, J., Eherhard, A.A., & Gandar, M.V. (1991). Fuelwood deficits in rural South-Africa. Biomass & Bioenergy, 1(2): 89-98.
[25]  Ali, J. & Benjaminsen, T. A. (2004). Fuelwood, timber and deforestation in the Himalayas - The case of Basho Valley, Baltistan Region, Pakistan. Mountain Research and Development, 24(4): 312-318.
[26]  Shackleton, C.M.; McConnachie, M.; Chauke, M.I.; Mentz, J.; Sutherland, F.; Gambiza, J., & Jones, R. (2006). Urban fuelwood demand and markets in a small town in South Africa: Livelihood vulnerability and alien plant control. International Journal of Sustainable Development and World Ecology, 13(6): 481-491.
[27]  Ghilardi, A., Guerrero, G., & Masera,O. (2007). Spatial analysis of residential fuelwood supply and demand patterns in Mexico using the WISDOM approach. Biomass & Bioenergy, 31(7), 475-491.
[28]  Ghilardi , A., Guerrero, G. & Masera,O. (2009). A GIS-based methodology for highlighting fuelwood supply/demand imbalances at the local level: a case study for Central Mexico. Biomass Bioenergy, 33(6-7): 957-972.
[29]  Maconachie, R., Tanko, A. & Zakariya, M. (2009). Descending the energy ladder? Oil price shocks and domestic fuel choices in Kano, Nigeria. Land Use Policy, 26 (4): 1090-1099.
[30]  Naibbi, A. I. & Healey, R. G. (2013). Northern Nigeria’s Dependence on Fuelwood: Insights from Nationwide Cooking Fuel Distribution Data. International Journal of Humanities and Social Science, 3(17): 160-173.
[31]  Arabatzis, G., Kitikidou, K., Tampakis, S. & Soutsas, K. (2012). The fuelwood consumption in a rural area of Greece. Renewable and Sustainable Energy Reviews 16: 6489–6496.
[32]  Sambo, A.S. (2009). The Challenges of Sustainable Energy Development in Nigeria. Paper Presented at the “Nigerian Society of Engineers Forum”, 2nd April , 2009 at Shehu Yar’Adua Centre, Abuja.
[33]  Food & Agriculture Organization of the United Nations (FAO), (2003). Experience of implementing national forestry programmes in Nigeria. Sustainable forest management programmes in African ACP countries. http://www.fao.org/DOCREP/005/AC918E/AC918E04.htm (October 10, 2012).
[34]  Forestry Management Evaluation and Coordinating Unit (FORMECU), (n.d). Nigerian Ecological Zones. Federal Department of Forestry, Federal Ministry of Agriculture and Rural Development, Abuja.
[35]  Sambo, A.S. (2008). Renewable Energy Options for the Environment and Sustainable Development in Nigeria. Paper Presented At The National Workshop On Energy Investment And Private Sector And Participation At The Petroleum Training Institute, Warri.
[36]  Odihi, J. (2003). Deforestation in afforestation priority zone in sudano-sahelian Nigeria. Applied Geography, 23:227-259.
[37]  United Nations Development Programme (UNDP), (2009). Human Development Report, Nigeria 2008 – 2009: Achieving growth with equity. Published for the United Nations Development Programme (UNDP), Nigeria.
[38]  Kar, D. & Freitas, S. (2012). Illicit financial flows from Developing Countries: 2001-2010. Global Financial Integrity Report, Washington.
[39]  Field, A. (2009). Discovering Statistics Using SPSS. Third Edition, SAGE Publications Ltd, London.
[40]  Fotheringham, A.S., Brunsdon, C. & Charlton, M. (2002). Geographically weighted regression: The Analysis of Spatially Varying Relationships Wiley: Chichester.
[41]  Brunsdon, C., Fotheringham, S. & Charlton, M., (2007). Geographically Weighted Discriminant Analysis. Geographical Analysis, 39(4): 376-396.
[42]  Brunsdon, C., Fotheringham, A. S. & Charlton, M.E., (1996). Geographically Weighted Regression: A Method for Exploring Spatial Nonstationarity. Geographical Analysis, 28(4): 281-298.
[43]  Charlton, M., Brunsdon, C. & Fotheringham, A. S. (2006). Geographically Weighted Regression. ESRC National Centre for Research Methods NCRM Methods Review Papers NCRM/006. http://eprints.ncrm.ac.uk/90/1/MethodsReviewPaperNCRM-006.pdf (October 25, 2012)
[44]  Bitter, C., Mulligan, G. F. & Dall’erba, S. (2007). Incorporating spatial variation in housing attribute prices: a comparison of geographically weighted regression and the spatial expansion method. Journal of Geographical Systems, 9: 7–27.
[45]  Clement, F., Orange, D., Williams, M., Mulley, C. & Epprecht, M. (2009). Drivers of afforestation in Northern Vietnam: Assessing local variations using geographically weighted regression. Applied Geography 29: 561–576
[46]  Jaimes, N. B. P., Sendra, J.B., Montserrat Gómez Delgado, M.G. & Plata, R. F. (2010). Exploring the driving forces behind deforestation in the state of Mexico (Mexico) using geographically weighted regression. Applied Geography, 30 :576–591.
[47]  Drigo,R. & Salbitano, F. (2008). Woodfuel Integrated Supply/Demand Overview Mapping (WISDOM) for Cities: Analysis of wood energy and urbanization using WISDOM methodology. FAO Forestry Department. Rome. ftp://ftp.fao.org/docrep/fao/010/i0152e/i0152e00.pdf (December 10, 2013).
[48]  National Population Commission (NPC), (2009). 2006 Population and Housing Census of the Federal Republic of Nigeria Priority Tables (Volume I): National and State Population and Housing Tables. Abuja, Nigeria.
[49]  Legros, G., Havet, I., Bruce, N. & Bonjour, S. (2009).The energy access situation in Developing Countries. A review focusing on the least Developed Countries and Sub-Saharan Africa. UNDP Environment and Energy Group, Bureau for Development Policy. New York.www.undp.org/energyandenvironment (December 01, 2012).
[50]  Lenzen, M., Dey, C. & Foran, B. (2004). Analysis of energy requirements of Sydney Households. Ecological Economics, 49: 375– 399.
[51]  Fotheringham, A.S., Brunsdon, C. & Charlton, M. (1998). Geographically weighted regression: a natural evolution of the expansion method for spatial data analysis. Environment and Planning A, 30: 1905-1927.
[52]  Mennis, J. (2006) .Mapping the results of geographically weighted regression. The Cartographic Journal, 43(2): 171-179
[53]  Tsai, P.J. (2011). The analysis of geographically weighted regression pertaining to gastric cancer and Taiwanese ethnic communities. International conference on Environmental, Biomedical and Biotechnology, IPCBEE Vol.16. IACSIT press, Singapore
[54]  National Population Commission (NPC) and ICF Macro, (2009). Nigeria Demographic and Health Survey 2008. Abuja, Nigeria: National Population Commission and ICF Macro.
[55]  Eroke, L. (2012). 20.3 Million Nigerians currently Unemployed, Statistics reveal. Thisday Newspaper, 8/10/2012 edition.
[56]  Naibbi, A. I., Baily, B. Collier, P. & Healey, R. G. (2014). Changing vegetation patterns in Yobe State, Nigeria: An analysis of the rates of change, potential causes and the implications for sustainable resource management. International Journal of Geosciences,5(1):50-62. DOI: 10.4236/ijg.2014.51007.